the Creative Commons Attribution 4.0 License.
the Creative Commons Attribution 4.0 License.
 | 20 Jul 2018
Climate information preserved in seasonal water isotope at NEEM: relationships with temperature, circulation and sea ice
Florian Adolphi
Bo Møllesøe Vinther
Hans Christian Steen-Larsen
Trevor James Popp
Raimund Muscheler
Analyzing seasonally resolved δ18O ice core data can aid the interpretation of the climate information in ice cores, also providing insights into factors governing the δ18O signal that cannot be deciphered by investigating the annual δ18O data only. However, the seasonal isotope signal has not yet been investigated in northern Greenland, e.g., at the NEEM (North Greenland Eemian Ice Drilling) ice core drill site. Here, we analyze seasonally resolved δ18O data from four shallow NEEM ice cores covering the last 150 years. Based on correlation analysis with observed temperature, we attribute about 70 and 30 % of annual accumulation to summer and winter, respectively. The NEEM summer δ18O signal correlates strongly with summer western Greenland coastal temperature and with the first principal component (PC1) of summer δ18O from multiple seasonally resolved ice cores from central/southern Greenland. However, there are no significant correlations between NEEM winter δ18O data and western Greenland coastal winter temperature or southern/central Greenland winter δ18O PC1. The stronger correlation with temperature during summer and the dominance of summer precipitation skew the annual δ18O signal in NEEM. The strong footprint of temperature in NEEM summer δ18O record also suggests that the summer δ18O record rather than the winter δ18O record is a better temperature proxy at the NEEM site. Despite the dominant signal of the North Atlantic Oscillation (NAO) and the Atlantic Multidecadal Oscillation (AMO) in the central–southern ice core data, both NAO and AMO exert weak influences on NEEM seasonal δ18O variations. The NEEM seasonal δ18O is found to be highly correlated with Baffin Bay sea ice concentration (SIC) in the satellite observation period (1979–2004), suggesting a connection of the sea ice extent with δ18O at NEEM. NEEM winter δ18O significantly correlates with SIC even for the period prior to satellite observation (1901–1978). The NEEM winter δ18O may reflect sea ice variations of Baffin Bay rather than temperature itself. This study shows that seasonally resolved δ18O records, especially for sites with a seasonal precipitation bias such as NEEM, provide a better understanding of how changing air temperature and circulation patterns are associated with the variability in the δ18O records.
- Article
(4304 KB) -
Supplement
(4048 KB) - BibTeX
- EndNote


Stable water isotopes in Greenland ice cores, e.g., δ18O, provide key information on temperature (Küttel et al., 2012), moisture sources (Masson-Delmotte et al., 2005b), sea ice extent (Noone and Simmonds, 2004) and atmospheric circulation (Vinther et al., 2003). The available data have revealed the complexity of the integrated information preserved in the stable water isotope composition of Greenland ice cores (Masson-Delmotte et al., 2005a), thereby illustrating the need for improving our understanding of its climatic controls. Recent studies indicate that having not only the annual but also seasonally resolved ice core δ18O data represents a significant improvement in the interpretation of the δ18O signal (Vinther et al., 2003, 2010). For example, Ortega et al. (2014) indicated that the seasonal δ18O records allow us to reconstruct the variability in weather regimes in the North Atlantic region.
Vinther et al. (2010) extracted the seasonal δ18O from 13 sites in central and southern Greenland. However, seasonally resolved data are still lacking from northern Greenland, for example, from the NEEM (North Greenland Eemian Ice Drilling; 77.45∘ N, 51.06∘ W, 2450 m a.s.l., Fig. 1) ice core. The NEEM project originally aims to retrieve an ice core record spanning the last interglacial period (Neem community members, 2013). To assist interpreting the stable isotope record along the deep ice core, several shallow firn/ice cores were also drilled around the camp as part of the exploration program. Through investigating these short cores, the results suggest that the NEEM annually resolved δ18O records correlate unexpectedly weakly with the annual and winter North Atlantic Oscillation (NAO) signal (Steen-Larsen et al., 2011; Masson-Delmotte et al., 2015). This contrasts with δ18O records from the central and southern part of Greenland that strongly correlate with the winter NAO signal (Vinther et al., 2003, 2010). Regional to global atmospheric models show that precipitation at NEEM is dominated by summer precipitation, which may contribute to the lack of the winter NAO fingerprint in annual NEEM δ18O records (Steen-Larsen et al., 2011). This seasonal precipitation bias may skew the annual δ18O signal towards summer precipitation and cause a weak correlation with the NAO which exerts its strongest influence on Greenland weather in winter. Indeed, there is no explanation yet for the strong correlation between the first principal component (PC1) of 16 annually resolved Greenland δ18O records and NEEM annual δ18O records despite the missing NAO fingerprint in NEEM data (Masson-Delmotte et al., 2015). Furthermore, Steen-Larsen et al. (2011) found that the annual sea ice extent anomaly in Baffin Bay explains up to 34 % of variations in the annual NEEM δ18O record. Hence, studying seasonally resolved NEEM δ18O might help us to explore the possible seasonal relationship with the Baffin Bay ice concentration.
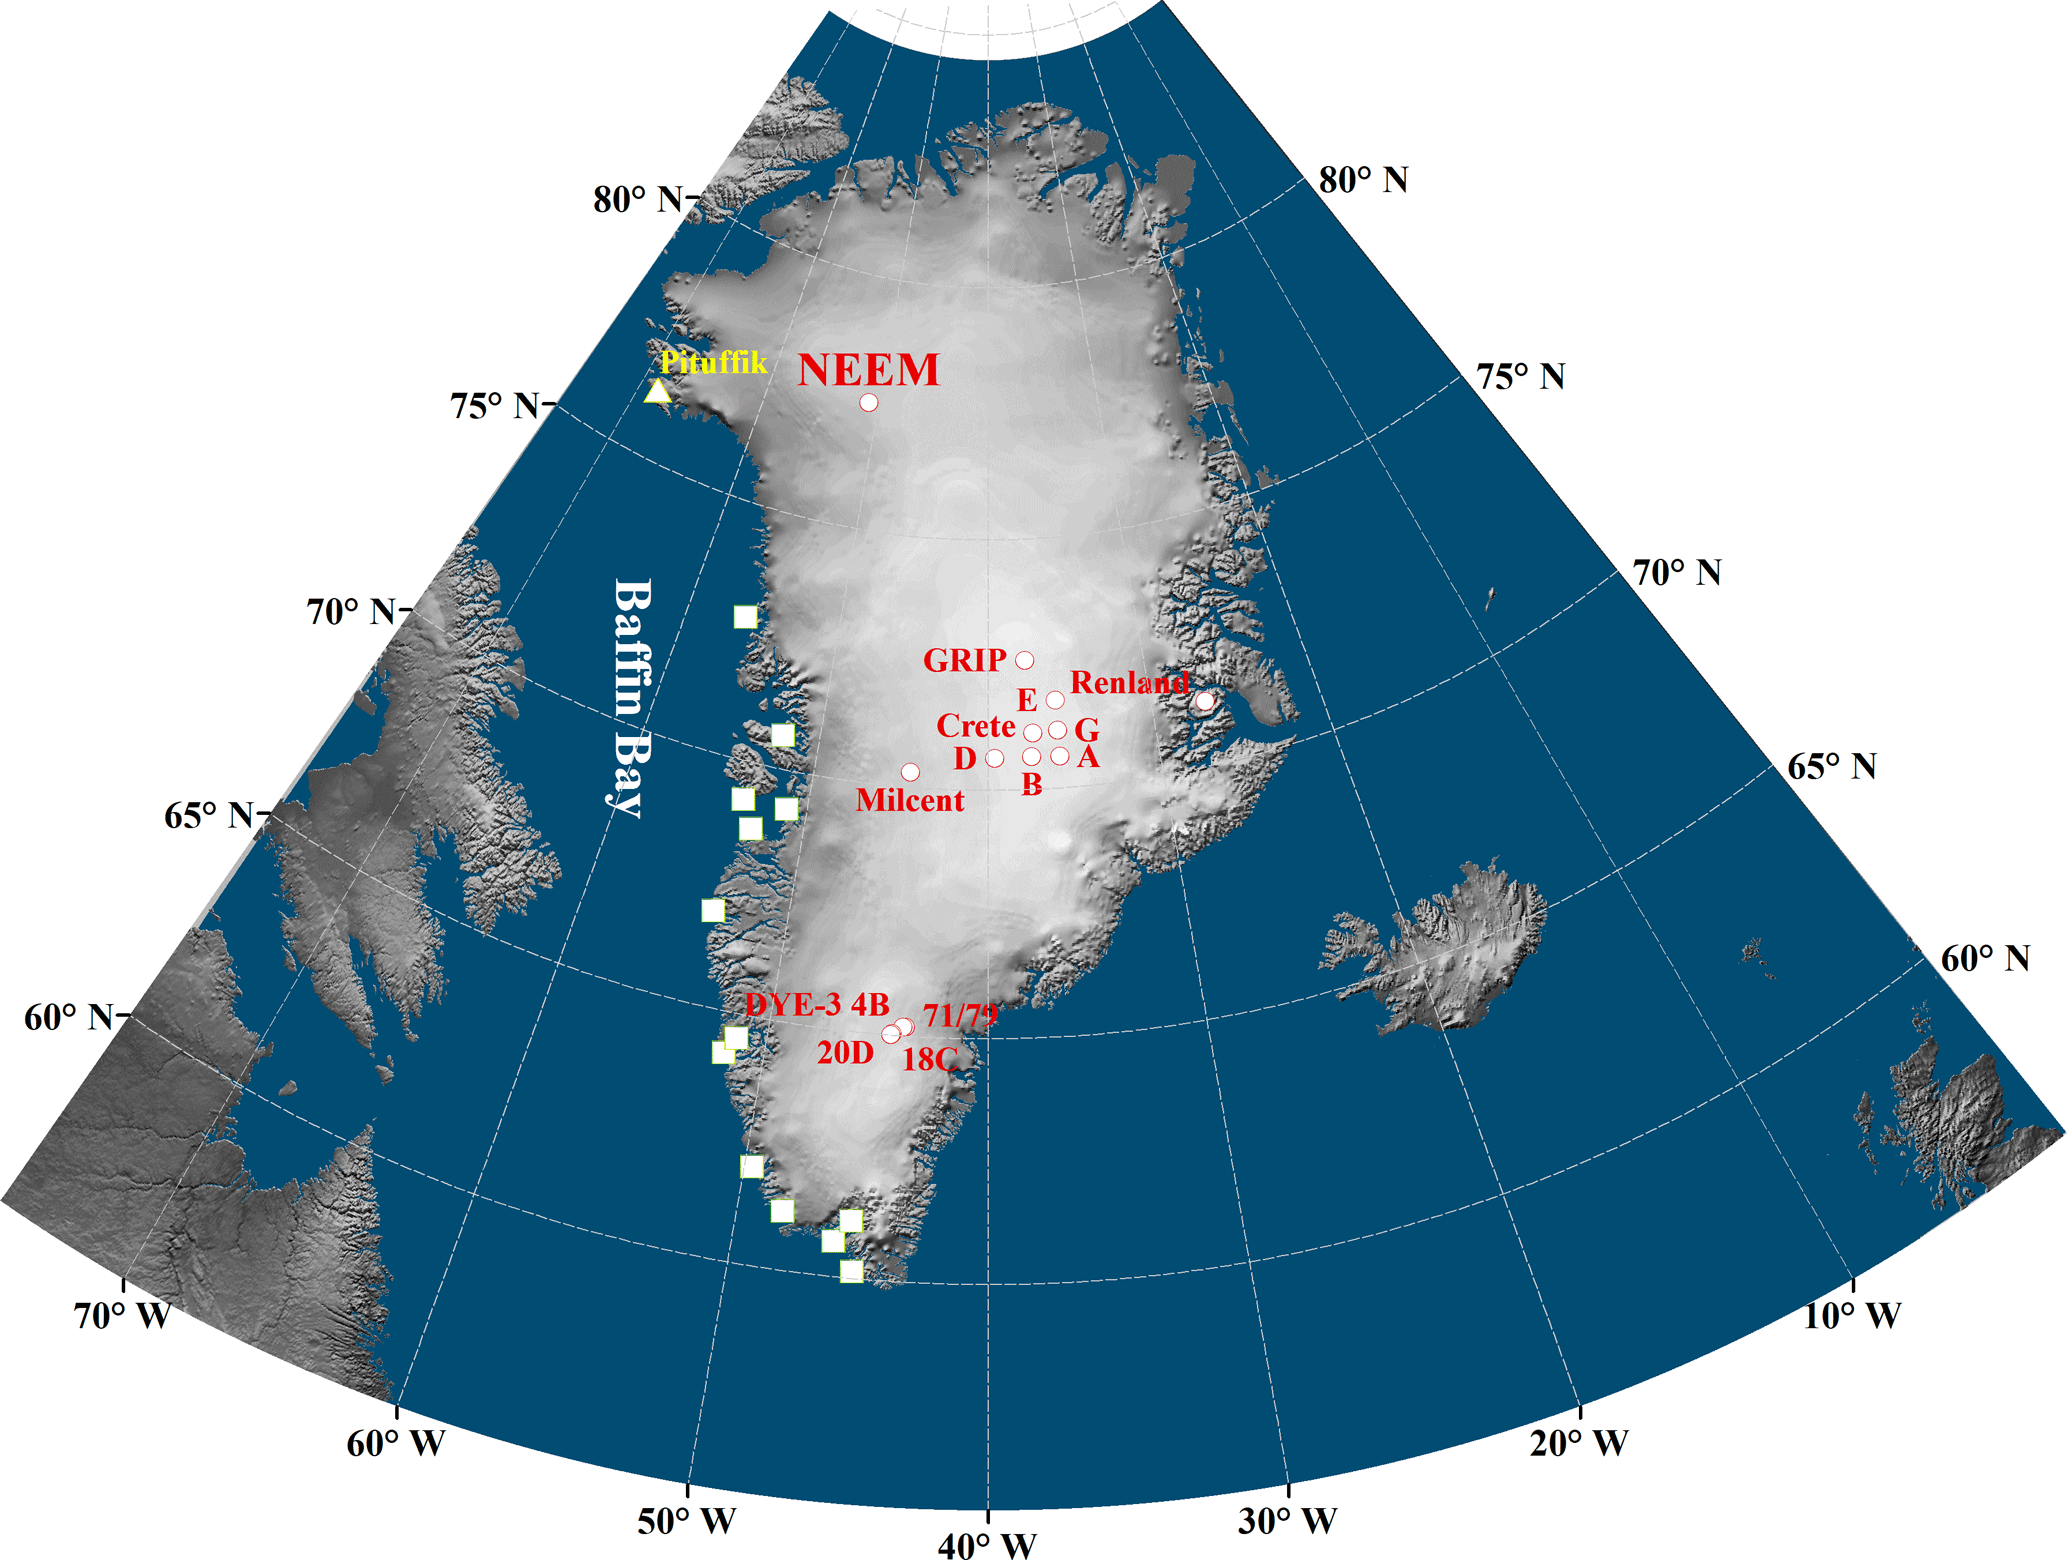
Figure 1The map of Greenland and ice cores and meteorological stations used for this study. The squares indicate the meteorological stations using for SW Greenland temperature series. The Pituffik station is marked as triangle. The ice core sites are shown as circles.
In this study, we follow the approach of Vinther et al. (2010) to extract the winter and summer δ18O signal from four NEEM short cores. To reduce noise, the records are averaged for the overlap period from 1855 to 2004 CE. We then compare the seasonal δ18O NEEM record with other seasonal δ18O records from central and southern Greenland and their PC1 (Vinther et al., 2010). Meteorological parameters like temperature and sea level pressure are also compared with the NEEM seasonal δ18O data to explore temporal and spatial relationships. The Baffin Bay sea ice concentration (SIC) data covering both the satellite period (1979–2004) and the period prior to satellite observation (1901–1978) are also compared with NEEM δ18O data. The aim is to identify the seasonal δ18O signal at NEEM and to investigate which parameters control the NEEM δ18O variations for each season in terms of seasonal weather/climate variability.
2.1 Temperature records
The length of observational records and locations of meteorological stations are crucial for a robust correlation between ice cores and meteorological observations. The Pituffik station is the only observation station in the northwestern part of Greenland (NW Greenland) and the closest one to the NEEM site (Fig. 1; Cappelen, 2017). Although the temperature record only covers the period back to 1948, the Pituffik station is the best source of information on the weather and climate in NW Greenland. As the ice core data span the last 150 years, we also test our δ18O record against longer-term temperature observations from the southwestern part of Greenland (SW Greenland). The SW Greenland temperature record is a merged temperature data set based on 13 observational records along the southwestern Greenland coastal area spanning the period 1784–2005 (Fig. 1; Vinther et al., 2006). This data set covers the complete period of seasonally resolved ice core isotope data from NEEM, facilitating an extended comparison period. The changes in NW Greenland coastal temperatures are regionally consistent around western coastal Greenland (Hanna et al., 2012; Wong et al., 2015). Therefore, some consistency of the SW Greenland temperature record with temperatures closer to NEEM can be expected.
2.2 Twenty Century Reanalysis data
The Twenty Century Reanalysis (20CR; Compo et al., 2011) data set is selected to investigate the relationship between NEEM isotope records and atmospheric circulation patterns and temperature. The 20CR data are a global atmospheric 2 by 2∘ gridded climate model data set only assimilating surface observations of synoptic pressure and using sea surface temperature and sea ice concentration as boundary conditions (Compo et al., 2011). This data set provides estimates of global atmospheric variability spanning 1851 to 2012 at 6-hourly resolution. However, there are very few stations delivering pressure data over the Greenland area until 1922 after which the number of observation stations increases significantly (Compo et al., 2011). This leads to a less well-constrained reanalysis data set for Greenland for the period before 1930. To test the results for the early period, we divide the whole period into two sub-periods (1855–1930 and 1931–2004) and examine correlations with ice core data within these sub-periods. The aim is to investigate the influence of temperature and atmospheric circulation on NEEM seasonal δ18O signals.
2.3 Indices of climate patterns
Previous analyses have related the variability in the Greenland ice core stable water isotopes to changes in the atmospheric North Atlantic Oscillation (NAO; Barlow et al., 1993; Vinther et al., 2003) and the oceanic Atlantic Multidecadal Oscillation (AMO; Chylek et al., 2012). In this study, these two indices are extracted from the 20CR data set. We choose the principal component (PC)-based NAO (NAOPC) index, which optimally represents the NAO pattern spatially and temporally (Hurrell and Deser, 2009). To obtain the monthly NAOPC index, we performed the empirical orthogonal function (EOF) on monthly pressure anomalies over the Atlantic sector (20–80∘ N, 90∘ W–40∘ E). The leading mode of EOF is used as the monthly NAOPC index. For the AMO index, we first average the sea surface temperature anomalies over the sector 0–60∘ N, 0–80∘ W and then subtract the average sea surface temperature anomalies between 60∘ S–60∘ N from it (Trenberth and Shea, 2006). By calculating indices from the 20CR data, both indices can cover the period 1855–2004.
2.4 Baffin Bay ice concentration
Steen-Larsen et al. (2011) suggested a strong link between annual sea ice cover in Baffin Bay and NEEM annual δ18O signal. To test this hypothesis, we selected the COBEsic sea ice data set to compare with the NEEM seasonal δ18O data. The COBEsic record (Hirahara et al., 2014) is a combination of monthly globally complete fields of sea ice concentration on a 1 by 1∘ grid based on satellite observation starting after 1979 and historical data provided by Walsh and Chapman (2001). The mean Baffin Bay area sea ice concentration was calculated by averaging the values over the area between 65–80∘ N and 80–50∘ W (Tang et al., 2004).
3.1 The NEEM shallow ice core data
The annual δ18O data from four shallow NEEM ice cores (NEEM07S3; NEEM08S2; NEEM08S3; NEEM10S2) have been published by Masson-Delmotte et al. (2015). The shallow cores cover depths ranging from the surface down to between 52.6 and 85.3 m. A back-diffusion calculation following Johnsen et al. (2000) was applied to the δ18O records to restore the original variability and hence improve the identification of individual years. The annual dating of those records was performed by counting the seasonal cycles in δ18O and verified by identifying signals of volcanic eruptions in the electrical conductivity measurements (Masson-Delmotte et al., 2015). The four shallow cores share a common period from 1855 to 2004, which is the focus in this study.
3.2 Greenland seasonal δ18O data
The NEEM seasonal δ18O data are also compared with other seasonal records obtained from 13 sites in central and southern Greenland over the period 1778–1970 (Fig. 1, Vinther et al., 2010). There are no other seasonal δ18O records from northern Greenland. Most records originate from single ice cores while some are stacked records from multiple cores (GRIP, n=6; DYE3-71/79, n=2). The first principal component (PC1) of these ice core data is considered as representative of the seasonal δ18O signal of central and southern Greenland. Vinther et al. (2010) divided the Greenland seasonal δ18O data into summer and winter season corresponding to May–October and November–April, respectively.
To classify the seasons, we assume that the extremes in the seasonal cycle of the δ18O data correspond to the intra-annual temperature extremes (Vinther et al., 2010). According to the SW Greenland and Pituffik temperature records, summer temperature maxima and winter temperature minima usually occur in July/August and January/February, respectively. For summer, we assign the maxima δ18O within the selected year to July/August. For winter, midwinter is already defined as the onset of the annual layers by Masson-Delmotte et al. (2015) based on the analysis of a combination of ice core data. Based on their timescale, we define the onset of the annual layer (midwinter) to January/February. Here, we only investigate the winter and summer season as it is very hard to reliably pinpoint the spring and autumn in the δ18O record. Another essential prerequisite for the classification of seasons is the sufficient accumulation rate to guarantee a clear preservation of the seasonal cycle (no less than an average accumulation of 20 cm ice equivalent per year; Johnsen et al., 2000). At NEEM the estimated accumulation rate is 21.6 cm yr−1 for the present day meeting this requirement (Gfeller et al., 2014).
The calculation of the summer mean δ18O is centered around the δ18O maximum value within the selected year. For the winter, mean δ18O is centered around the onset of annual layer within the selected year. We then take different fractions of annual accumulation symmetrically around the seasonal center. This is done for four ice cores, and these four seasonal δ18O series data are averaged to minimize noise. Finally, we correlate the averaged seasonal δ18O data to the winter and summer temperatures defined with different choices of season length.
Figure 2 shows the result of the correlation analysis between different choices of winter and summer temperatures with different fractions of the NEEM annual δ18O signal. For SW Greenland and Pituffik summer temperature records (Fig. 2a and b), the highest correlations occur between May–October averaged temperature and a fraction of around 70 % annual accumulation. In contrast, there is no significant correlation peak found when comparing NEEM winter δ18O with different choices of winter temperatures in NW and SW Greenland. However, it is interesting to note the correlation peak with the Pituffik temperature record in Fig. 2d at 30 % annual accumulation although not significant, which complements the result for the summer δ18O–temperature correlation. For the winter signal the most significant correlation is obtained when the annual average SW Greenland temperature (August–July; Fig. 2c) is compared with annual average δ18O data (100 % of the annual accumulation centered around midwinter). This significant correlation is likely due to the fact that the annually resolved δ18O includes the summer signal, which indicates high correlation with annual average temperature that includes a strong imprint of the summer temperature. Furthermore, the correlation between NEEM winter δ18O data and SW Greenland temperature shows no correlation peak, which is quite different from the one with the Pituffik record (Fig. 2d). The different relationships (Fig. 2c and d) suggest that the correlation between temperature and NEEM winter δ18O may vary for different periods. However, it should be noted that the Pituffik and SW Greenland temperature records represent different parts of Greenland climate over different time spans. We further examine the correlation between δ18O and SW Greenland temperature for 1949–2004 (Fig. S1 in the Supplement). As expected, the correlation with SW Greenland over the period 1949–2004 displays similar dependencies as the one shown in Fig. 2b and d for the Pituffik station, supporting the conclusion of a changing relationship between winter δ18O and western Greenland temperatures over time. This weak and varied correlation of winter δ18O and temperature can likely be attributed to the intermittent and low winter precipitation at NEEM (Steen-Larsen et al., 2011). The correlation for SW Greenland during 1949–2004 shows the most significant correlations at a higher annual accumulation for summer (80 % for April–November) and a lower one for winter (peak at 20 %). This result is consistent with the one indicated by Pituffik records.
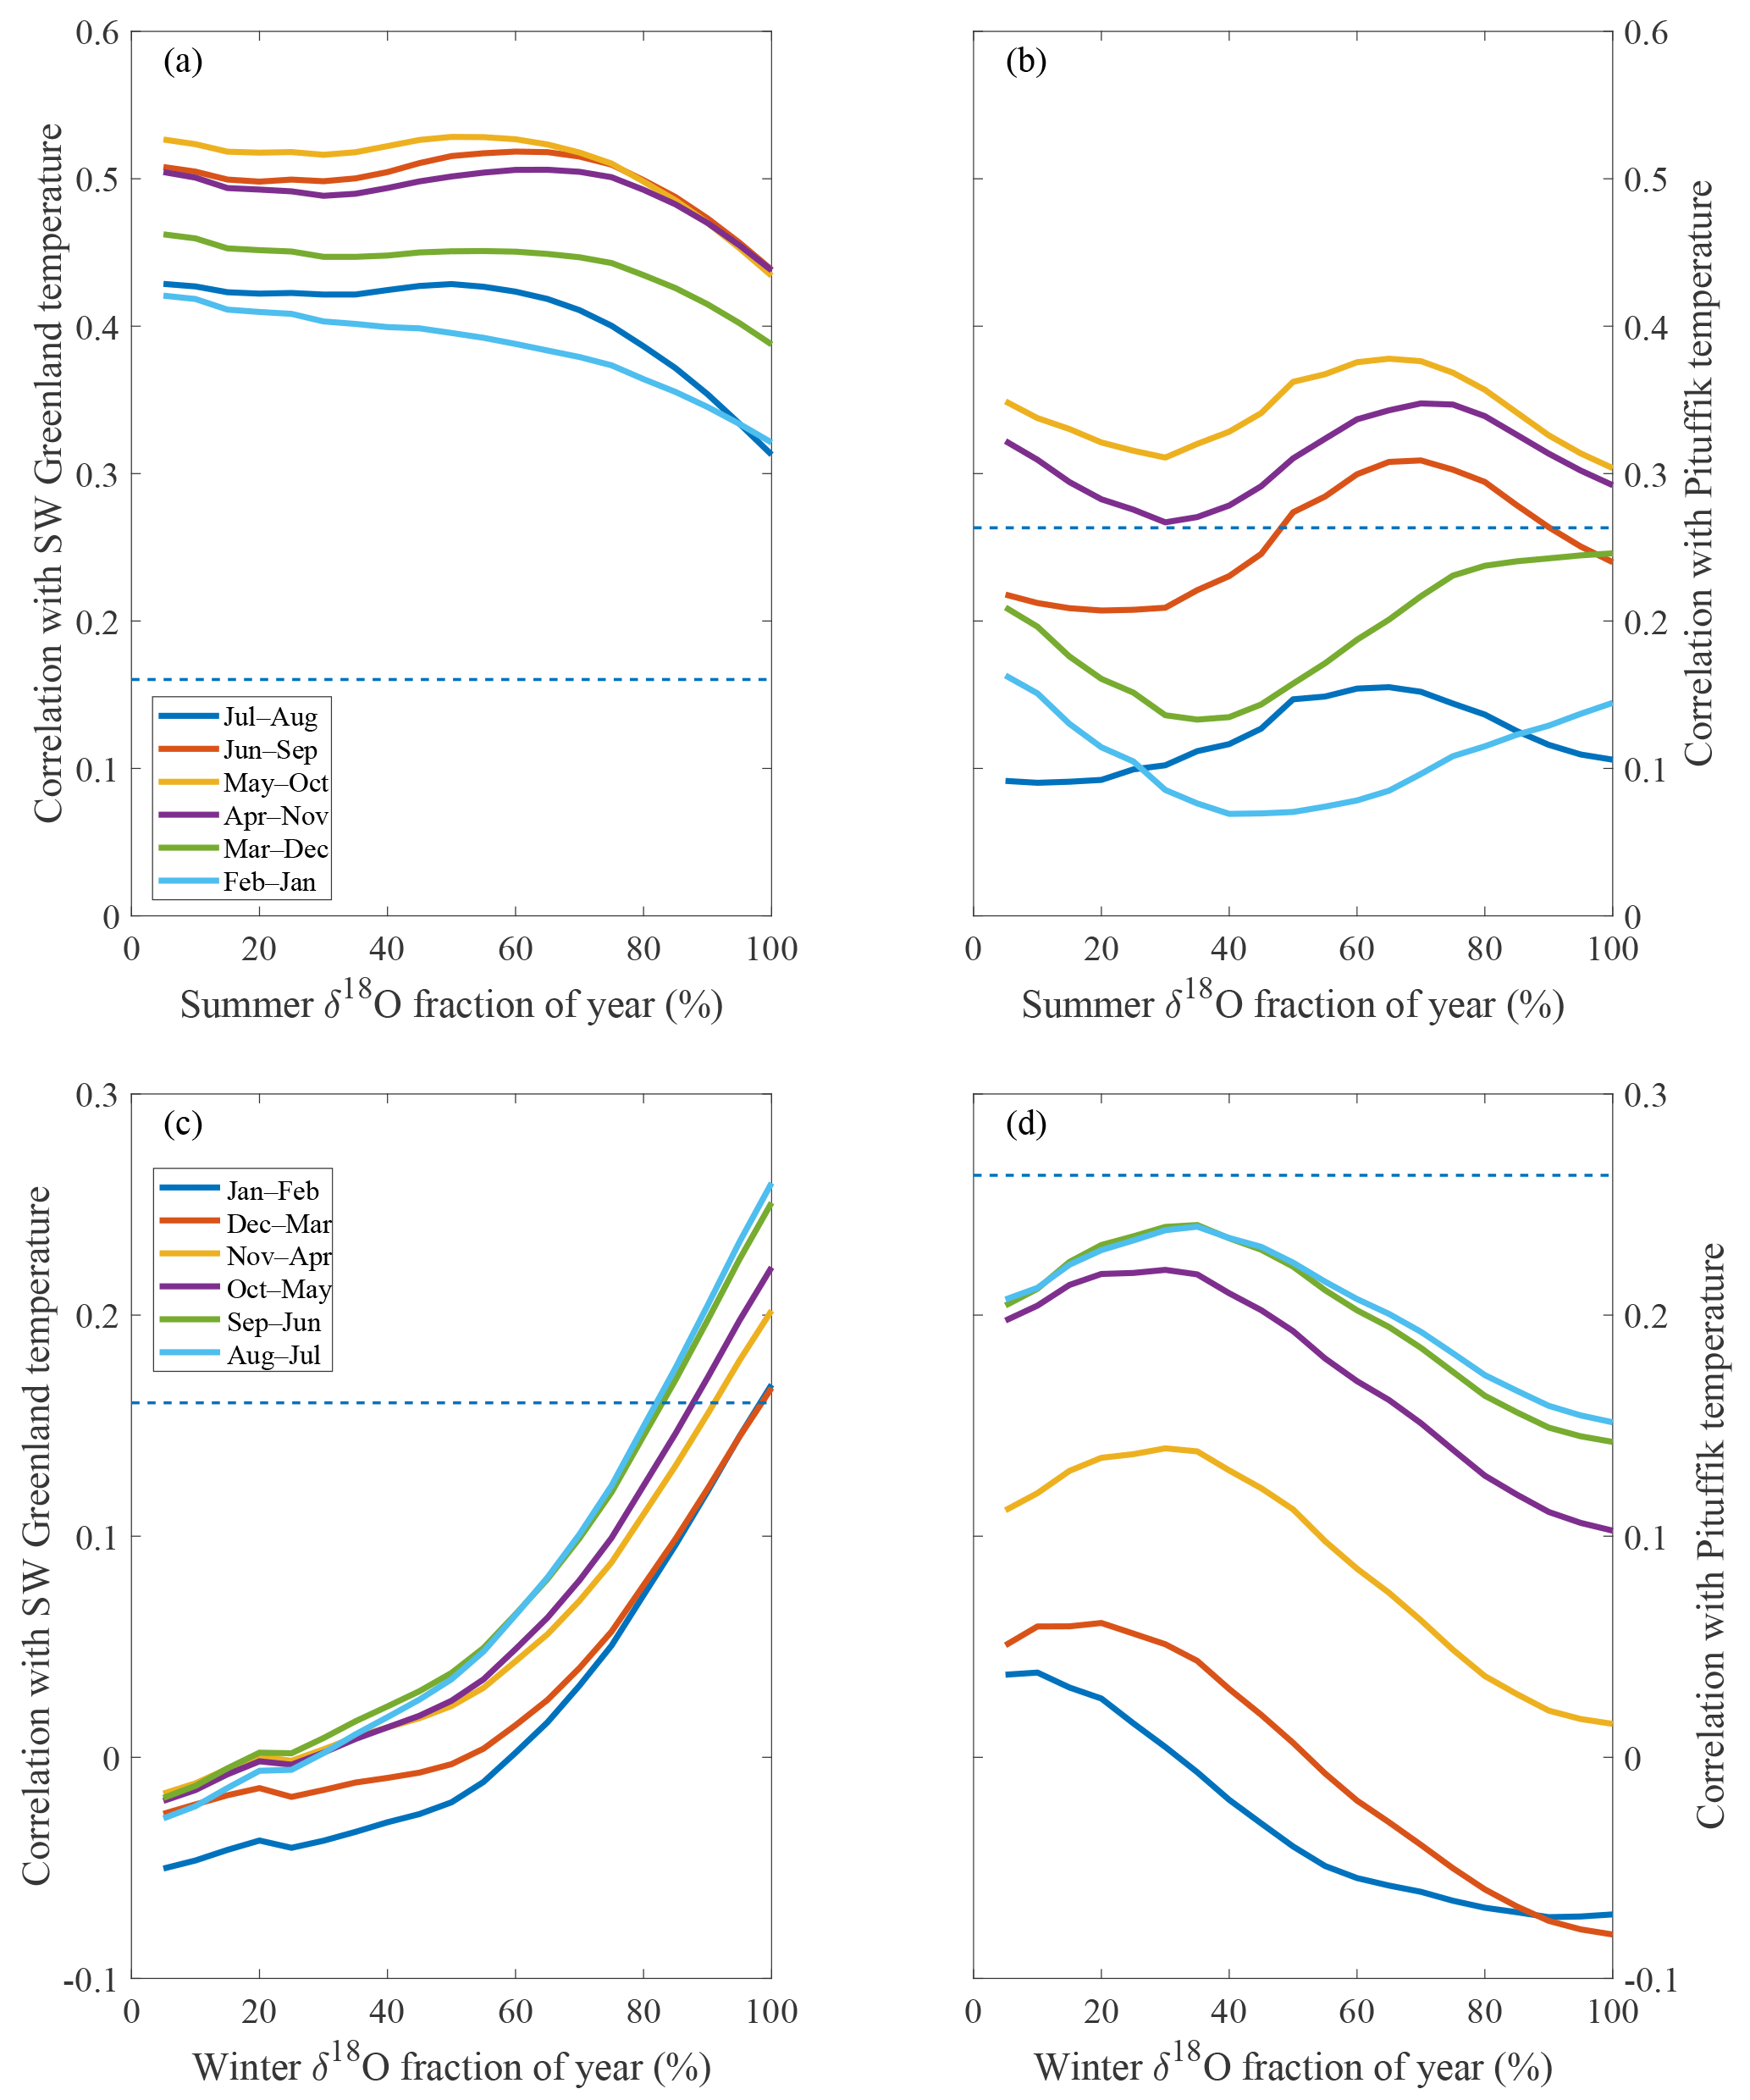
Figure 2Correlation coefficients between stacked data of seasonal δ18O and SW Greenland (a, c) and Pituffik (b, d) measurement temperature records depending on variously defined choices of seasonal δ18O data. The analysis covers 1855–2004 for the SW Greenland record and the period 1949–2004 for the Pituffik record. The 95 % confidence level is marked as dashed line (t test).
Based on these results we conclude that, on average, about 70 % of annual accumulation occurs between May–October, while the remaining 30 % of annual accumulation occurs during November–April. We note that irrespectively of the actual process, recording the δ18O in the snow as being either precipitation-weighted δ18O, a signal only driven by atmospheric water vapor isotopes as suggested by Steen-Larsen et al. (2014) or a combination of the both would still hold. An example of the definition of seasons chosen is shown in Fig. S2. This conclusion is based on the strong and consistent correlation with two summer temperature data sets and the correlation peak for winter shown in Fig. 2d. This conclusion is further supported by the comparison with the measured precipitation data in Pituffik station over the 1949–2000. Although the precipitation data are incomplete (almost no available data for 1976–1993), the average ratio of summer (May–October averaged) to winter (November–April averaged) precipitation over 1946–2000 is around 2, which is similar to the accumulation ratio in this study (summer/winter = 2.3). This season definition also accords with seasonal classification in central and southern Greenland (Vinther et al., 2010).
Generally, the temperature imprint on NEEM δ18O is higher during summer than winter. The NEEM summer δ18O, rather than NEEM winter δ18O, is a better temperature proxy for the NEEM site and likely for northwestern Greenland. This result is in contrast with the finding that winter δ18O records in central/southern Greenland have been shown to be the better temperature proxy for past Greenland temperature conditions (Vinther et al., 2010). Therefore, one should be cautious when combing the NEEM seasonal δ18O with other ice core data for use in temperature reconstructions. Another interesting feature is the dominant summer precipitation at the NEEM site (contributing to 70 % of annual accumulation) compared to the ice cores in the central/southern Greenland (50 % of annual accumulation for both season). Even though the investigated period only covers the last 150 years, knowing this seasonal variability can aid the climate interpretation of the long-term δ18O variability. For example, climate model simulations suggest that seasonality changes over time with a decrease in winter precipitation during the glacial period, which would strongly affect sites with considerable winter accumulation, while being potentially less important for the sites, such as NEEM, with little winter accumulation (Werner et al., 2000).
5.1 NEEM records and signal-to-noise ratio
For low accumulation sites like NEEM, it is important to examine the mean signal-to-noise variance ratio (SNR) of four seasonal δ18O series. The SNR can be calculated as
(more details can be found in Vinther et al., 2006). Here, is the mean variance of the records going into this analysis, N is the number of records and Va is the variance of the average record.
The SNR for the δ18O data in NEEM cores is 0.64 for the winter and 1.28 for the summer. The winter δ18O is more strongly influenced by noise than the summer signal, possibly due to windier conditions that lead to a more disturbed signal by sastrugi formation and less snow accumulation than during summer. These two SNRs are in line with a previous study by Masson-Delmotte et al. (2015) that found a SNR of 1.3 for the annual NEEM δ18O. Note that the seasonal SNRs observed here are higher than the level obtained for six ice cores from the GRIP project (0.57 for winter and 0.89 for summer; Vinther et al., 2010). Therefore, we conclude that the set of these four ice cores is sufficient to extract a robust seasonal δ18O at NEEM.
5.2 Comparison with other seasonal Greenland ice core records
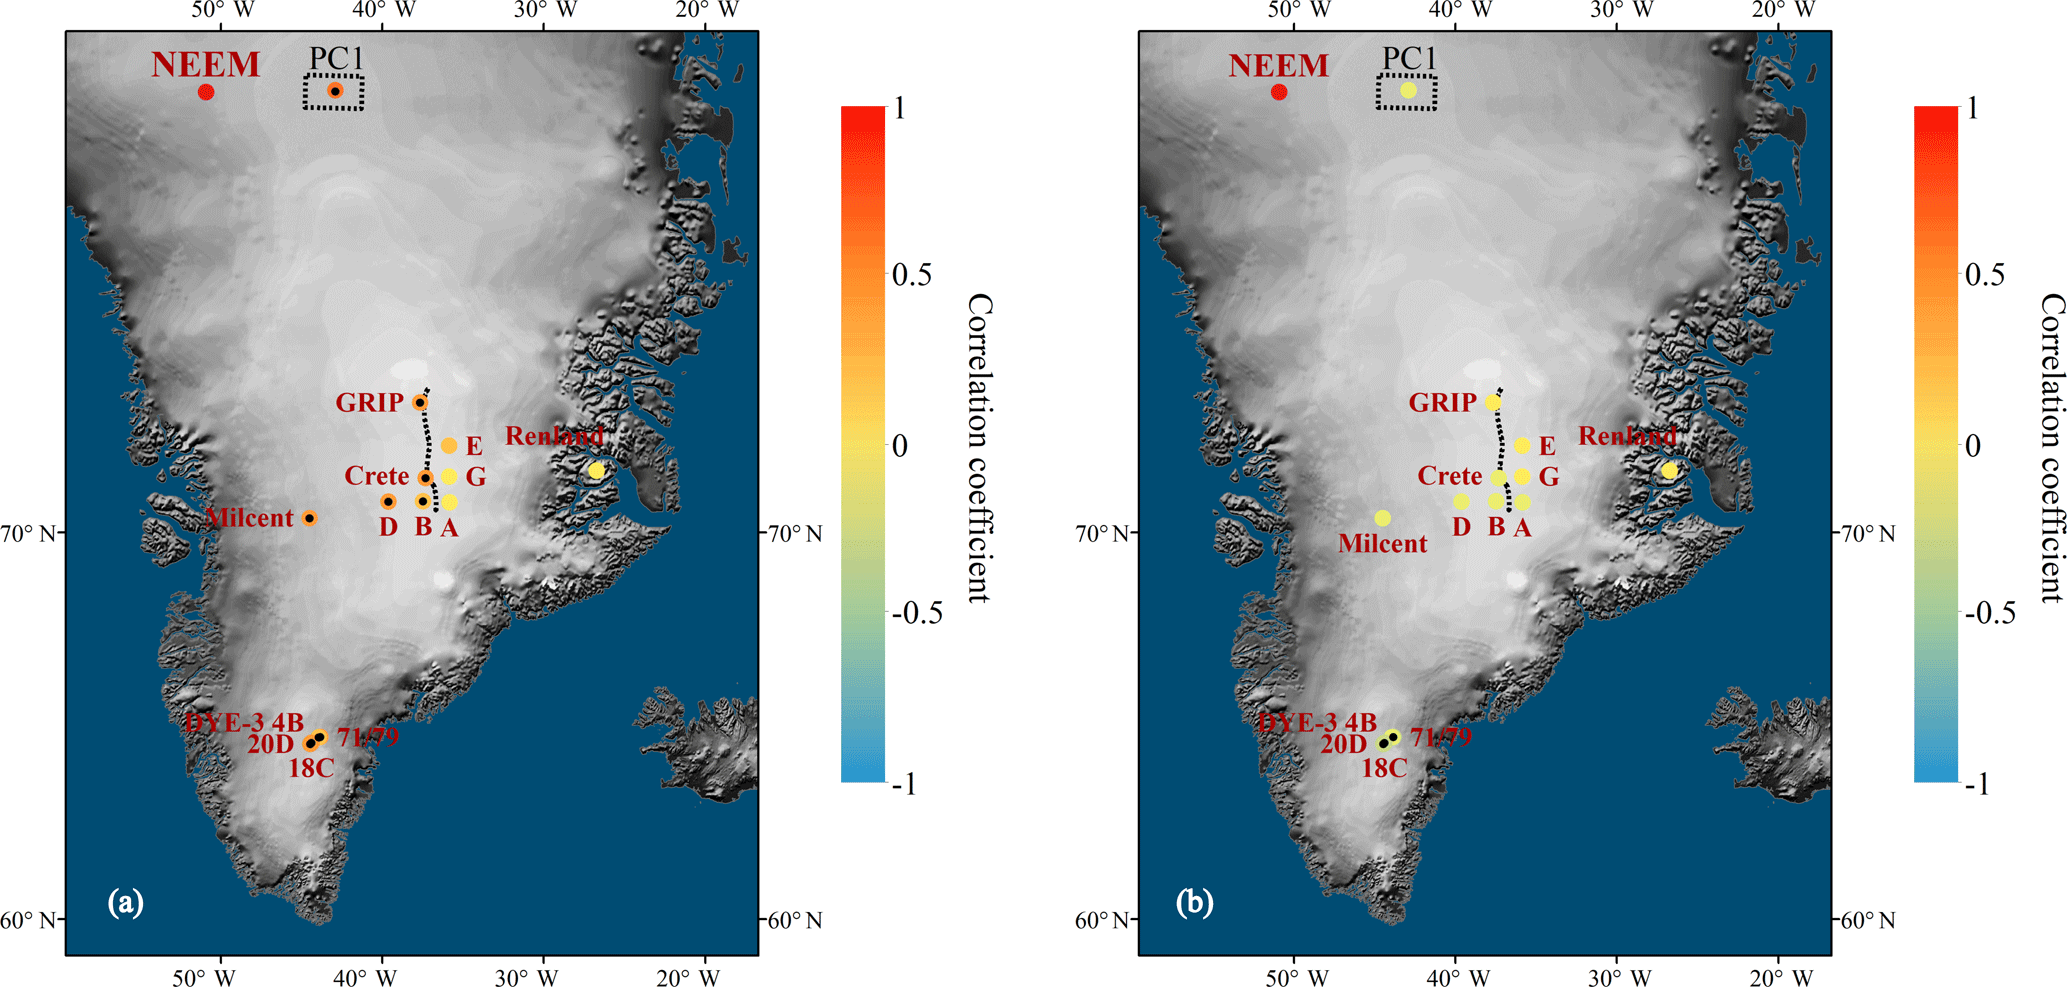
Figure 3Correlation coefficients between NEEM seasonal δ18O and Greenland seasonal δ18O records for the period 1855–1970 (a for summer and b for winter). The PC1 of seasonal central/southern Greenland δ18O records is shown within the black dashed rectangle. The ice divide is marked by dotted black line. The significant correlations at the 95 % confidence level are filled with a black dot (t test).
Figure 3 presents the correlation between seasonal stacked NEEM δ18O and other seasonal ice cores in Greenland, including the Greenland δ18O PC1. All data are detrended before correlation. The NEEM summer δ18O data are significantly correlated with the summer Greenland ice core isotope data from locations in southern Greenland and to the west of the central ice divide (Fig. 3a; with correlation from 0.3 to 0.46). However, summer δ18O from cores located to the east of the central ice divide (Renland, Site E, G and A) do not correlate significantly with the NEEM summer δ18O data. This is in accordance with the fact that moisture pathways are different for snow accumulation to the east and west of the central ice divide (Vinther et al., 2010). Therefore, having ice core records from both the east and west side of the ice divide facilitates the identification of regional-scale atmospheric variability. The correlation between NEEM summer δ18O and the Greenland summer PC1 record is significant both in inter-annual (r=0.54) and 11-year smoothed data (r=0.67, Fig. 4a and c). The correlations of 11-year averaged data are tested using the “random-phase” method introduced by Ebisuzaki (1997). The correlations are consistent with the correlation between annual NEEM δ18O and Greenland δ18O PC1 found by Masson-Delmotte et al. (2015). NEEM winter δ18O shows no significant correlation with most winter Greenland δ18O records and weak negative correlation with three southern ice core records (DYE3-71/79, 18C, 20D; Fig. 3b). No correlations are observed for the comparison with Greenland winter δ18O PC1 at an inter-annual and decadal scale (Fig. 4b and d). The results indicate a rather different winter climatic fingerprint archived in northwestern Greenland, suggesting one needs to be careful when interpreting the NEEM winter δ18O records. Such poor correlations between NEEM winter δ18O and winter Greenland δ18O PC1 are obscured in the annual correlation with Greenland δ18O PC1 due to the dominance of summer accumulation (Masson-Delmotte et al., 2015).
6.1 Association with the temperature and atmospheric circulation
Figure 5a and b show the spatial correlation maps between NEEM seasonal δ18O and surface air temperature (SAT) retrieved from the 20CR data set. All data are detrended before correlation. NEEM summer δ18O is significantly positively correlated with May–October averaged SAT over all of Greenland, Baffin Bay and the open water to the east of Greenland. This significant correlation also occurs as far south as 35∘ N in the North Atlantic, where a previous study suggests the possible moisture source for precipitation at NEEM (Steen-Larsen et al., 2011). For winter δ18O and November–April averaged SAT, no correlation is displayed over Greenland or nearby consistent with the results from observations. Winter δ18O correlates significantly with the SAT near 35∘ N in the North Atlantic and the Canadian Archipelago. But the correlation coefficients are only up to 0.25. Due to less reliable data in the early stage of 20CR data, we also examine the correlations within two sub-intervals 1855–1930 and 1931–2004 (Fig. S3). The strong extended correlations between NEEM summer δ18O and May–October averaged SAT are consistent within two sub-intervals. For winter correlations, both show no correlations over Greenland or nearby. The correlations with the SAT data from the reanalysis data support the conclusion that summer δ18O from NEEM has a better correlation with temperature than winter δ18O.
Table 1The correlations of seasonal NEEM δ18O records with seasonal averaged different atmospheric circulation indices. The bold text is significant at the 95 % confidence level, and the text marked with underline is significant at the 90 % confidence level (t test).
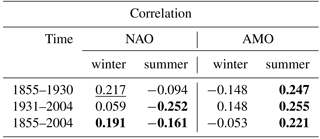
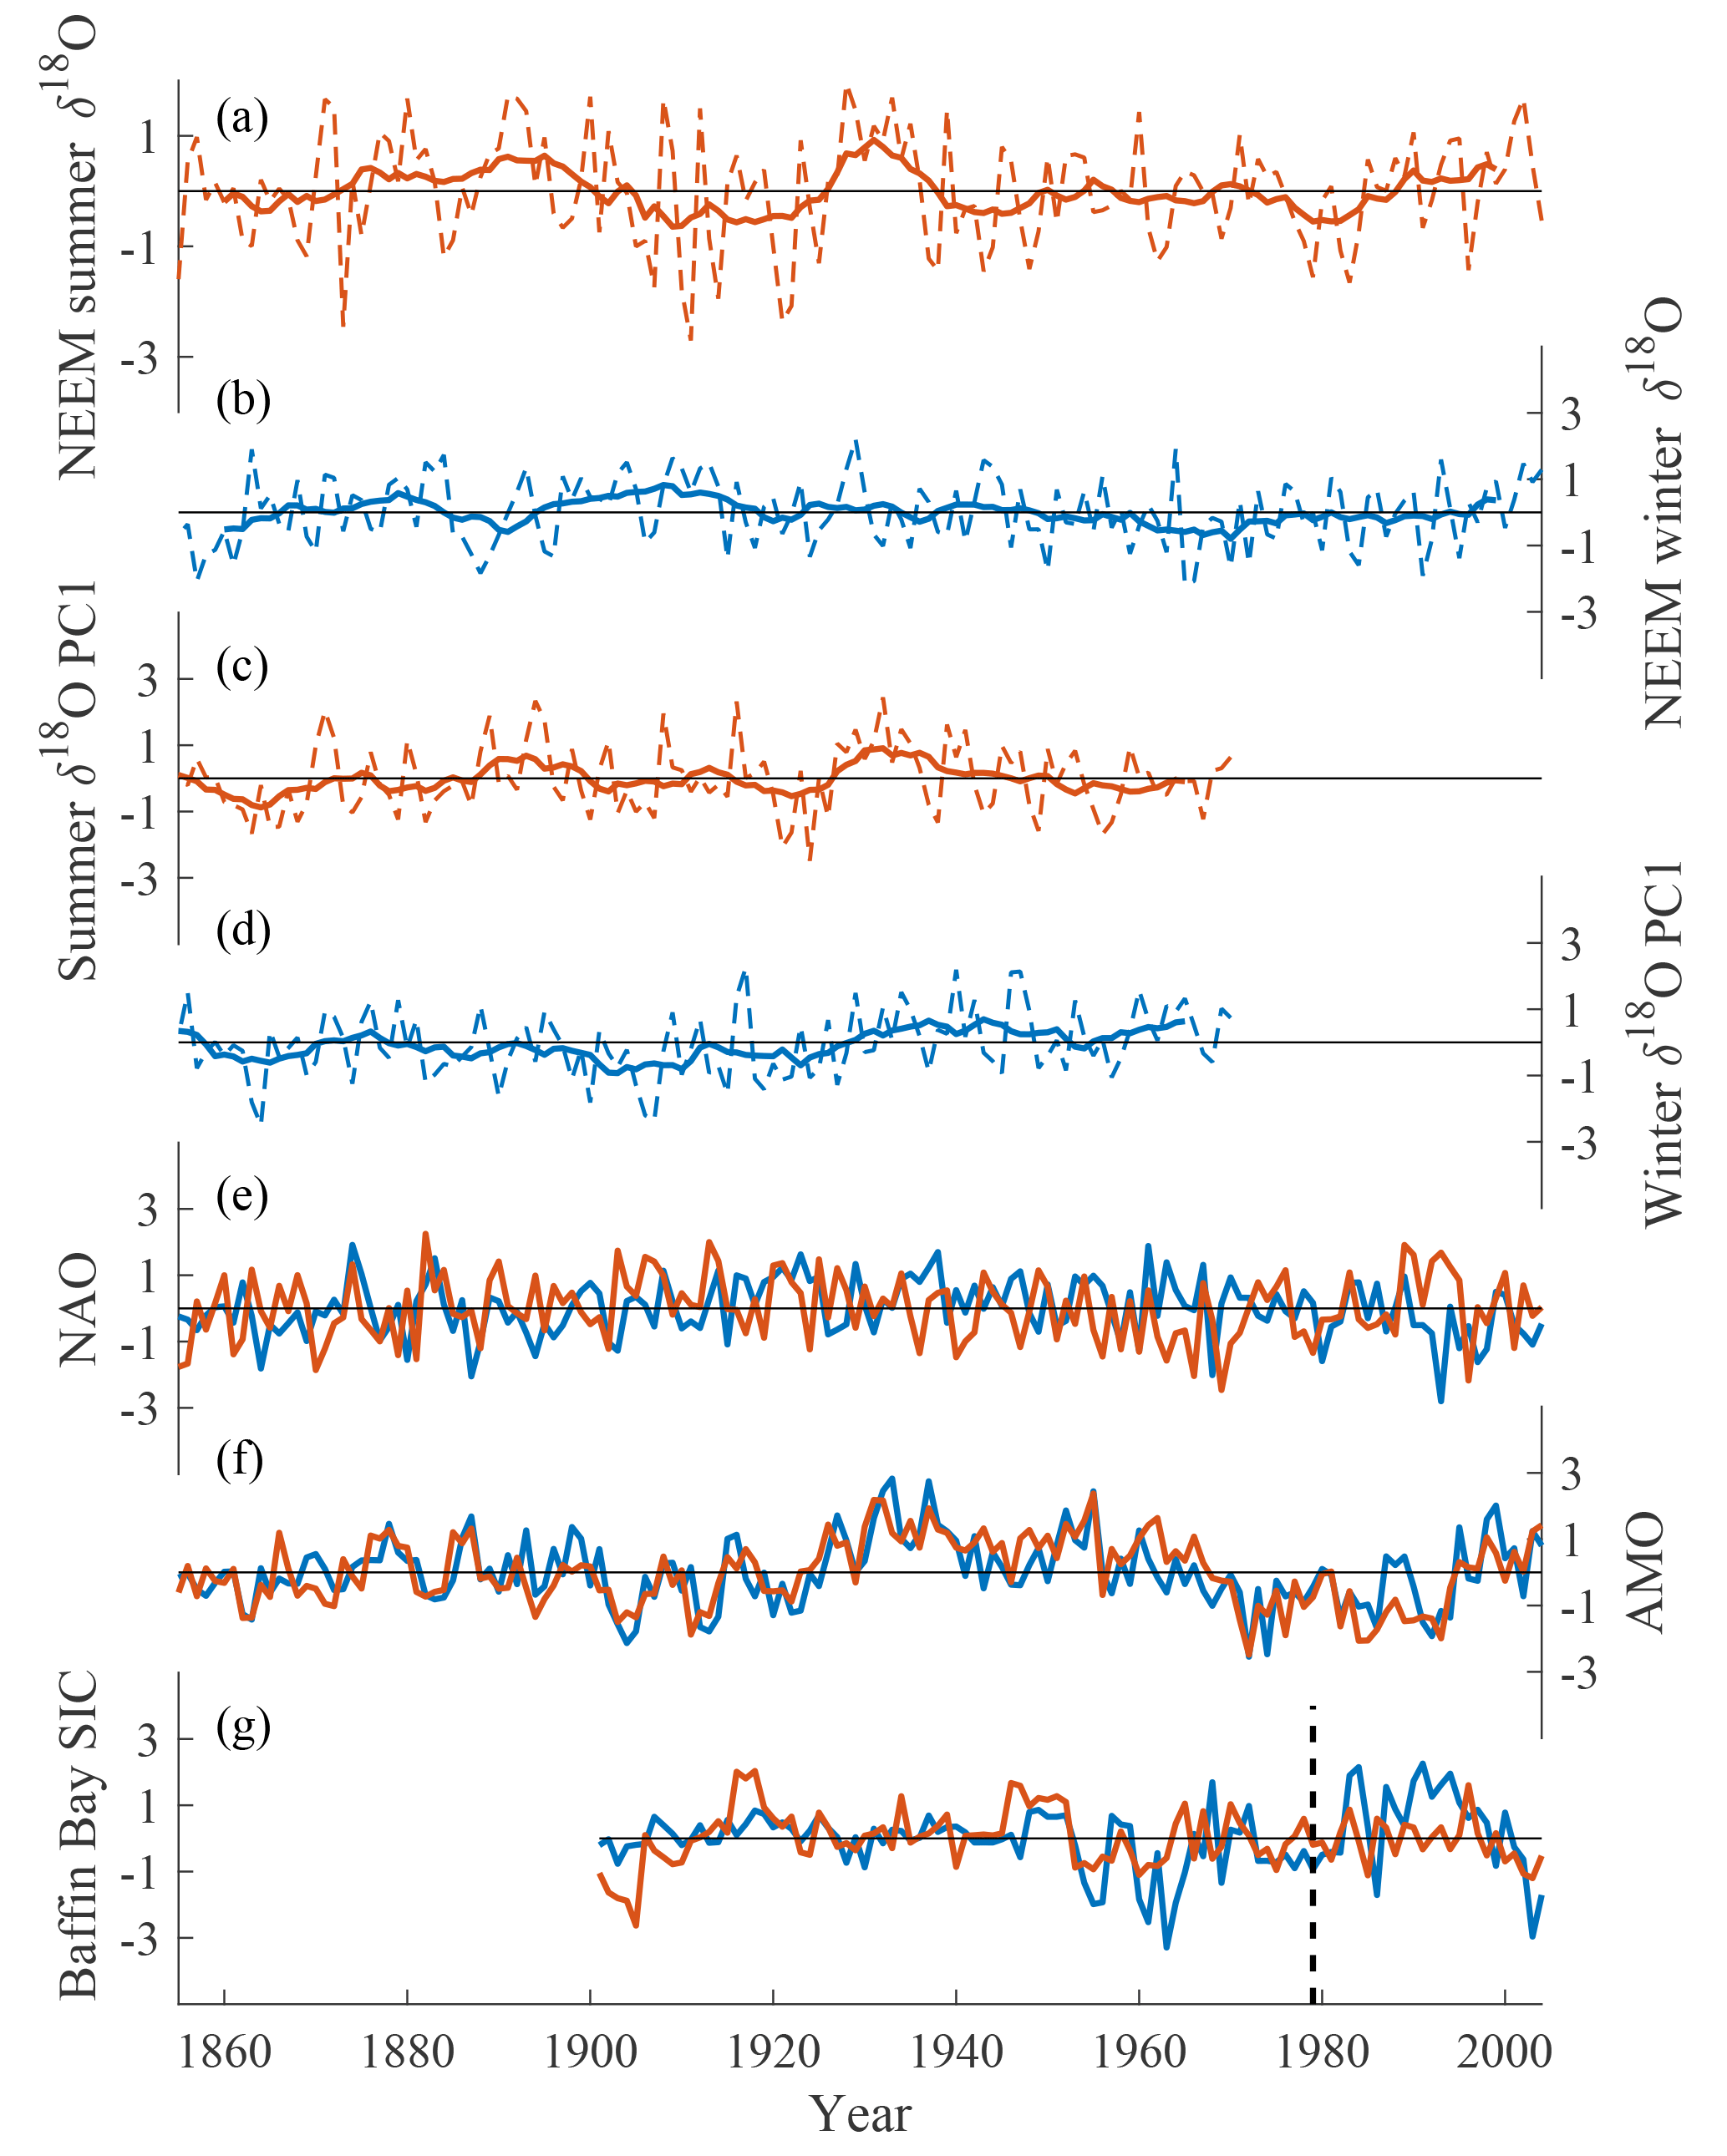
Figure 4(a, b) The NEEM seasonal δ18O identified in this study. The dashed line and bold line show annual and 11-year averaged data, respectively. (c, d) The Greenland seasonal δ18O PC1 extracted from ice cores in central/southern Greenland (Vinther et al., 2010). The dashed line and bold line show annual and 11-year averaged data. (e) The NAO indices calculated from 20CR reanalysis data using principal component analysis. (f) The AMO indices calculated from 20CR reanalysis data based on the method by Trenberth and Shea (2006). (g) The averaged SIC over Baffin Bay extracted from COBEsic (Hirahara et al., 2014). The dashed line indicates the start year of satellite observation (1979). All red lines show summer, and blue lines show winter. All data are normalized and detrended.
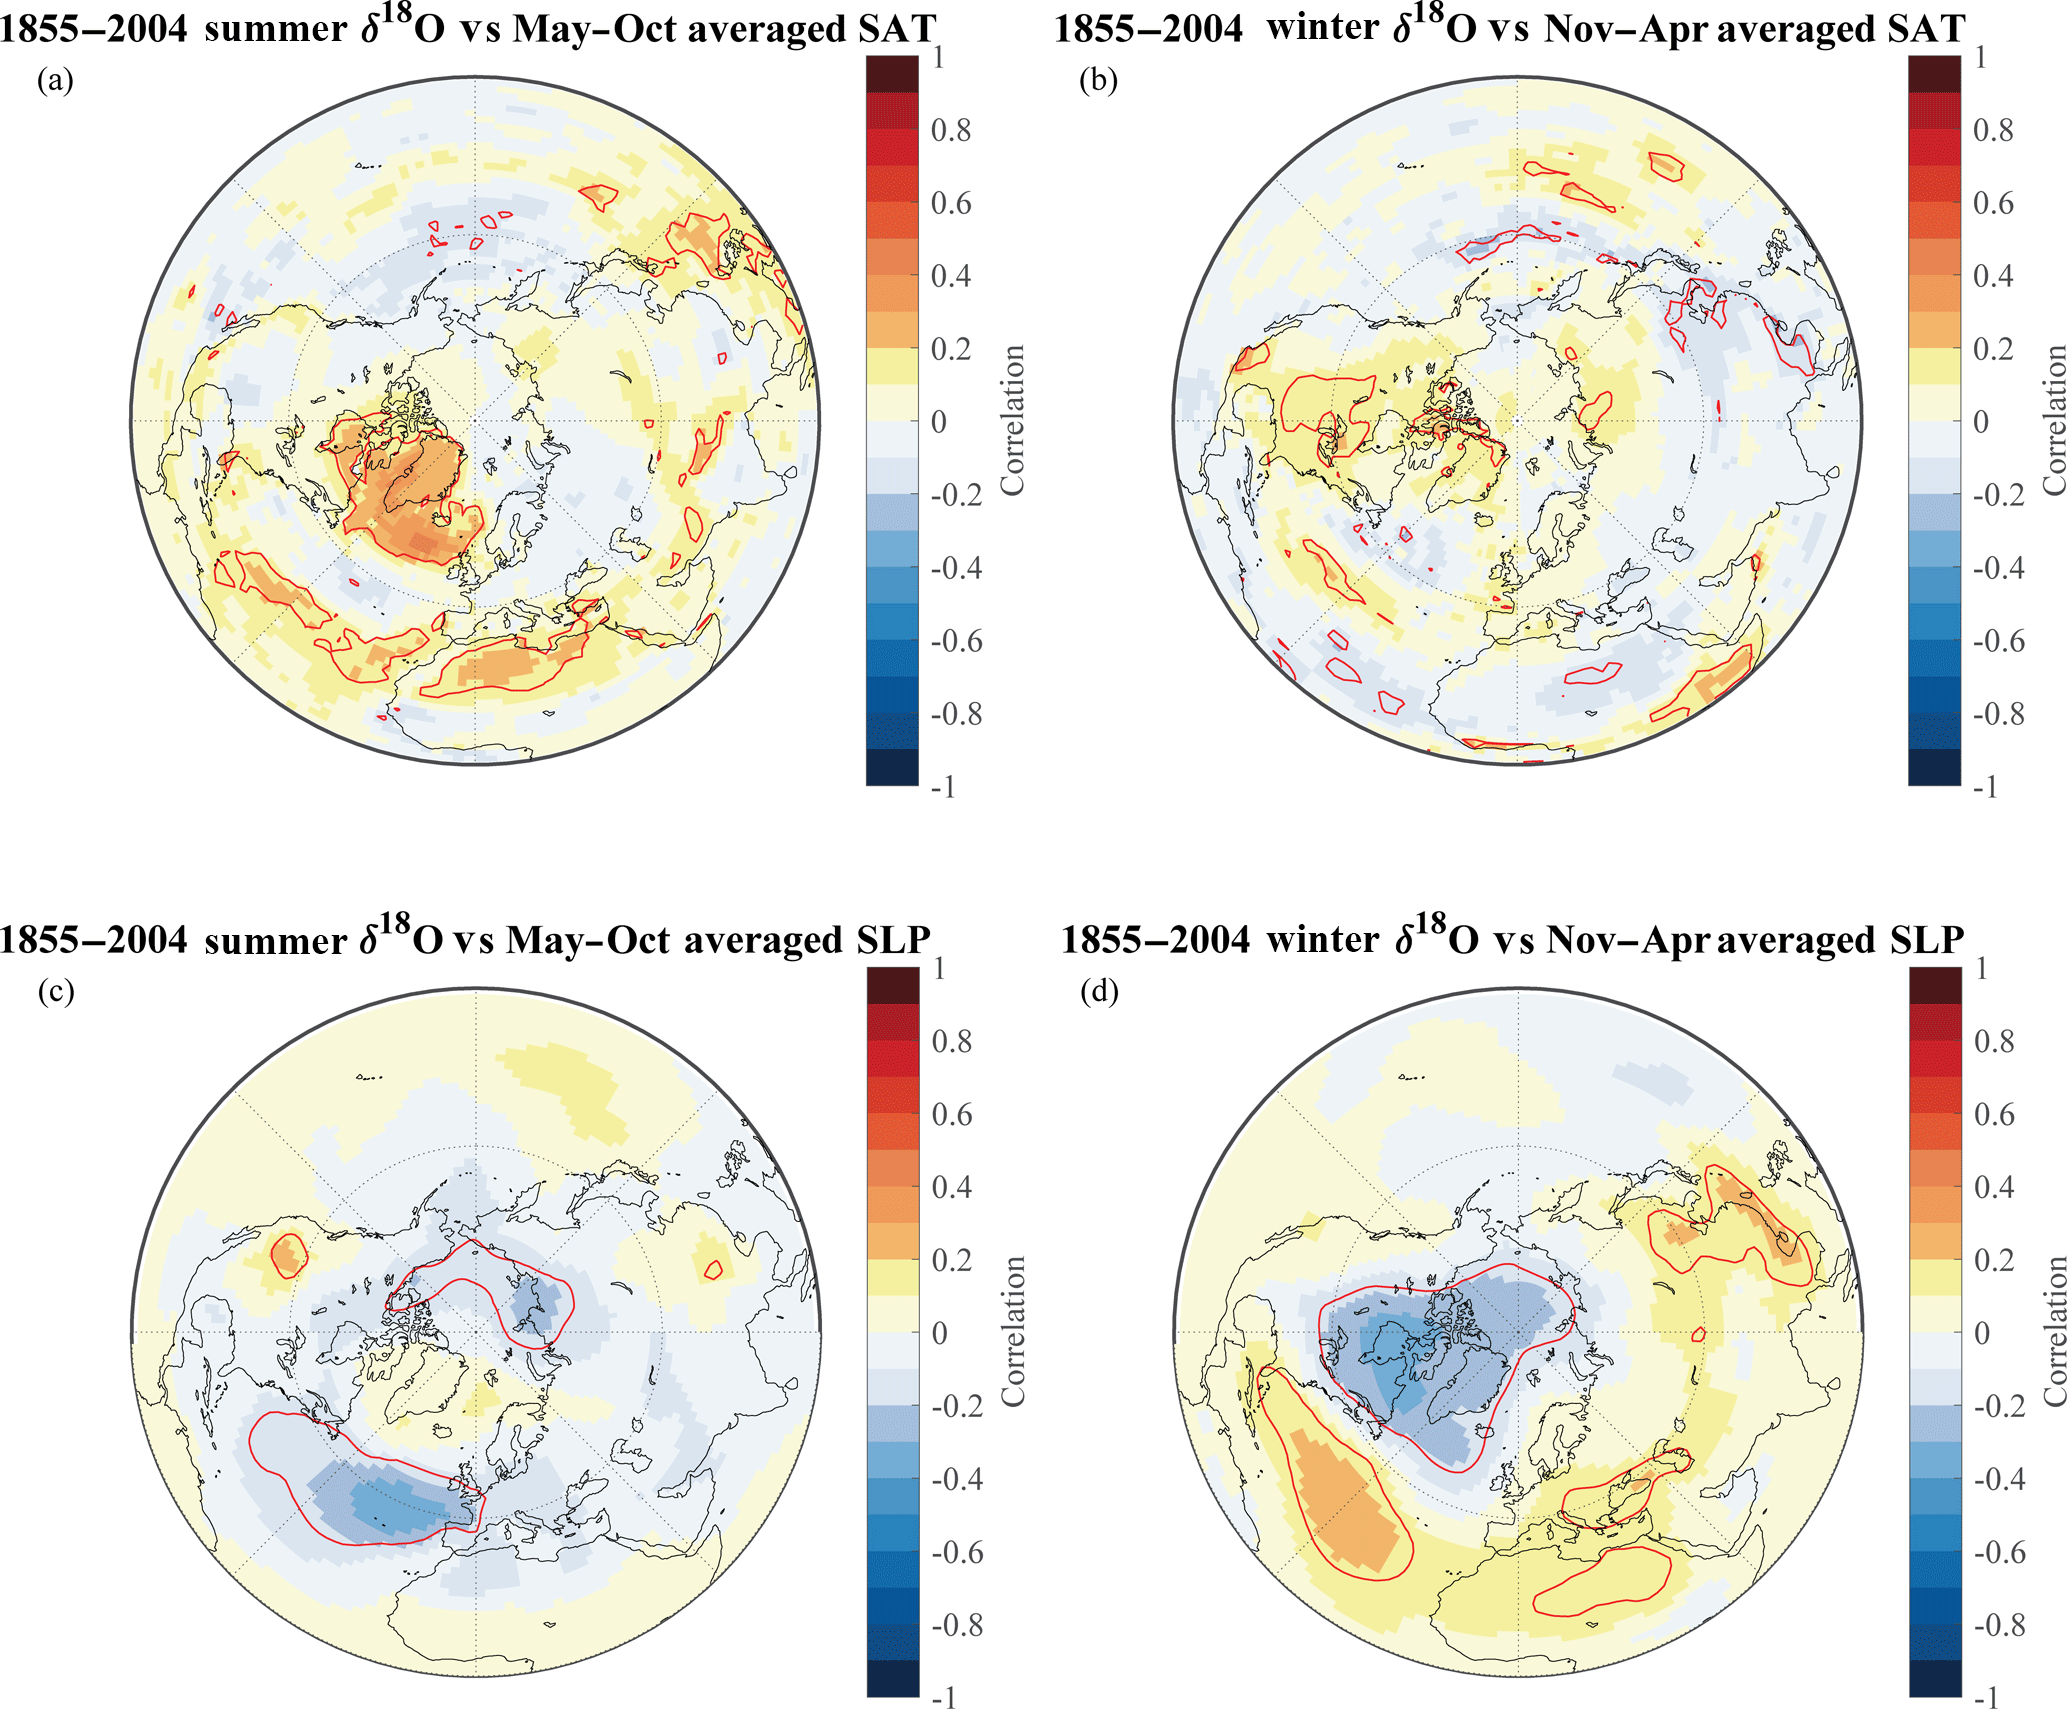
Figure 5The spatial correlation map between NEEM seasonal δ18O and SAT (a, b) and SLP (c, d) from 20CR reanalysis data for the period 1855–2004. The winter data are averaged for November–April and the summer data are averaged for May–October. The red solid lines indicate significant correlation at the 95 % confidence level (t test).
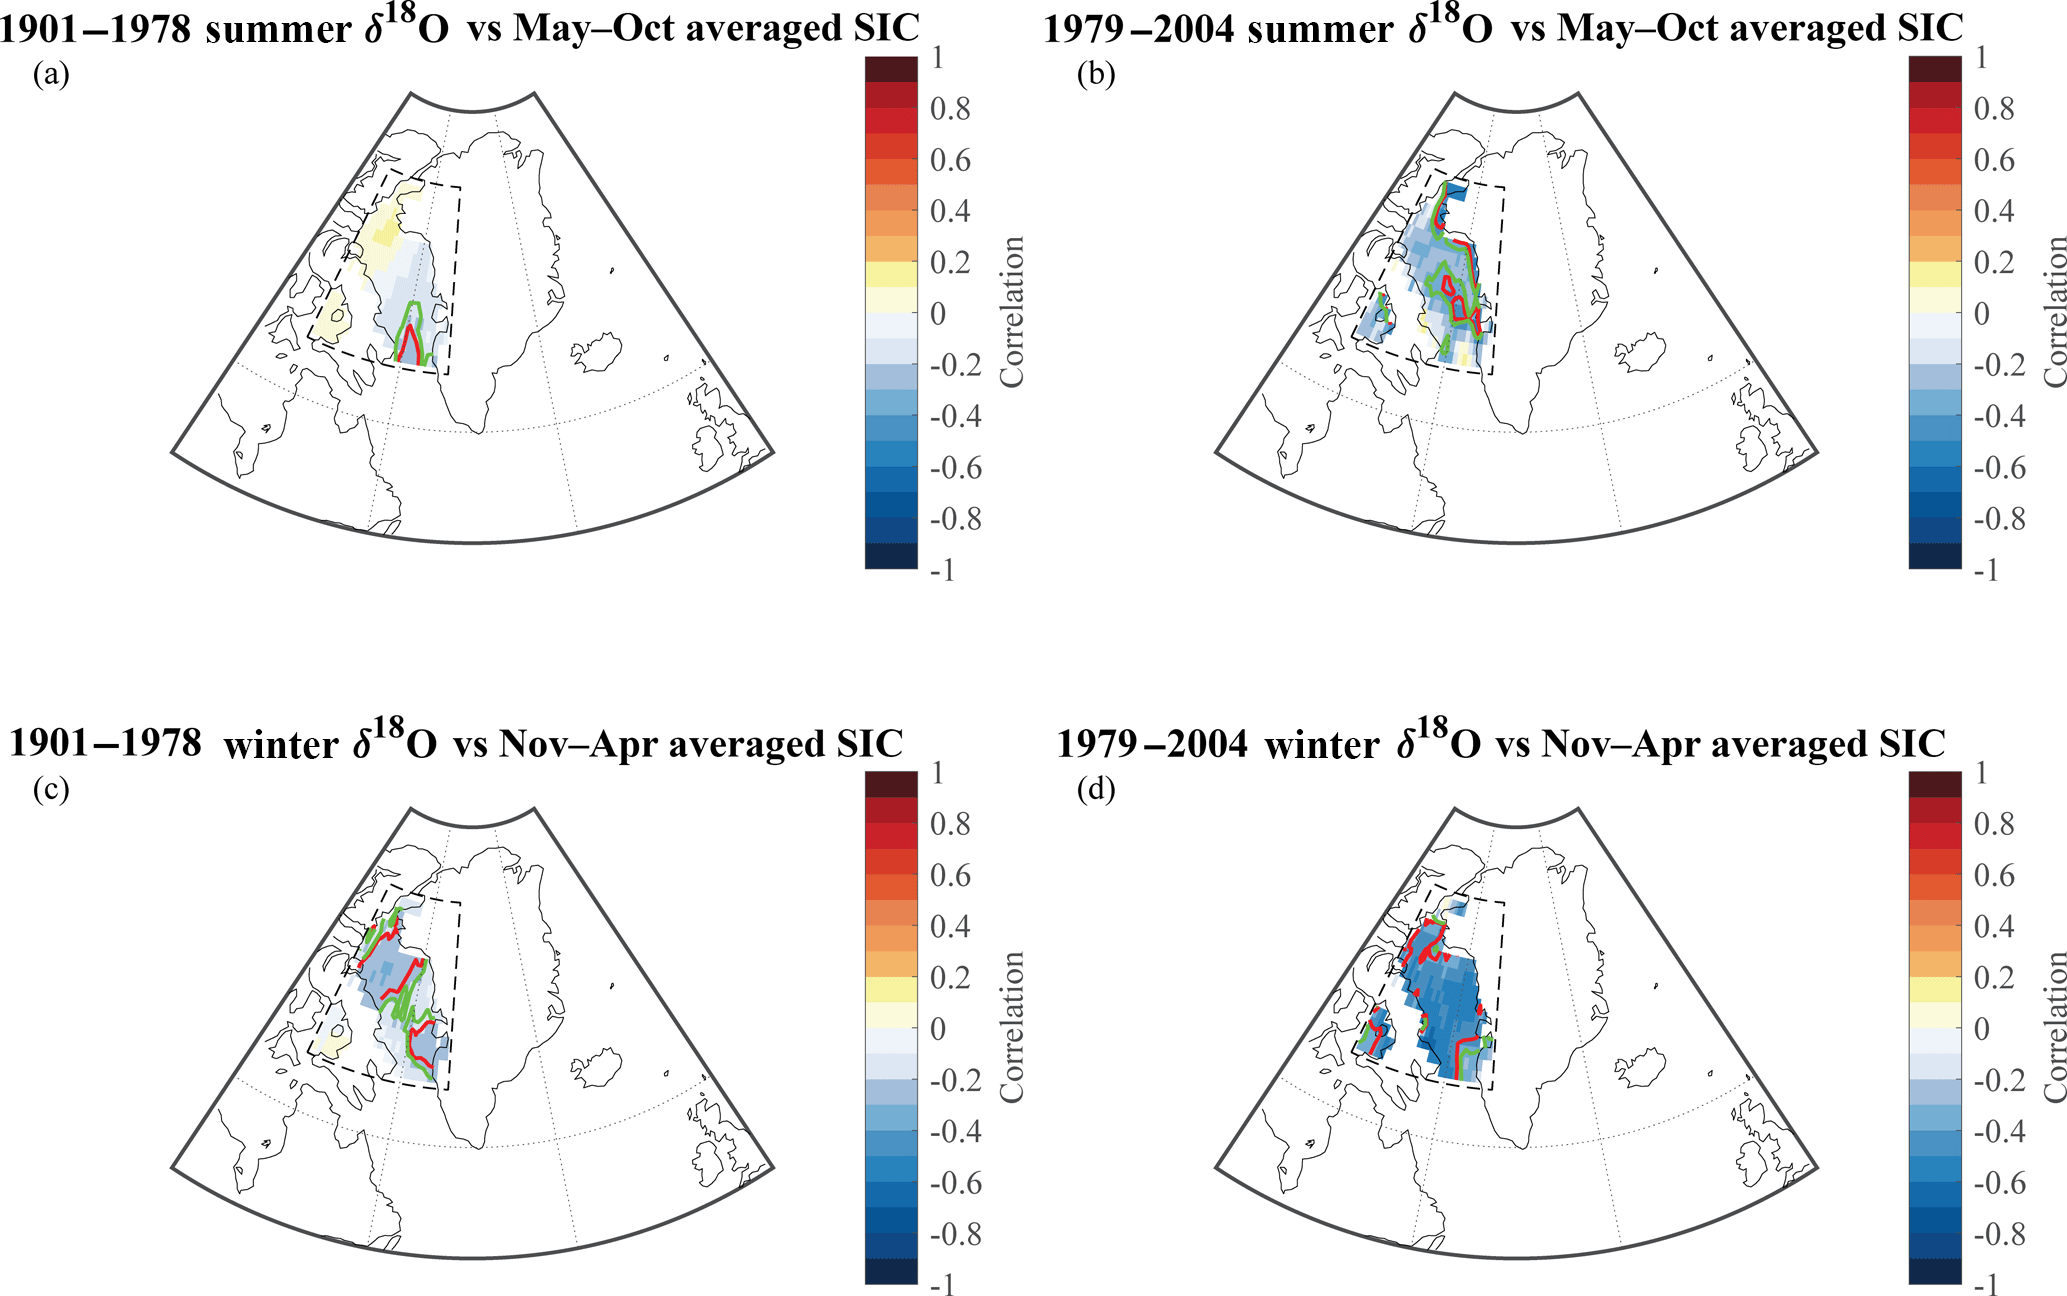
Figure 6The spatial correlation map between NEEM seasonal δ18O and SIC over Baffin Bay for the period prior to satellite observations (a, c) and the satellite observation period (b, d). The winter data are averaged for November–April, and the summer data are averaged for the May–October. The red solid lines indicate significant correlation at the 95 % confidence level, and the green solid lines indicate this at the 90 % confidence level (t test).
The NEEM seasonal δ18O is also compared with the sea level pressure (SLP) from 20CR data for the same time intervals as temperature (Fig. 5c, d and Fig. S4). There is no obvious NAO-like pattern (the seesaw structure over the North Atlantic Ocean) for the comparison between summer δ18O and May–October averaged SLP for the whole period. A NAO-like pattern emerges for the second sub-period (1931–2004) (Fig. S4b), but the northern node is limited suggesting a rather weak summer NAO footprint on δ18O at NEEM. There is a seesaw structure when correlating winter δ18O with November–April averaged SLP over the last 150 years (Fig. 5d) and within the sub-period 1855–1930 (Fig. S4c). However, the correlations with SLP are also rather weak for these periods. The absolute values of correlation coefficients are less than 0.33 both for 1855–1930 and for the whole period. Furthermore, it should be noted that there is an absence of the NAO-like pattern for the second 75-year period (Fig. S4d) when observations are generally more reliable due to the increased number of assembled observations around Greenland. Hence, care should be taken when interpreting inconsistent correlations in the sub-intervals. Another interesting feature in Fig. S4c and d is the consistent negative correlation between NEEM winter δ18O and November–April averaged SLP over North America and the Canadian Archipelago within the two sub-periods. This suggests that NEEM winter δ18O is more likely influenced by the pressure over North America and the Canadian Archipelago.
As the circulation indices are the simplified indicators of circulation patterns, we here further investigate the possible connections to AMO and NAO patterns with the seasonal NEEM data (Table 1). Both indices (Fig. 4e and f) and NEEM seasonal data are detrended before correlation. The summer δ18O signal correlates weakly with May–October averaged AMO (r=0.22) over 1855–2004. The correlations are also consistent within the two sub-intervals. There is no correlation between winter δ18O and November–April averaged AMO. Summer δ18O correlates weakly with May–October averaged NAO over the whole period and for 1931–2004, but no correlation is seen in the 1855–1930 period. It should be noted that for the whole period the summer correlation with NAO is significant, but no NAO-like pattern is seen in correlation with SLP for 1855–2004 (Fig. 5c). This may be attributed to the rather weak correlation with NAO which is only −0.16. NEEM winter δ18O has no correlation with the November–April averaged NAO in 1931–2004. Although the correlation map with SLP shows a NAO-like pattern for the 1855–1930 and the 1855–2004 period, the correlation coefficients with November–April averaged NAO indices are also rather weak (r=0.217 for 1855–1930 and r=0.191 for 1855–2004). Furthermore, it should be noted that even if there are correlations between seasonal NEEM δ18O and AMO and NAO, those circulation patterns can only explain less than 7 % of the variance of NEEM δ18O. We conclude that both patterns exert a weak influence on NEEM δ18O even though we calculate the correlation between seasonal circulation indices and seasonal NEEM δ18O. The weak correlations with NEEM δ18O are likely due to a larger distance from the Atlantic Ocean and a much lower snow accumulation at NEEM than in other ice cores in central and southern Greenland (Chylek et al., 2012; Steen-Larsen et al., 2011). The weak correlations can also explain why NEEM annual δ18O is highly correlated with annual Greenland δ18O PC1 but surprisingly weakly correlated with annual and winter NAO (Masson-Delmotte et al., 2015), which leave a strong footprint in most ice cores in central and southern Greenland (Vinther et al., 2003, 2010). The seasonal precipitation bias at NEEM, which is dominated by summer precipitation, skews the NEEM annual average δ18O towards summer. Therefore, the NEEM annual δ18O presents a summer-biased signal which has strong correlation with Greenland δ18O PC1. Furthermore, irrespective of the weaker winter signal in the annual δ18O, we also find that the isolated NEEM winter δ18O correlates poorly with winter NAO. This weak correlation between winter NEEM δ18O and winter NAO is in contrast with the finding of a strong winter NAO footprint in the winter δ18O records in central/southern Greenland. This is important to know when considering NEEM δ18O for use in circulation reconstructions using emerging reanalysis techniques (e.g., Hakim et al., 2016), where a strong seasonality can both be a caveat but also be exploited for climate reconstructions.
6.2 Comparison with sea ice concentration
In this section, NEEM seasonal δ18O is compared with the SIC record in Baffin Bay for 1901–2004 (Fig. 6). The period is further divided into the period prior to satellite observations (1901–1978) and the satellite observation period (1979–2004) for comparison. The year 1979 is the onset year of the satellite observations, which are regarded as the more reliable data source. Prior to the satellite period, the data are mainly calculated by the compilation of historical data (Walsh and Chapman, 2001). SIC data are linearly detrended before correlations (Fig. 4g). The NEEM winter δ18O correlates significantly with November–April averaged SIC extent over Baffin Bay in 1979–2004 with correlation coefficients of up to −0.62 (Fig. 6d). The correlation coefficient between NEEM winter δ18O and averaged SIC over the whole of Baffin Bay is −0.53. Prior to the satellite period, the correlation between NEEM winter δ18O and averaged SIC over Baffin Bay is also significant (). Summer δ18O correlates well with May–October averaged SIC in 1979–2004 with correlation coefficients of up to −0.59 along the Greenland western coastal area (Fig. 6b). The correlation between NEEM summer δ18O and averaged SIC over Baffin Bay is also significant (). However, in contrast with the good correlation in the late 20th century, there are limited significant correlations over the southern part of Baffin Bay for summer in the 1901–1978 period. There is no correlation between NEEM summer δ18O and averaged SIC over Baffin Bay () for this period. One possible explanation for the weaker correlations both for winter and summer in 1901–1978 may be due to less reliable historical data sources. Furthermore, the reconstructed summer SIC can be underestimated sometimes due to the lower concentration along the coastlines (Titchner and Rayner, 2014). The correlations with SIC in 1901–1978 are expected to be re-examined in the future, possibly leading to an improved sea ice extent data set (Titchner and Rayner, 2014). However, both winter and summer δ18O are still strongly negatively correlated with Baffin Bay ice extent for 1979–2004, sharing more than 22 % variance, which is in agreement with the relationship between the annual Baffin Bay sea ice anomaly and NEEM annual δ18O data as illustrated in Steen-Larsen et al. (2011).
A possible explanation for the sea ice effect on δ18O is that a reduced sea ice cover may amplify regional temperature changes and favor enhanced storminess and enhanced precipitation (Noël et al., 2014; Sime et al., 2013), thus bringing more local moisture. By contrast with the long-distance transport of moisture from the North Atlantic, the local source leads to less depleted δ18O in the clouds and thereby increases NEEM δ18O. However, this mechanism cannot explain the good correlation with winter δ18O as NEEM winter δ18O is poorly correlated with SAT over Baffin Bay (Fig. 5b). One hypothesis of this significant winter correlation with SIC is based on the wind over Baffin Bay. Changes in the wind strength/direction over Baffin Bay may modulate the moisture transport from Baffin Bay to the NEEM site. However, we find no correlations between NEEM winter δ18O and November–April averaged wind speed/direction at 850 and 200 mb altitude (jet stream) over 1901–1978 and 1979–2004 (not shown), which may exclude this hypothesis. Another possible hypothesis could be that, instead of the direct coupling of precipitation to local moisture sources at NEEM resulting in the high winter correlation, it is merely a climatic connection between sea ice extent and the clouds' temperature, thereby influencing the isotopic composition of the precipitation at NEEM (Steen-Larsen et al., 2011). Future work can focus on investigating the possible driving factors for this strong winter correlation, which is also consistently significant for the early 20th century. The strong correlations with SIC indicate the possible strong influence of sea ice changes on the variability in stable isotope ratios in northern Greenland. It was found that high δ18O values during the last inter-glacial period (the Eemian period) could not be achieved in interglacial simulations driven by orbital forcing alone (Sime et al., 2013). Sime et al. (2013) suggest that sea ice reduction may be the most likely cause of high interglacial δ18O in Greenland ice cores. This explanation is supported by our study showing that changes in sea surface temperatures (SSTs) and sea ice cover are indeed key to understanding the past changes in Greenland water isotopes.
The climate signals archived in stable isotopes in ice cores are complex and can be difficult to disentangle with annual isotope data only, especially for the NEEM ice core with uneven seasonal accumulation. Combining four NEEM shallow ice cores, we extracted the seasonal δ18O signals at NEEM over the 1855–2004 period, identifying 30 and 70 % of the annual accumulation as being representative of winter and summer precipitation, respectively. The quantifications of the signal-to-noise ratios indicate that a robust seasonal signal can be extracted from four parallel ice cores at NEEM.
NEEM summer δ18O is closely associated with Greenland temperatures. Correlation analysis with 20CR temperature data indicates strong correlations over the whole of Greenland, Baffin Bay, and areas as far south as 35∘ N. NEEM winter δ18O shows no correlation with Greenland temperatures. The NEEM summer δ18O record rather than NEEM winter δ18O or NEEM annual average δ18O has been shown to be the better temperature proxy in northwestern Greenland. The NEEM summer δ18O variability is coherent with the Greenland summer δ18O PC1 (sharing up to 30 % variance) while the winter signal is not, which indicates a seasonal shift in the impact of circulation and large differences in the regional climate signal in Greenland. The good summer correlations with temperature and Greenland δ18O PC1 agree well with annual correlations, which are, however, dominated by the large fraction of summer accumulation. While strong correlations are not observed in the winter signal, we conclude that the annual δ18O signal is dominated by the summer signal at NEEM, where summer precipitation is dominant. At such seasonally precipitation-biased sites, it is highly desirable to identify the seasonal δ18O signal even though multiple cores are usually required to minimize the noise.
Despite the dominant signals of both NAO and AMO in the southern–central ice core isotope data, we find that both these circulation patterns exert only a weak influence on seasonal δ18O variations at NEEM. This has to be kept in mind when combing NEEM δ18O records with other proxy data in circulation reconstructions.
Furthermore, we identify a connection between SIC in Baffin Bay and NEEM summer and winter δ18O in the satellite SIC data. NEEM winter δ18O shows consistent significant correlations with SIC prior to and during the satellite observation period. This indicates that the NEEM winter δ18O, rather than representing temperature itself, reflects sea ice variations and, therefore, the distance to the moisture source region. This also opens up for the possibility of estimating the winter Baffin Bay sea ice extent prior to the onset of satellite observations in 1979 using NEEM winter δ18O.
Making the NEEM seasonal water isotope data public has to be in accordance with the NEEM isotope consortia. We cannot publish the data before this has been cleared with the consortia. The NEEM seasonal data connected to this study will be available online once this is allowed by the consortia. In the meantime, data are available upon request from the author.
The supplement related to this article is available online at: https://doi.org/10.5194/cp-14-1067-2018-supplement.
MJZ performed the analysis in correspondence with JS, RM and FA and wrote the initial version of the manuscript. RM and JS initiated the study. BMV, HCSL and TJP provided the NEEM data. All authors discussed and edited the manuscript.
The authors declare that they have no conflict of interest.
This work is supported by a scholarship from the China Scholarship Council
(CSC) under grant CSC no. 201606710087. Florian Adolphi was supported by the
Swedish Research Council (grant number VR 4.1-2016-00218). Raimund Muscheler
was also supported by the Swedish Research Council (grant number
DNR2013-8421).
Edited by: Amaelle
Landais
Reviewed by: two anonymous referees
Barlow, L. K., White, J. W. C., Barry, R. G., Rogers, J. C., and Grootes, P. M.: The North Atlantic Oscillation signature in deuterium and deuterium excess signals in the Greenland Ice Sheet Project 2 Ice Core, 1840–1970, Geophys. Res. Lett., 20, 2901–2904, https://doi.org/10.1029/93gl03305, 1993.
Cappelen, J.: Greenland-DMI historical climate data collection 1784–2016, Technical Report, 17–04, 2017.
Chylek, P., Folland, C., Frankcombe, L., Dijkstra, H., Lesins, G., and Dubey, M.: Greenland ice core evidence for spatial and temporal variability of the Atlantic Multidecadal Oscillation, Geophys. Res. Lett., 39, L09705, https://doi.org/10.1029/2012gl051241, 2012.
Compo, G. P., Whitaker, J. S., Sardeshmukh, P. D., Matsui, N., Allan, R. J., Yin, X., Gleason, B. E., Vose, R. S., Rutledge, G., Bessemoulin, P., Brönnimann, S., Brunet, M., Crouthamel, R. I., Grant, A. N., Groisman, P. Y., Jones, P. D., Kruk, M. C., Kruger, A. C., Marshall, G. J., Maugeri, M., Mok, H. Y., Nordli, Ø., Ross, T. F., Trigo, R. M., Wang, X. L., Woodruff, S. D., and Worley, S. J.: The Twentieth Century Reanalysis Project, Q. J. Roy. Meteor. Soc., 137, 1–28, https://doi.org/10.1002/qj.776, 2011.
Ebisuzaki, W.: A Method to Estimate the Statistical Significance of a Correlation When the Data Are Serially Correlated, J. Climate, 10, 2147–2153, https://doi.org/10.1175/1520-0442(1997)010<2147:Amtets>2.0.Co;2, 1997.
Gfeller, G., Fischer, H., Bigler, M., Schüpbach, S., Leuenberger, D., and Mini, O.: Representativeness and seasonality of major ion records derived from NEEM firn cores, The Cryosphere, 8, 1855–1870, https://doi.org/10.5194/tc-8-1855-2014, 2014.
Hakim, G. J., Emile-Geay, J., Steig, E. J., Noone, D., Anderson, D. M., Tardif, R., Steiger, N., and Perkins, W. A.: The last millennium climate reanalysis project: Framework and first results, J. Geophys. Res.-Atmos., 121, 6745–6764, https://doi.org/10.1002/2016jd024751, 2016.
Hanna, E., Mernild, S. H., Cappelen, J., and Steffen, K.: Recent warming in Greenland in a long-term instrumental (1881–2012) climatic context: I. Evaluation of surface air temperature records, Environ. Res. Lett., 7, 045404, https://doi.org/10.1088/1748-9326/7/4/045404, 2012.
Hirahara, S., Ishii, M., and Fukuda, Y.: Centennial-Scale Sea Surface Temperature Analysis and Its Uncertainty, J. Climate, 27, 57–75, https://doi.org/10.1175/jcli-d-12-00837.1, 2014.
Hurrell, J. W. and Deser, C.: North Atlantic climate variability: The role of the North Atlantic Oscillation, J. Marine Syst., 78, 28–41, https://doi.org/10.1016/j.jmarsys.2008.11.026, 2009.
Johnsen, S. J., Clausen, H. B., Cuffey, K. M., Hoffmann, G., Schwander, J., and Creyts, T.: Diffusion of stable isotopes in polar firn and ice: the isotope effect in firn diffusion, in: Physics of ice core records, Hokkaido University, Sapporo, 121–140, 2000.
Küttel, M., Steig, E. J., Ding, Q., Monaghan, A. J., and Battisti, D. S.: Seasonal climate information preserved in West Antarctic ice core water isotopes: relationships to temperature, large-scale circulation, and sea ice, Clim. Dynam., 39, 1841–1857, https://doi.org/10.1007/s00382-012-1460-7, 2012.
Masson-Delmotte, V., Kageyama, M., Braconnot, P., Charbit, S., Krinner, G., Ritz, C., Guilyardi, E., Jouzel, J., Abe-Ouchi, A., Crucifix, M., Gladstone, R. M., Hewitt, C. D., Kitoh, A., LeGrande, A. N., Marti, O., Merkel, U., Motoi, T., Ohgaito, R., Otto-Bliesner, B., Peltier, W. R., Ross, I., Valdes, P. J., Vettoretti, G., Weber, S. L., Wolk, F., and Yu, Y.: Past and future polar amplification of climate change: climate model intercomparisons and ice-core constraints, Clim. Dynam., 26, 513–529, https://doi.org/10.1007/s00382-005-0081-9, 2005a.
Masson-Delmotte, V., Landais, A., Stievenard, M., Cattani, O., Falourd, S., Jouzel, J., Johnsen, S. J., Jensen, D. D., Sveinsbjornsdottir, A., White, J. W. C., Popp, T., and Fischer, H.: Holocene climatic changes in Greenland: Different deuterium excess signals at Greenland Ice Core Project (GRIP) and NorthGRIP, J. Geophys. Res.-Atmos., 110, D14102, https://doi.org/10.1029/2004jd005575, 2005b.
Masson-Delmotte, V., Steen-Larsen, H. C., Ortega, P., Swingedouw, D., Popp, T., Vinther, B. M., Oerter, H., Sveinbjornsdottir, A. E., Gudlaugsdottir, H., Box, J. E., Falourd, S., Fettweis, X., Gallée, H., Garnier, E., Gkinis, V., Jouzel, J., Landais, A., Minster, B., Paradis, N., Orsi, A., Risi, C., Werner, M., and White, J. W. C.: Recent changes in north-west Greenland climate documented by NEEM shallow ice core data and simulations, and implications for past-temperature reconstructions, The Cryosphere, 9, 1481–1504, https://doi.org/10.5194/tc-9-1481-2015, 2015.
Neem community members: Eemian interglacial reconstructed from a Greenland folded ice core, Nature, 493, 489–494, https://doi.org/10.1038/nature11789, 2013.
Noël, B., Fettweis, X., van de Berg, W. J., van den Broeke, M. R., and Erpicum, M.: Sensitivity of Greenland Ice Sheet surface mass balance to perturbations in sea surface temperature and sea ice cover: a study with the regional climate model MAR, The Cryosphere, 8, 1871–1883, https://doi.org/10.5194/tc-8-1871-2014, 2014.
Noone, D. and Simmonds, I.: Sea ice control of water isotope transport to Antarctica and implications for ice core interpretation, J. Geophys. Res.-Atmos., 109, D07105, https://doi.org/10.1029/2003jd004228, 2004.
Ortega, P., Swingedouw, D., Masson-Delmotte, V., Risi, C., Vinther, B., Yiou, P., Vautard, R., and Yoshimura, K.: Characterizing atmospheric circulation signals in Greenland ice cores: insights from a weather regime approach, Clim. Dynam., 43, 2585–2605, https://doi.org/10.1007/s00382-014-2074-z, 2014.
Sime, L. C., Risi, C., Tindall, J. C., Sjolte, J., Wolff, E. W., Masson-Delmotte, V., and Capron, E.: Warm climate isotopic simulations: what do we learn about interglacial signals in Greenland ice cores?, Quaternary Sci. Rev., 67, 59–80, https://doi.org/10.1016/j.quascirev.2013.01.009, 2013.
Steen-Larsen, H. C., Masson-Delmotte, V., Sjolte, J., Johnsen, S. J., Vinther, B. M., Breon, F. M., Clausen, H. B., Dahl-Jensen, D., Falourd, S., Fettweis, X., Gallee, H., Jouzel, J., Kageyama, M., Lerche, H., Minster, B., Picard, G., Punge, H. J., Risi, C., Salas, D., Schwander, J., Steffen, K., Sveinbjornsdottir, A. E., Svensson, A., and White, J.: Understanding the climatic signal in the water stable isotope records from the NEEM shallow firn/ice cores in northwest Greenland, J. Geophys. Res., 116, D06108, https://doi.org/10.1029/2010jd014311, 2011.
Steen-Larsen, H. C., Masson-Delmotte, V., Hirabayashi, M., Winkler, R., Satow, K., Prié, F., Bayou, N., Brun, E., Cuffey, K. M., Dahl-Jensen, D., Dumont, M., Guillevic, M., Kipfstuhl, S., Landais, A., Popp, T., Risi, C., Steffen, K., Stenni, B., and Sveinbjörnsdottír, A. E.: What controls the isotopic composition of Greenland surface snow?, Clim. Past, 10, 377–392, https://doi.org/10.5194/cp-10-377-2014, 2014.
Tang, C. C. L., Ross, C. K., Yao, T., Petrie, B., DeTracey, B. M., and Dunlap, E.: The circulation, water masses and sea-ice of Baffin Bay, Prog. Oceanogr., 63, 183–228, https://doi.org/10.1016/j.pocean.2004.09.005, 2004.
Titchner, H. A. and Rayner, N. A.: The Met Office Hadley Centre sea ice and sea surface temperature data set, version 2: 1. Sea ice concentrations, J. Geophys. Res.-Atmos., 119, 2864–2889, https://doi.org/10.1002/2013jd020316, 2014.
Trenberth, K. E. and Shea, D. J.: Atlantic hurricanes and natural variability in 2005, Geophys. Res. Lett., 33, L12704, https://doi.org/10.1029/2006gl026894, 2006.
Vinther, B. M., Johnsen, S. J., Andersen, K. K., Clausen, H. B., and Hansen, A. W.: NAO signal recorded in the stable isotopes of Greenland ice cores, Geophys. Res. Lett., 30, 1387, https://doi.org/10.1029/2002gl016193, 2003.
Vinther, B. M., Andersen, K. K., Jones, P. D., Briffa, K. R., and Cappelen, J.: Extending Greenland temperature records into the late eighteenth century, J. Geophys. Res., 111, D11105, https://doi.org/10.1029/2005jd006810, 2006.
Vinther, B. M., Jones, P. D., Briffa, K. R., Clausen, H. B., Andersen, K. K., Dahl-Jensen, D., and Johnsen, S. J.: Climatic signals in multiple highly resolved stable isotope records from Greenland, Quaternary Sci. Rev., 29, 522–538, https://doi.org/10.1016/j.quascirev.2009.11.002, 2010.
Walsh, J. E. and Chapman, W. L.: 20th-century sea-ice variations from observational data, Ann. Glaciol., 33, 444–448, 2001.
Werner, M., Mikolajewicz, U., Heimann, M., and Hoffmann, G.: Borehole versus isotope temperatures on Greenland: Seasonality does matter, Geophys. Res. Lett., 27, 723–726, https://doi.org/10.1029/1999gl006075, 2000.
Wong, G. J., Osterberg, E. C., Hawley, R. L., Courville, Z. R., Ferris, D. G., and Howley, J. A.: Coast-to-interior gradient in recent northwest Greenland precipitation trends (1952–2012), Environ. Res. Lett., 10, 114008, https://doi.org/10.1088/1748-9326/10/11/114008, 2015.