the Creative Commons Attribution 4.0 License.
the Creative Commons Attribution 4.0 License.
 | 09 Aug 2018
Testing the consistency between changes in simulated climate and Alpine glacier length over the past millennium
Pierre-Yves Barriat
Quentin Dalaiden
François Klein
Ben Marzeion
Fabien Maussion
Paolo Pelucchi
Anouk Vlug
It is standard to compare climate model results covering the past millennium and reconstructions based on various archives in order to test the ability of models to reproduce the observed climate variability. Up to now, glacier length fluctuations have not been used systematically in this framework even though they offer information on multi-decadal to centennial variations complementary to other records. One reason is that glacier length depends on several complex factors and so cannot be directly linked to the simulated climate. However, climate model skill can be measured by comparing the glacier length computed by a glacier model driven by simulated temperature and precipitation to observed glacier length variations. This is done here using the version 1.0 of the Open Global Glacier Model (OGGM) forced by fields derived from a range of simulations performed with global climate models over the past millennium. The glacier model is applied to a set of Alpine glaciers for which observations cover at least the 20th century. The observed glacier length fluctuations are generally well within the range of the simulations driven by the various climate model results, showing a general consistency with this ensemble of simulations. Sensitivity experiments indicate that the results are much more sensitive to the simulated climate than to OGGM parameters. This confirms that the simulations of glacier length can be used to evaluate the climate model performance, in particular the simulated summer temperatures that largely control the glacier changes in our region of interest. Simulated glacier length is strongly influenced by the internal variability in the system, putting limitations on the model–data comparison for some variables like the trends over the 20th century in the Alps. Nevertheless, comparison of glacier length fluctuations on longer timescales, for instance between the 18th century and the late 20th century, appear less influenced by the natural variability and indicate clear differences in the behaviour of the various climate models.
- Article
(8296 KB) -
Supplement
(1457 KB) - BibTeX
- EndNote


As it offers a longer perspective compared to the so-called instrumental period (from roughly 1850 CE to present), the past millennium is a key period to study decadal to centennial climate variations. The syntheses of the available climate records indicate a general temperature decrease from the beginning of the second millennium to the beginning of the 19th century, followed by a large warming over the 20th century (Jones et al., 2009; Mann et al., 2009; PAGES 2k Consortium, 2013, 2017; Neukom et al., 2014). Nevertheless, the spatio-temporal structure of the temperature changes is complex, with warm and cold periods being generally not synchronous between different regions (PAGES 2k Consortium, 2013). Those conclusions are in overall agreement with the results derived from global climate models driven by estimates of natural and anthropogenic forcings, although models tend to underestimate the magnitude of the changes in some regions and to simulate more homogenous changes than in the reconstructions (Goosse et al., 2005; Raibble et al., 2006; Gonzalez-Rouco et al., 2006; Jungclaus et al., 2010; Phipps et al., 2013; Fernández-Donado et al., 2013; Landrum et al., 2013; Neukom et al., 2014; Moberg et al., 2015; PAGES2k-PMIP, 2015; Otto-Bliesner et al., 2016).
The data syntheses covering the past millennium are based on many different archives such as trees, corals, glacier ice, lake sediments, pollen, speleothems and marine sediments. They generally do not include glacier length fluctuations, although the latter can be used for independent tests of reconstructed changes (Guiot et al., 2010; Luterbacher et al., 2016). Glaciers are complex recorders of past conditions. Their fluctuations depend on the surface mass balance, which is influenced by several factors, including temperature, precipitation and incoming radiation changes over the glacier, as well as by the glacier dynamics and thus local geometry (Oerlemans, 2001; Huss et al., 2008; Roe, 2011). Furthermore, because of their long response time, glaciers integrate forcing over periods ranging from a few years to several decades or even centuries (e.g. Jòhannesson et al., 1989; Leysinger Vieli and Gudmundsson, 2004). Consequently, glacier length fluctuations cannot be directly compared to records with a much faster response or simply included in multi-proxy reconstructions of past climate changes (Oerlemans, 2005; Roe, 2011; Solomina et al., 2016; Roe et al., 2017).
Despite these difficulties, it is possible to estimate the temperature and precipitation variations that were at the origin of glacier length fluctuations (Mackintosh et al., 2017). One method is to drive a glacier model with a range of climate conditions to determine the ones that are compatible with the glacier length records (Allison and Kruss, 1977; Oerlemans, 1986; Jomelli et al., 2011; Leclercq et al., 2012; Luthi, 2014; Malone et al., 2015; Sagredo et al., 2017; Zechetto et al., 2017; Doughty et al., 2017). The temperature and precipitation reconstructions deduced from glacier length fluctuations can also be compared to estimates obtained from other records and climate model results to test the compatibility between the different sources of information. At a large scale, temperature reconstructions have been obtained using simple glacier models in inverse mode (Oerlemans, 2005; Leclercq and Oerlemans, 2012), assuming that the selected glaciers are mainly influenced by temperature. However, the inversion required to obtain a temperature or a precipitation reconstruction from observations can be ill-conditioned if the record is influenced by several environmental factors, as is the case for glacier length. It thus might be very difficult to disentangle, for instance, the contribution of changes in precipitation and temperature, leading to large uncertainties or biases in the reconstructed signal (Evans et al., 2013; Leclercq and Oerlemans, 2012; Mackintosh et al., 2017).
An alternative method is to drive a glacier model directly with climate model results and compare the simulated length with the observed one. A similar approach, in which a proxy system model has been applied to simulate directly the observed quantity, has been successfully applied to a wide variety of variables such as tree ring widths, coral or speleothem composition (Evans et al., 2013; Dee et al., 2015). The advantages are that the comparison is made on exactly the same variable for models and observations and that the problems related to an inversion are avoided. Until now, comparisons of climate model results with glacier length over the past millennium and the Holocene have been rare and the few existing studies were focused on a small number of glaciers (Weber and Oerlemans, 2003; Leclerq et al., 2012). This limits the ability to assess the climate model performance from glacier length records and the analysis of the origin of observed glacier changes using climate model results.
In addition to the simulated climate, the quality of the comparison between modelled and observed glacier lengths depends on several factors that need to be addressed. First, glacier models have their own limitations (Huss and Hock, 2015; Maussion et al., 2018) and some of the disagreements between simulated results and observations might be attributed to the glacier model and its initial/boundary conditions (e.g. Farinotti et al., 2017) rather than to the climate model. An additional source of uncertainty is related to the internal variability in the climate, which can be dominant at a regional scale for the past millennium (Goosse et al., 2005, 2012a; Jungclaus et al., 2010; Otto-Bliesner et al., 2016). As the climate fluctuations are integrated by the glaciers, this induces glaciers length changes reaching potentially several hundreds of metres (Oerlemans, 2000; Roe et al., 2009; Roe and O'Neal, 2009; Barth et al., 2017).
Our goal here is to perform a systematic evaluation of climate model behaviour by using the outputs of simulations covering the past millennium to force a global glacier model (Maussion et al., 2018). The main objective is to provide a new validation procedure for climate models complementary to the existing ones. Specifically, we will estimate the compatibility of the simulated multi-decadal to centennial-scale climate variability with glacier length records, analysing the links between glacier fluctuations and temperature changes. This implies an estimation of the sources of uncertainty associated with glacier modelling and of the contribution of internal variability to simulated changes. Additionally, the comparison will provide a test of our ability to reproduce past glacier variations using tools that are similar to the ones applied to estimate future changes in glaciers and their contribution to sea level rise (e.g. Marzeion et al., 2012, 2018; Gregory et al., 2013; Bliss et al., 2014; Huss and Hock, 2015; Slangen et al., 2016). The initial focus here is on European glaciers and more specifically on the Alps because of the availability of records that are long enough for our analyses.
The climate model results, the glacier model and the glacier length observations are described in Sect. 2. The results of the glacier model driven by a range of climate models are compared with observations in Sect. 3. This includes a discussion of the contribution of internal variability to glacier fluctuations and its impact on the conclusion of a model–data comparison. The sensitivity of the results to key parameters of the glacier model and to the experimental set-up are discussed in Sect. 4. Final conclusions are proposed in Sect. 5.
2.1 Climate model results
The climate variables used to drive the glacier model are derived from simulations following the Past Model Intercomparison Project (PMIP3) and the Coupled Model Intercomparison Project (CMIP5) protocols (Schmidt et al., 2011; Taylor et al., 2012; PAGES2k-PMIP3, 2015). They were downloaded from the Program for Climate Model Diagnosis and Intercomparison (PCMDI; http://pcmdi9.llnl.gov; last access: 15 November 2017) and the Earth System Grid (https://www.earthsystemgrid.org/; last access: 15 November 2017) archives. We have selected the same simulations as in Klein et al. (2016) (Table 1). Some of these simulations do not transition continuously in 1850 from the experiments referred to as “past1000” in CMIP/PMIP nomenclature (years 851–1850) to the “historical” (years 1851–2005) simulations. Because of this discontinuity associated with the experiment design, a jump can be present on the simulated variables in 1850, but it is relatively small for the selected experiments so they can be merged with a limited impact on the results. Those simulations are driven by natural (orbital, solar, volcanic) and anthropogenic (greenhouse gas, ozone, aerosol, land use) forcings (Schmidt et al., 2011, 2012). Nevertheless, the simulations performed with BCC-CSM1-1 and IPSL-CM5A-LR (for model abbreviations, please see Table 1) do not include land-use forcing. Additionally, the aerosol forcing is not activated in the IPSL-CM5A-LR simulation. One simulation for CCSM4, GISS-E2-R, IPSL-CM5A-LR, MPI-ESM-P and BCC-CSM1-1 and an ensemble of 10 simulations with CESM1 are used here. More details about the simulations and the forcing applied in each of them can be obtained in Klein et al. (2016) and PAGES2k-PMIP3 (2015).
2.2 The Open Global Glacier Model
The Open Global Glacier Model (OGGM; Maussion et al., 2018) is an open-source model that simulates the evolution of individual glaciers, explicitly accounting for glacier geometry, even in complex configurations involving contributory branches. The first step is to describe the glacier outlines and topography from global public databases: the RGI version 5 (RGI Consortium, 2015) and SRTM topography data version 4 (Jarvis et al., 2008). The glacier main branches, tributaries and flow lines are then defined, and the glacier ice thickness is estimated by solving the equations of ice flow and mass conservation along the flow line.
The mass balance is computed from the equation (Marzeion et al., 2012):
where mi(z) is the mass balance of month i at the altitude z. is the monthly solid precipitation, and Ti(z) is the monthly mean temperature. The amount of solid precipitation is derived from the total amount of precipitation assuming that precipitation is entirely solid below 0 ∘C, entirely liquid above 2 ∘C and the fraction of solid precipitation varies linearly with temperature between those two values. pf is a correction factor included to take into account the larger precipitation over the glaciers than in the surrounding terrain and at lower altitudes where observations are available. Its value is constant for all the glaciers and is taken to be equal to 2.5 (e.g. Giesen and Oerlemans, 2012). Melting occurs if monthly temperature is above Tmelt, which is equal to −1 ∘C in OGGM, as melting may occur some days even though the monthly mean is below 0 ∘C. This value has been selected on the basis of a cross-validation procedure similar to the one conducted by Marzeion et al. (2012). μ* is the temperature sensitivity parameter, and ε a residual bias. μ* and ε are estimated first for glaciers where mass balance observations are available and then extrapolated to the other glaciers following a procedure described in Marzeion et al. (2012) and Maussion et al. (2018).
The ice dynamics is based on the shallow-ice approximation and is computed along the flow line. In the shallow-ice approximation, the vertical variations in ice flow are neglected and only a depth-integrated ice velocity is computed. This is a common approximation for computationally efficient ice flow models, and it is largely valid as long as the considered horizontal scales are much larger than the vertical scales (Hutter, 1981, 1983). Basal sliding is also neglected here. For the prefrontal areas, the direction and path of ice flow are obtained by computing the route from the glacier tongue toward the end of the domain that is the least costly in terms of positive altitudinal change. The flow line therefore follows the valley as a river would do. Along this flow line, we estimate the shape of the bed by fitting a parabola to the intersection points between the actual topography and the normal to the flow line. A main parameter of the model is the creep parameter A. A low value of A corresponds to stiff ice, low velocities and generally a higher ice volume while a high value of A is associated with softer ice and leads to a faster flow and lower ice volumes. The standard value of A selected in OGGM is constant for all glaciers and is set equal to 2.4×10⁻²⁴ s−1 Pa−3, while in reality A may change by a factor of 10 between glaciers due to a wide range of processes (Cuffey and Paterson, 2010).
One advantage of OGGM is that it can be applied to any glacier. It does not require any specific detailed information that would be lacking for the majority of them. Besides, it includes simplifications compared to models focused on a particular, well-observed glacier (e.g. Zekollari et al., 2014) and is therefore computationally efficient.
The climate model outputs required to drive OGGM are the monthly mean temperature and precipitation. The local temperature is obtained by assuming a constant lapse rate of 6.5 K km−1. To take into account the biases of the climate model, a simple correction procedure is applied: the model results are adjusted to have the same climatological monthly mean values over the reference period 1900–2000 as in the Climatic Research Unit (CRU) data set (New et al., 2002; Harris et al., 2014) used in the standard version of the model (Maussion et al., 2018). The simulations cover the period 850–2005, corresponding to the past1000 and historical simulations in the PMIP3/CMIP5 protocol. However, the sensitivity tests that we have performed have shown that the first century is influenced by the choice of initial conditions for the selected glaciers. Consequently, we will only present the results after 1000 CE.
2.3 Glacier length observations
Glacier surface mass balance is the variable that is the most directly related to climate, but only a few, generally short, records are available (Zemp et al., 2009). The number and duration of glacier length observations are much greater (Oerlemans, 2005; Leclercq et al., 2014; Zemp et al., 2015; Solomina et al., 2016). The most accurate estimates are deduced from direct observations of the glacier terminus position as recorded for instance by the World Glacier Monitoring Service in the Fluctuations of Glaciers (WGMS, 2017). The modern observations can be complemented by historical sources including old maps, painting, drawing and early photographs as well as written documents (Grove, 2004; Nussbaumer and Zumbühl, 2012; Purdie et al., 2014; Zumbühl and Nussbaumer, 2018). Additional evidence is obtained by dating the position of moraines indicating the position of the glacier at specific times or from the trees that have been overridden by the advance of a glacier (Masiokas et al., 2009; Ivy-Ochs et al., 2009; Wiles et al., 2011; Schimmelpfennig et al., 2014; Le Roy et al., 2015; Moran et al., 2017).
As the comparison of model results with observational estimates is a key element of our methodology, we have applied OGGM to 71 glaciers from the European Alps that have records covering at least the 20th century in the global compilation of Leclercq et al. (2014). Twelve of these glacier length series go back to 1800 CE, seven go back to 1700 CE, and the longest record starts in 1535 CE (Unterer Grindelwald), allowing for each of them a quantitative comparison with model results at multi-decadal to centennial timescales. The complete list of glaciers is provided in the Supplement (Table S1). Longer records are also available for many glaciers, but these are discontinuous and more uncertain, as reviewed in Solomina et al. (2016). Some of these records will be used for a qualitative evaluation of our results.
Enhanced winter precipitation has been suggested to be an important contributor to some past changes in glacier length in the Alps (e.g. Vincent et al., 2005; Steiner et al., 2005, 2008). Nevertheless, summer temperature is generally considered as the major driver of European glacier fluctuations at centennial timescales (Oerlemans, 2001; Steiner et al., 2005; Huss et al., 2008; Steiner et al., 2008; Leclerq and Oerlemans, 2012; Zekollari et al., 2014). It is thus instructive to first compare the simulated temperatures with reconstructions before analysing the glacier themselves. Europe is probably the continent where the density of records of past temperature changes is the highest and several large-scale reconstructions are available (Luterbacher et al., 2004; Guiot et al., 2010; Pages2k Consortium, 2013; Luterbacher et al., 2016). For simplicity, we will only discuss here the most recent spatial reconstruction of summer temperature, which is highly correlated with long thermometer observations and the majority of individual records (see Luterbacher et al., 2016 for more details).
In agreement with previous studies (Raible et al., 2006; Hegerl et al., 2011; Goosse et al., 2012b; PAGES2k-PMIP3, 2015; Luterbacher et al., 2016), most models are able to reproduce the relatively warm conditions observed at a continental scale during the first centuries of the millennium, the cold conditions around 1600–1800 and the large warming of the 20th century (Fig. 1). However, they underestimate the magnitude of the changes for some (multi-)decadal-scale events compared to the reconstruction of Luterbacher et al. (2016). Interestingly, some models display an industrial-era warming that occurred earlier or later than observed (Abram et al., 2016), with a potentially large impact on the glacier retreat over the recent period. At a regional scale for the Alps, the conclusions are similar except that the internal climate variability becomes large enough so that simulation results cover nearly the full range provided by the reconstruction, even for the decadal-scale warm or cold events.
The comparison between OGGM results driven by the various climate models and observations leads to contrasting results for individual glaciers (Supplement Fig. S1). This was expected as we have specifically not modified or adapted the parameters in order to apply strictly the standard configuration of the model in this first set of simulations. Nevertheless, for the large majority of the glaciers, the observed length changes are well within the range simulated by the model. For some others, all the simulations overestimate or underestimate the trends over the 20th century or the variability in the pre-industrial period. This is illustrated in Fig. 2 for five well-known glaciers, but a similar behaviour is seen for many others (see Supplement Fig. 1). In these examples, the models tend to underestimate the retreat of the Unterer Grindelwald and Mer de Glace during the 19th century but some of them have a larger retreat than observed for those two glaciers over the 20th century. The agreement is better for the Hintereis, Great Aletsch and Bossons glaciers although for the latter most models overestimate the magnitude of the changes compared to observations.
A detailed comparison between simulations and observed results for each glacier is beyond the scope of the present study as differences may have their origin in the specific characteristics of the glacier such as its stiffness or the presence of debris, in the links between the local climate and large-scale changes, and in uncertainties in the calibration of the climate sensitivity parameter of OGGM, etc. However, a behaviour common to a large majority of the glaciers can be associated with a particular climate model and can be described by simply calculating the mean changes over all the glaciers. Conclusions are qualitatively similar for the mean of absolute changes (Fig. 3a) and the mean of relative changes (Fig. 3b). For these latter diagnostics, the glacier length changes are normalized using their observed length in 1950 before calculating the average. This implies that the absolute mean is not dominated by the long glaciers with large fluctuations but reflects a general signal present in the majority of glaciers.
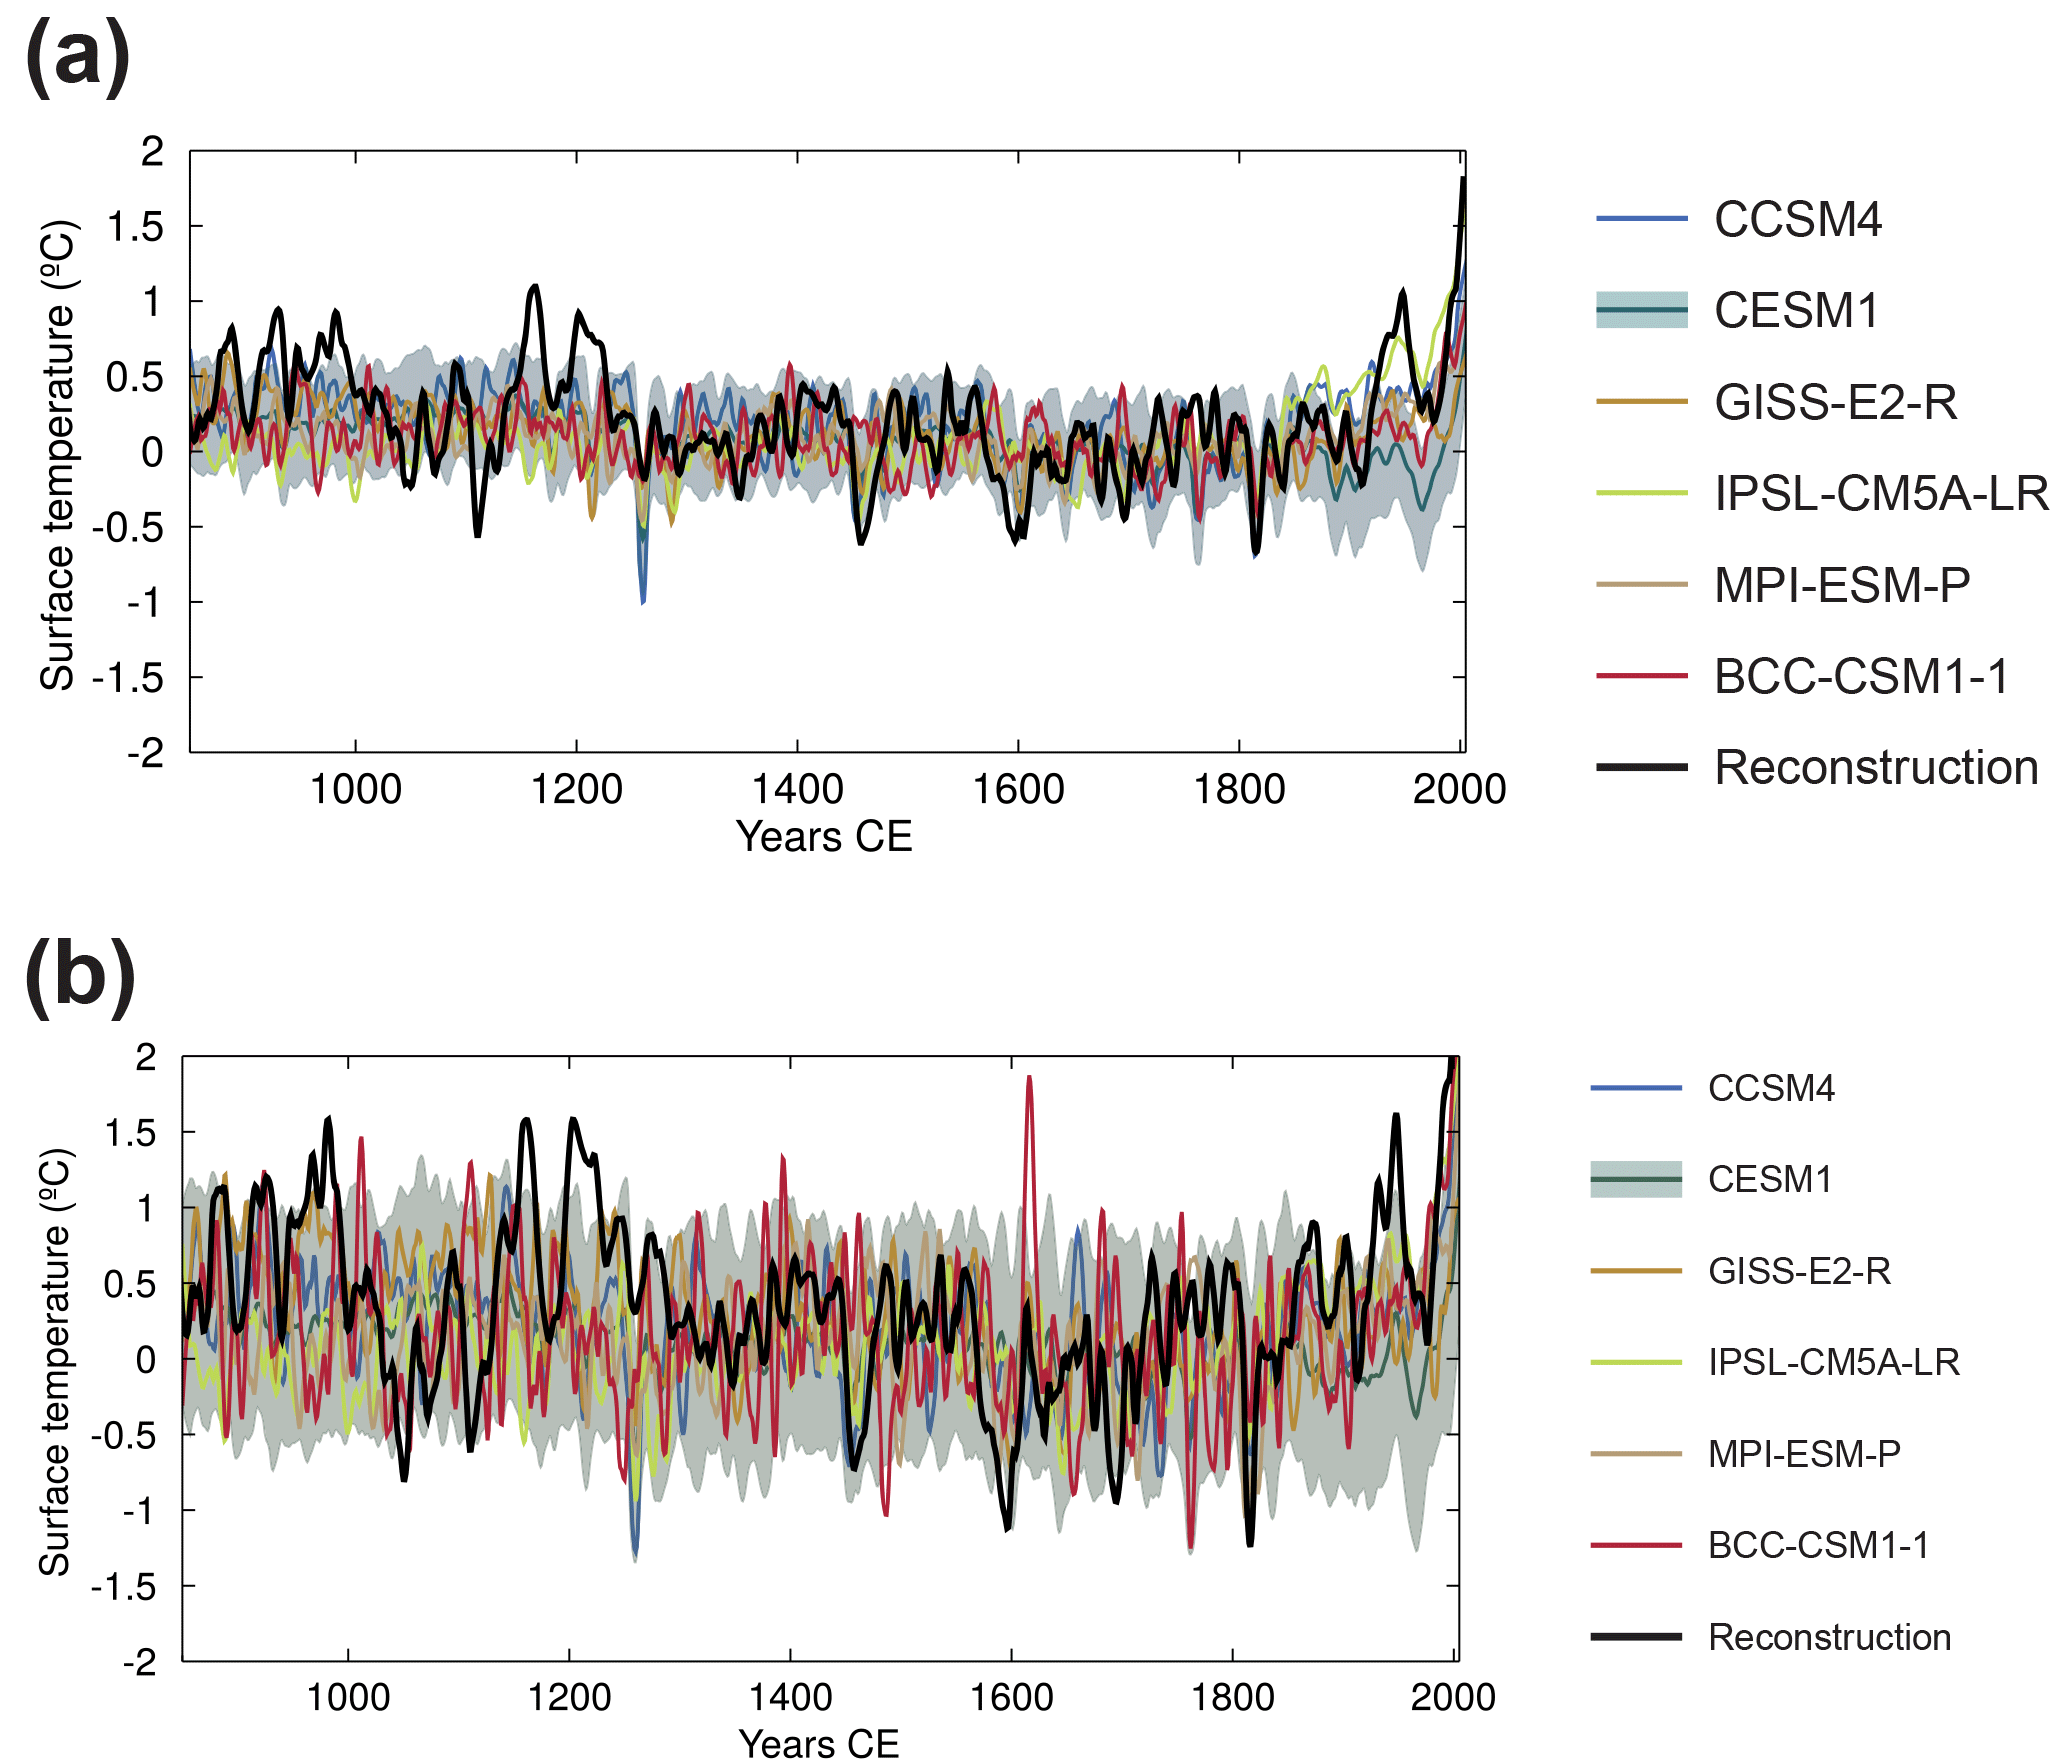
Figure 1Summer temperature averaged over (a) Europe and (b) the Alpine region (defined here as the area between 45 and 48∘ N and between 6 and 13∘ E) in the reconstruction of Luterbacher et al. (2016) and as simulated by climate models over the past millennium. The shaded area represents the mean plus and minus 1 standard deviation of the CESM1 model ensemble. A 15-year Lowess smoothing has been applied to the time series. The reference period is the years 1500–1850 CE as in Luterbacher et al. (2016).
For some climate models (such as the IPSL model), OGGM simulates a relatively stable mean glacier length in the pre-industrial period. When driven by the other climate model outputs, the growth trend between 1000 and 1850 is larger, in particular for the GISS model, CESM and CCSM4. This is followed by a large retreat starting in the 19th century, except in CESM for which the melting begins in the 20th century for nearly all members.
Visually, the difference between simulated glacier lengths (Fig. 3) appears to be much larger than for the temperature (Fig. 1), suggesting that glacier length provides a clear constraint on climate model behaviour. However, part of it may be related to the way the figure is presented. In particular, using a reference period in the 20th century, as required because of the short duration of the glacier records, tends to amplify the differences in the pre-industrial period compared to the classical reference period chosen for temperature (Fig. 1). This is illustrated in Supplement Fig. 2 in which temperature series have been plotted with a reference period in the 20th century.
Additionally, some of the differences between the simulated glacier lengths may be due to the integration of the internal climate variability by the glaciers and not to a systematic difference between climate models. This impact of internal variability can be quantified from the ensemble of simulations performed with CESM. We have to be careful since this estimate is derived from one model only, which displays significant differences to some of the other models for the Alps. Nevertheless, this provides a first-order estimate. The glacier retreat over the 20th century varies strongly between CESM ensemble members, with the observed changes in the lower range of the ensemble (Fig. 4a). Consequently, although the magnitude of the changes varies considerably between simulations, it is impossible to reject firmly the hypothesis that the differences between climate models and between models and observations for the Alps over this period are due to internal climate variability only.
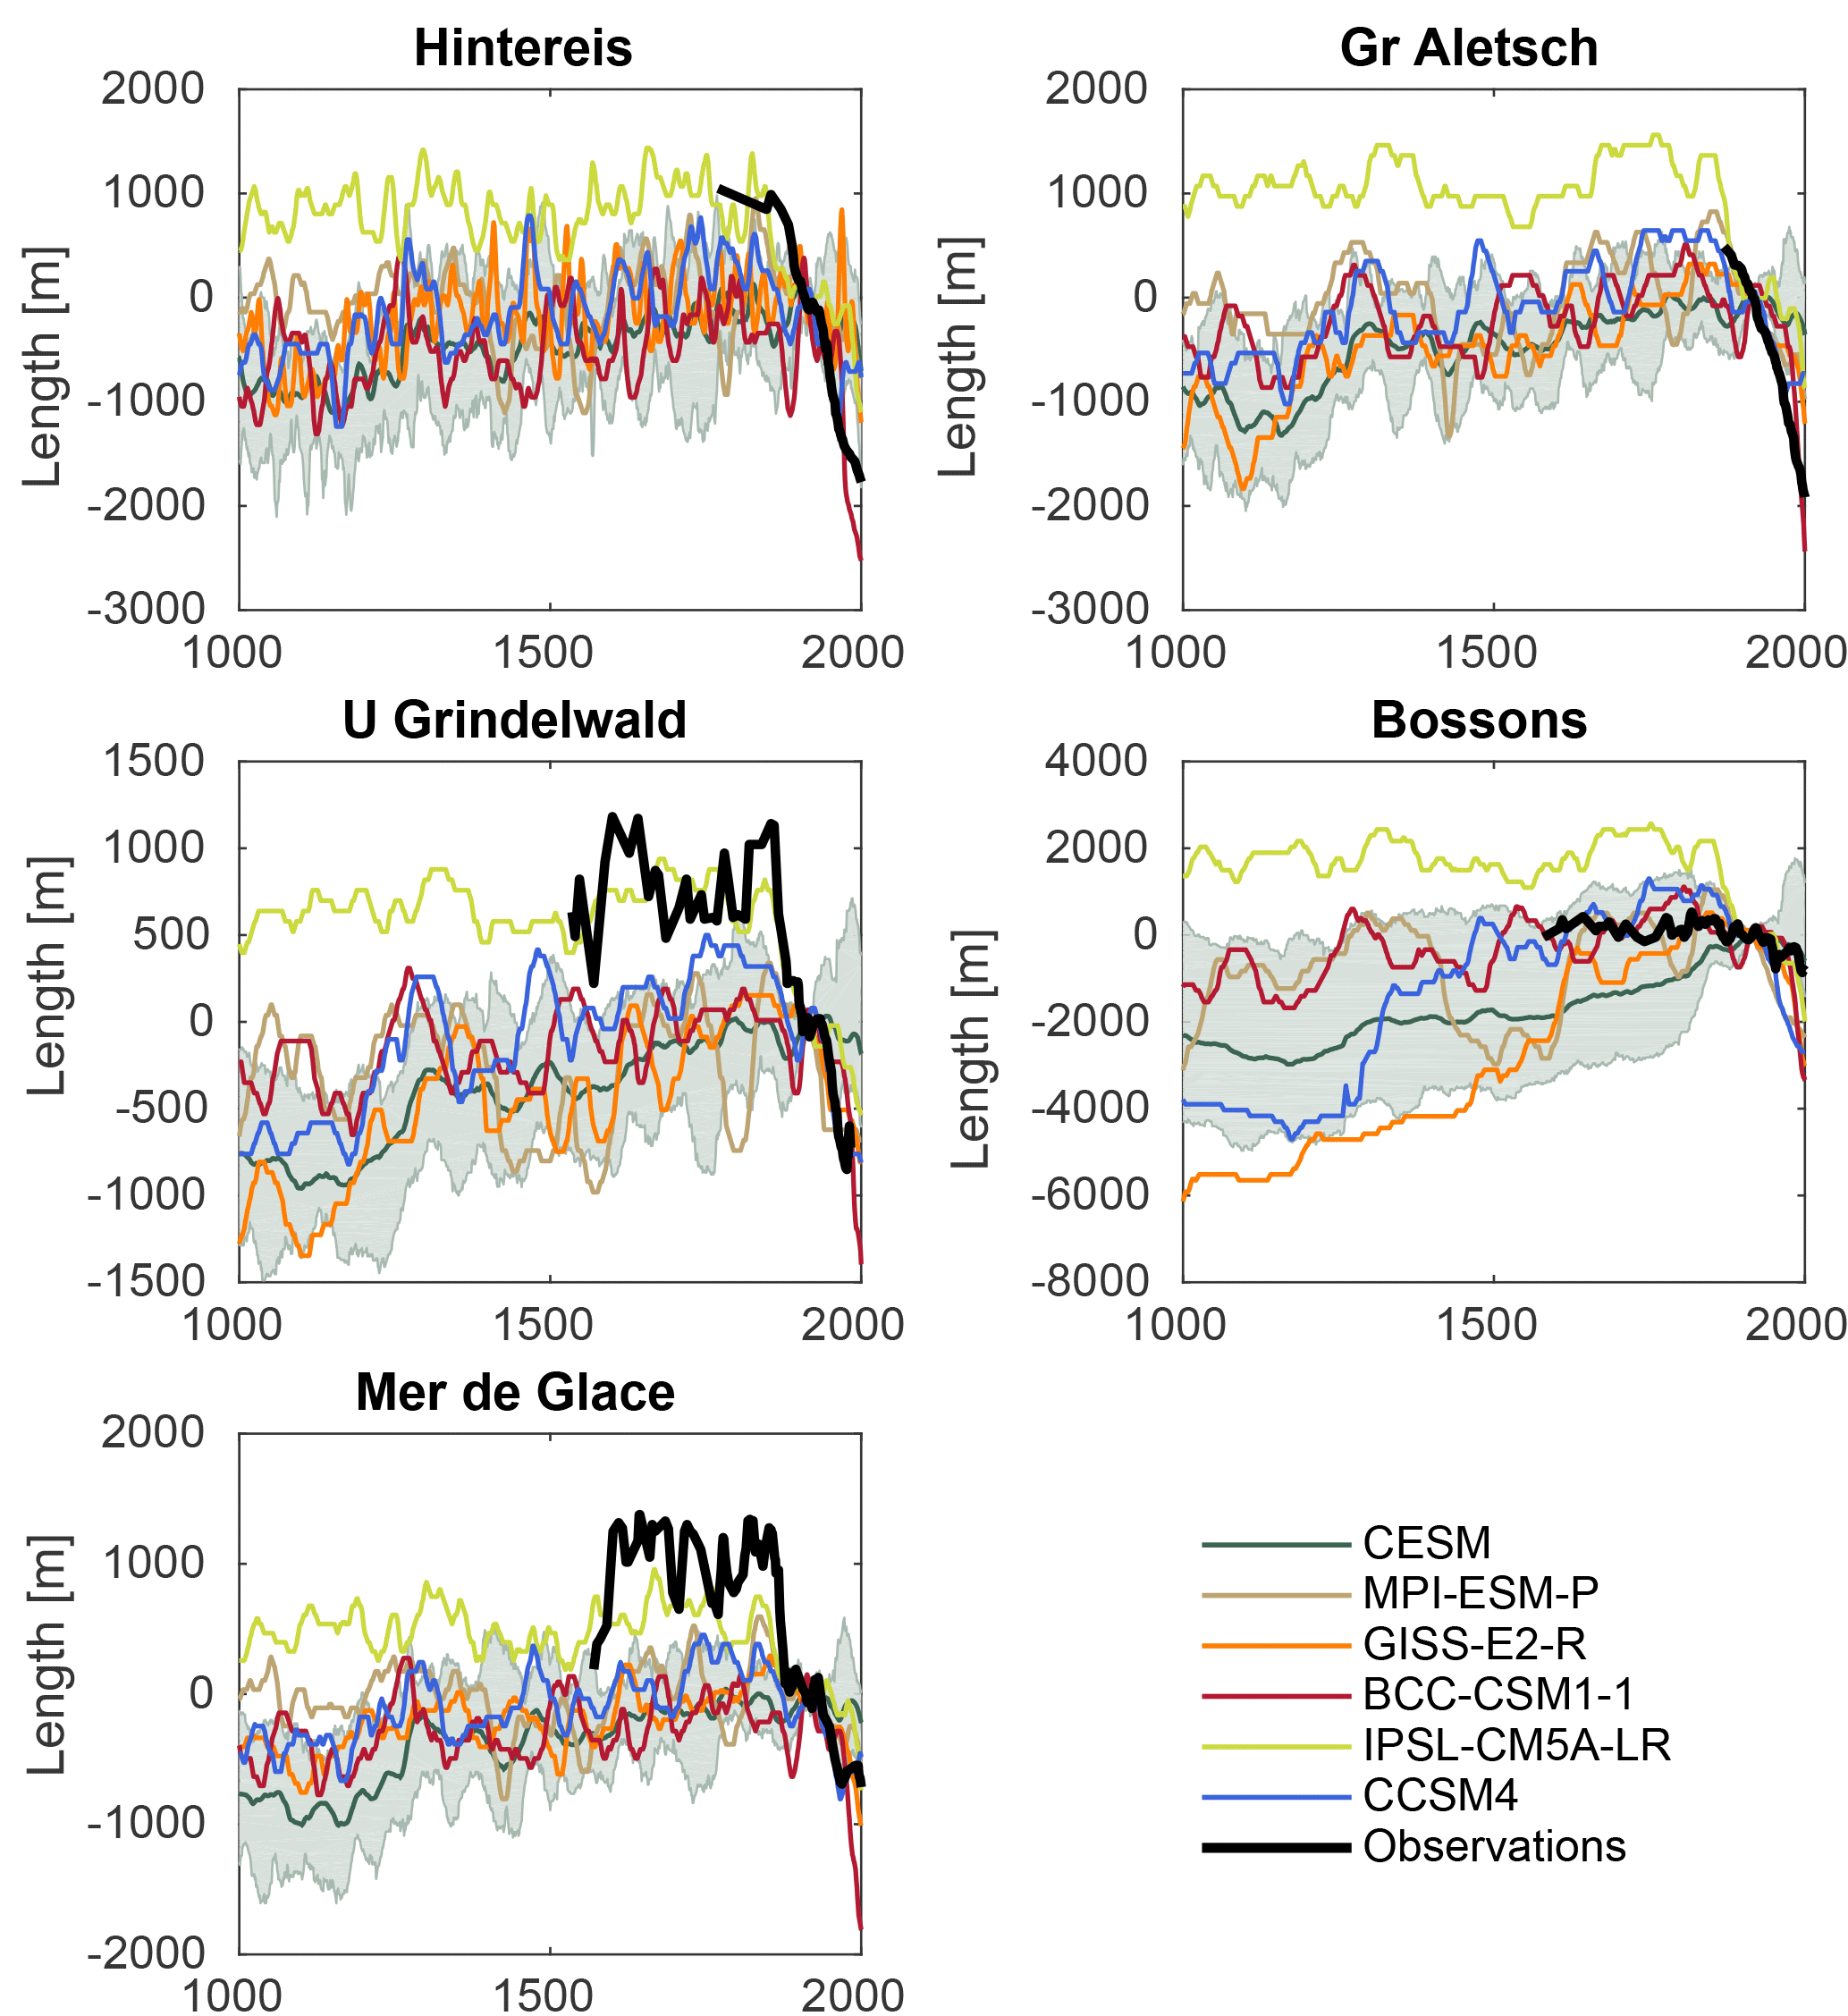
Figure 2Observed and simulated length for five selected glaciers in the Alps. The shaded area represents the range of the ensemble of simulations driven by CESM outputs. The reference period is 1901–1930 CE.
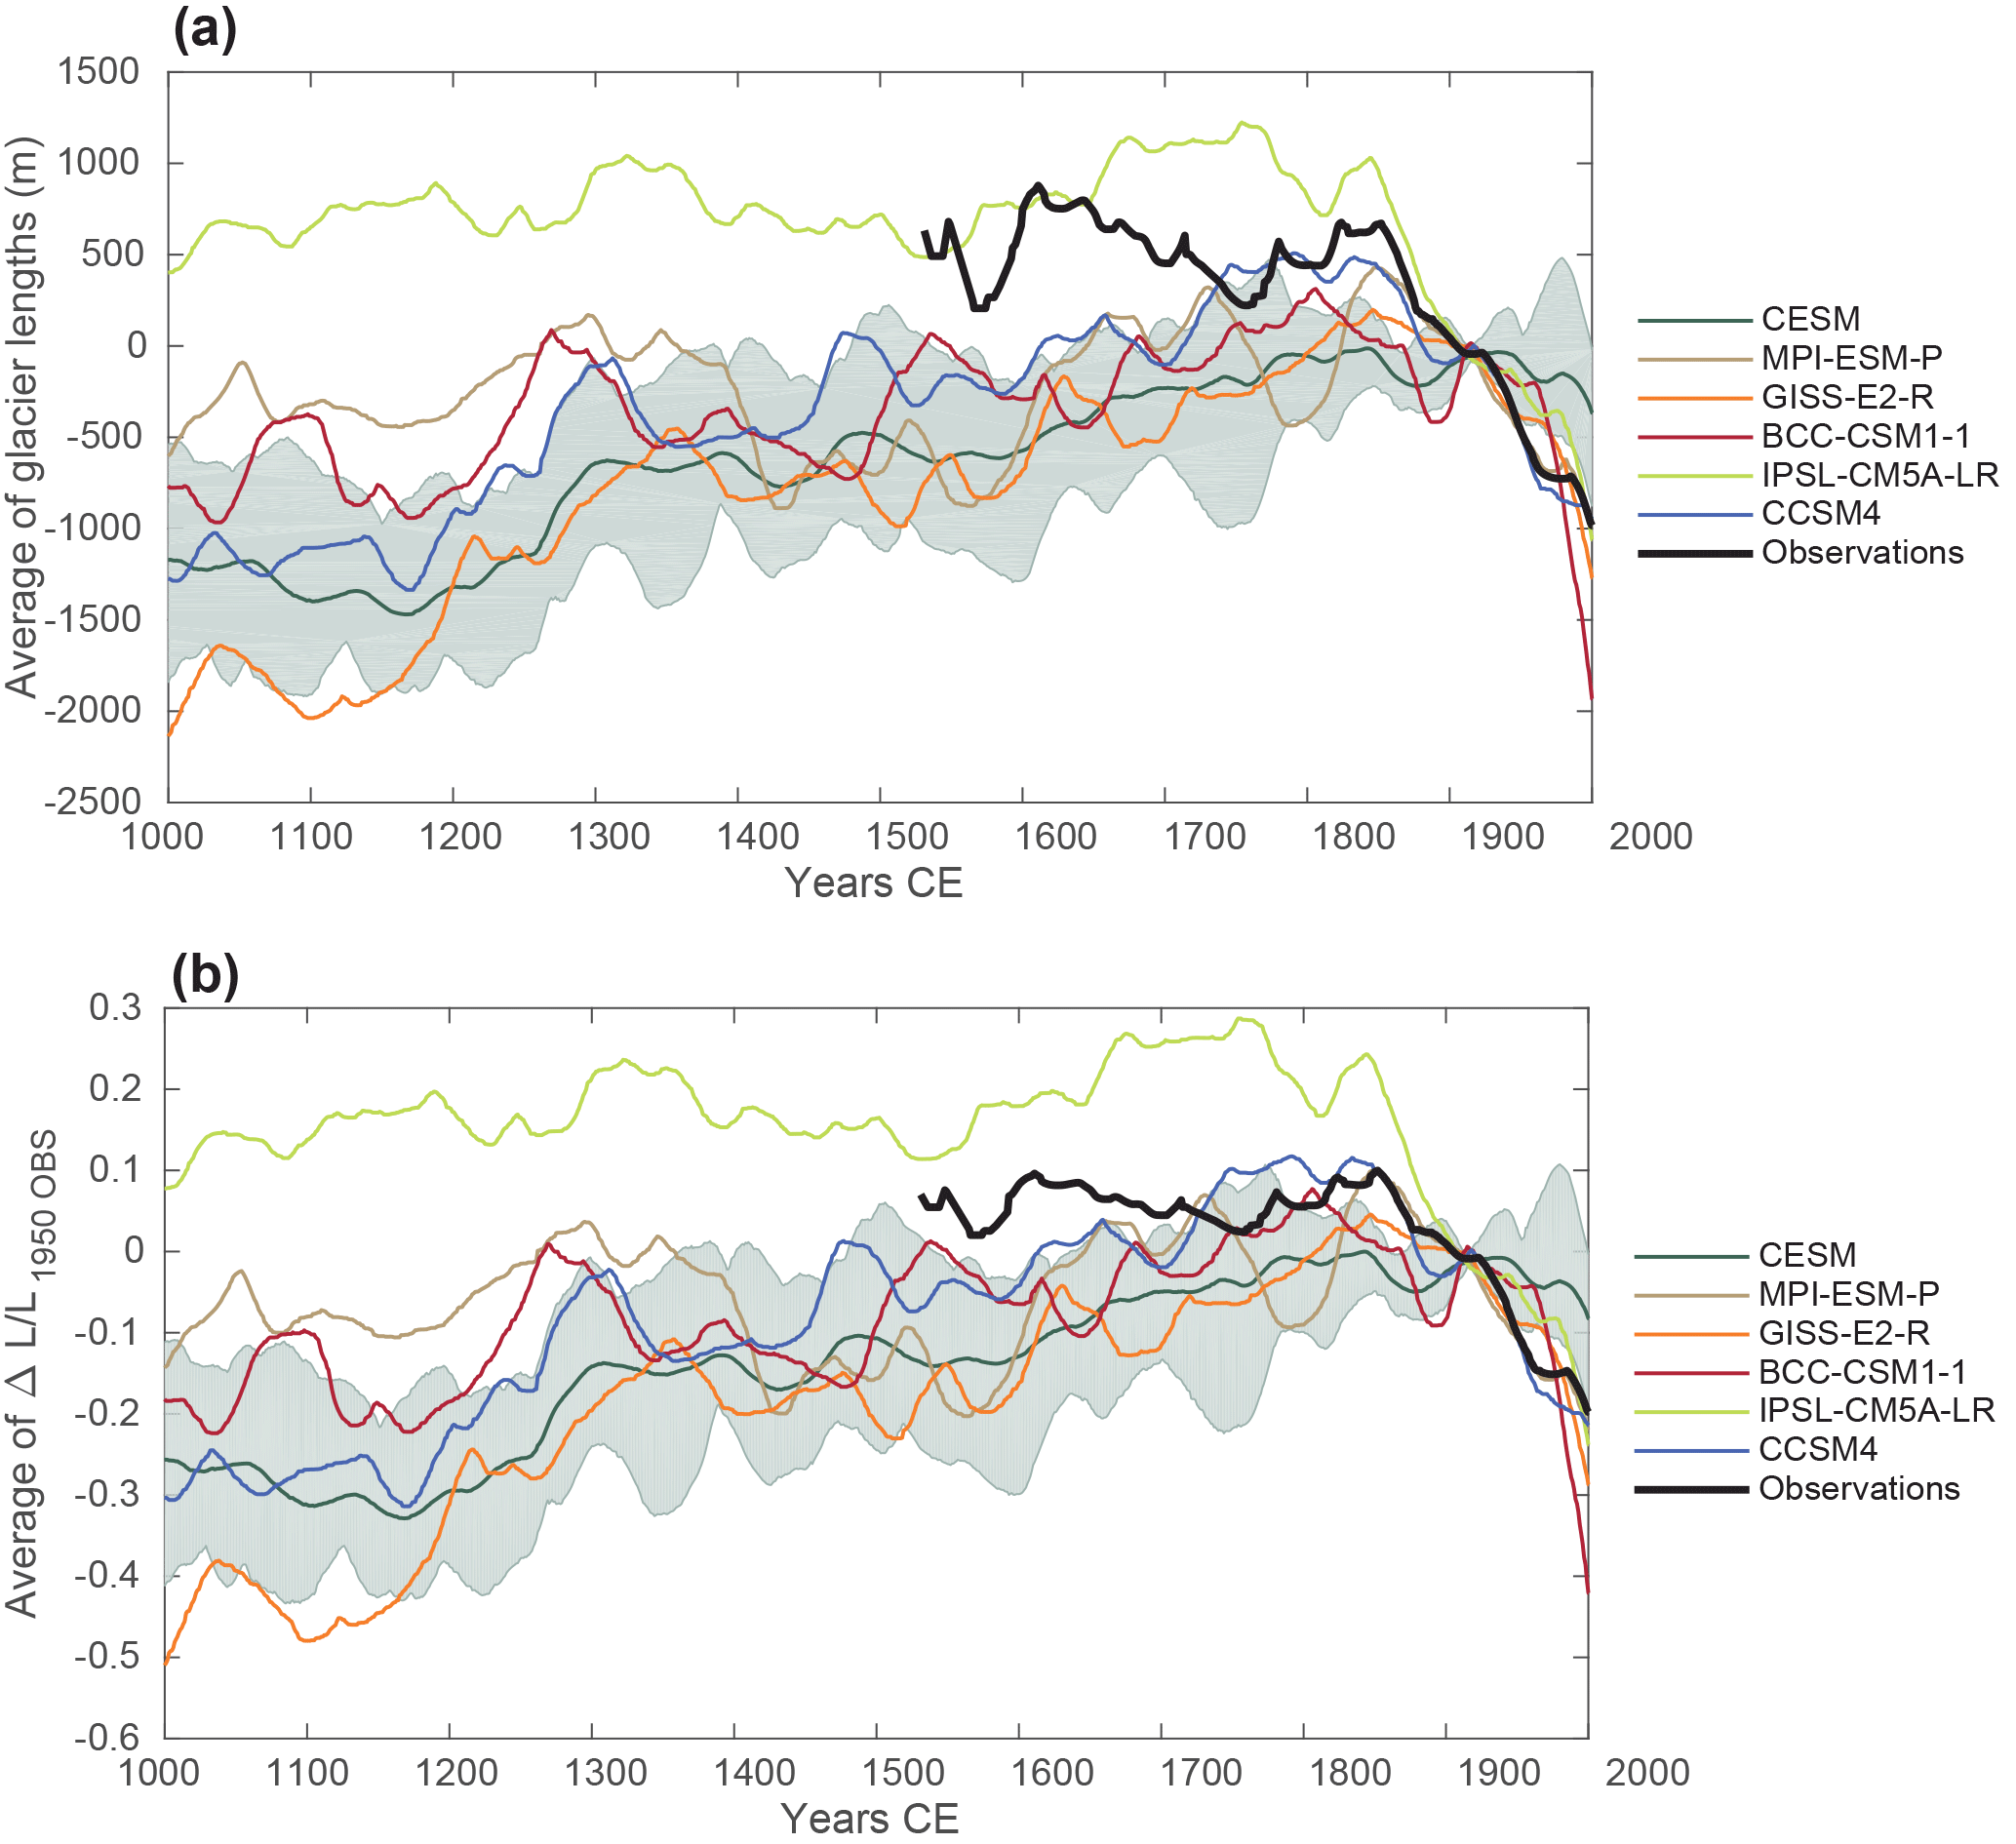
Figure 3(a) Absolute and (b) relative length changes averaged over the 71 glaciers. The relative length is obtained by dividing the glacier changes by their length in 1950 in the compilation of Leclercq et al. (2014). The average for observations is calculated over the available time series for each period, meaning that the number strongly decreases with time and, in particular, is very low before 1700. The reference period is 1901–1930 CE.
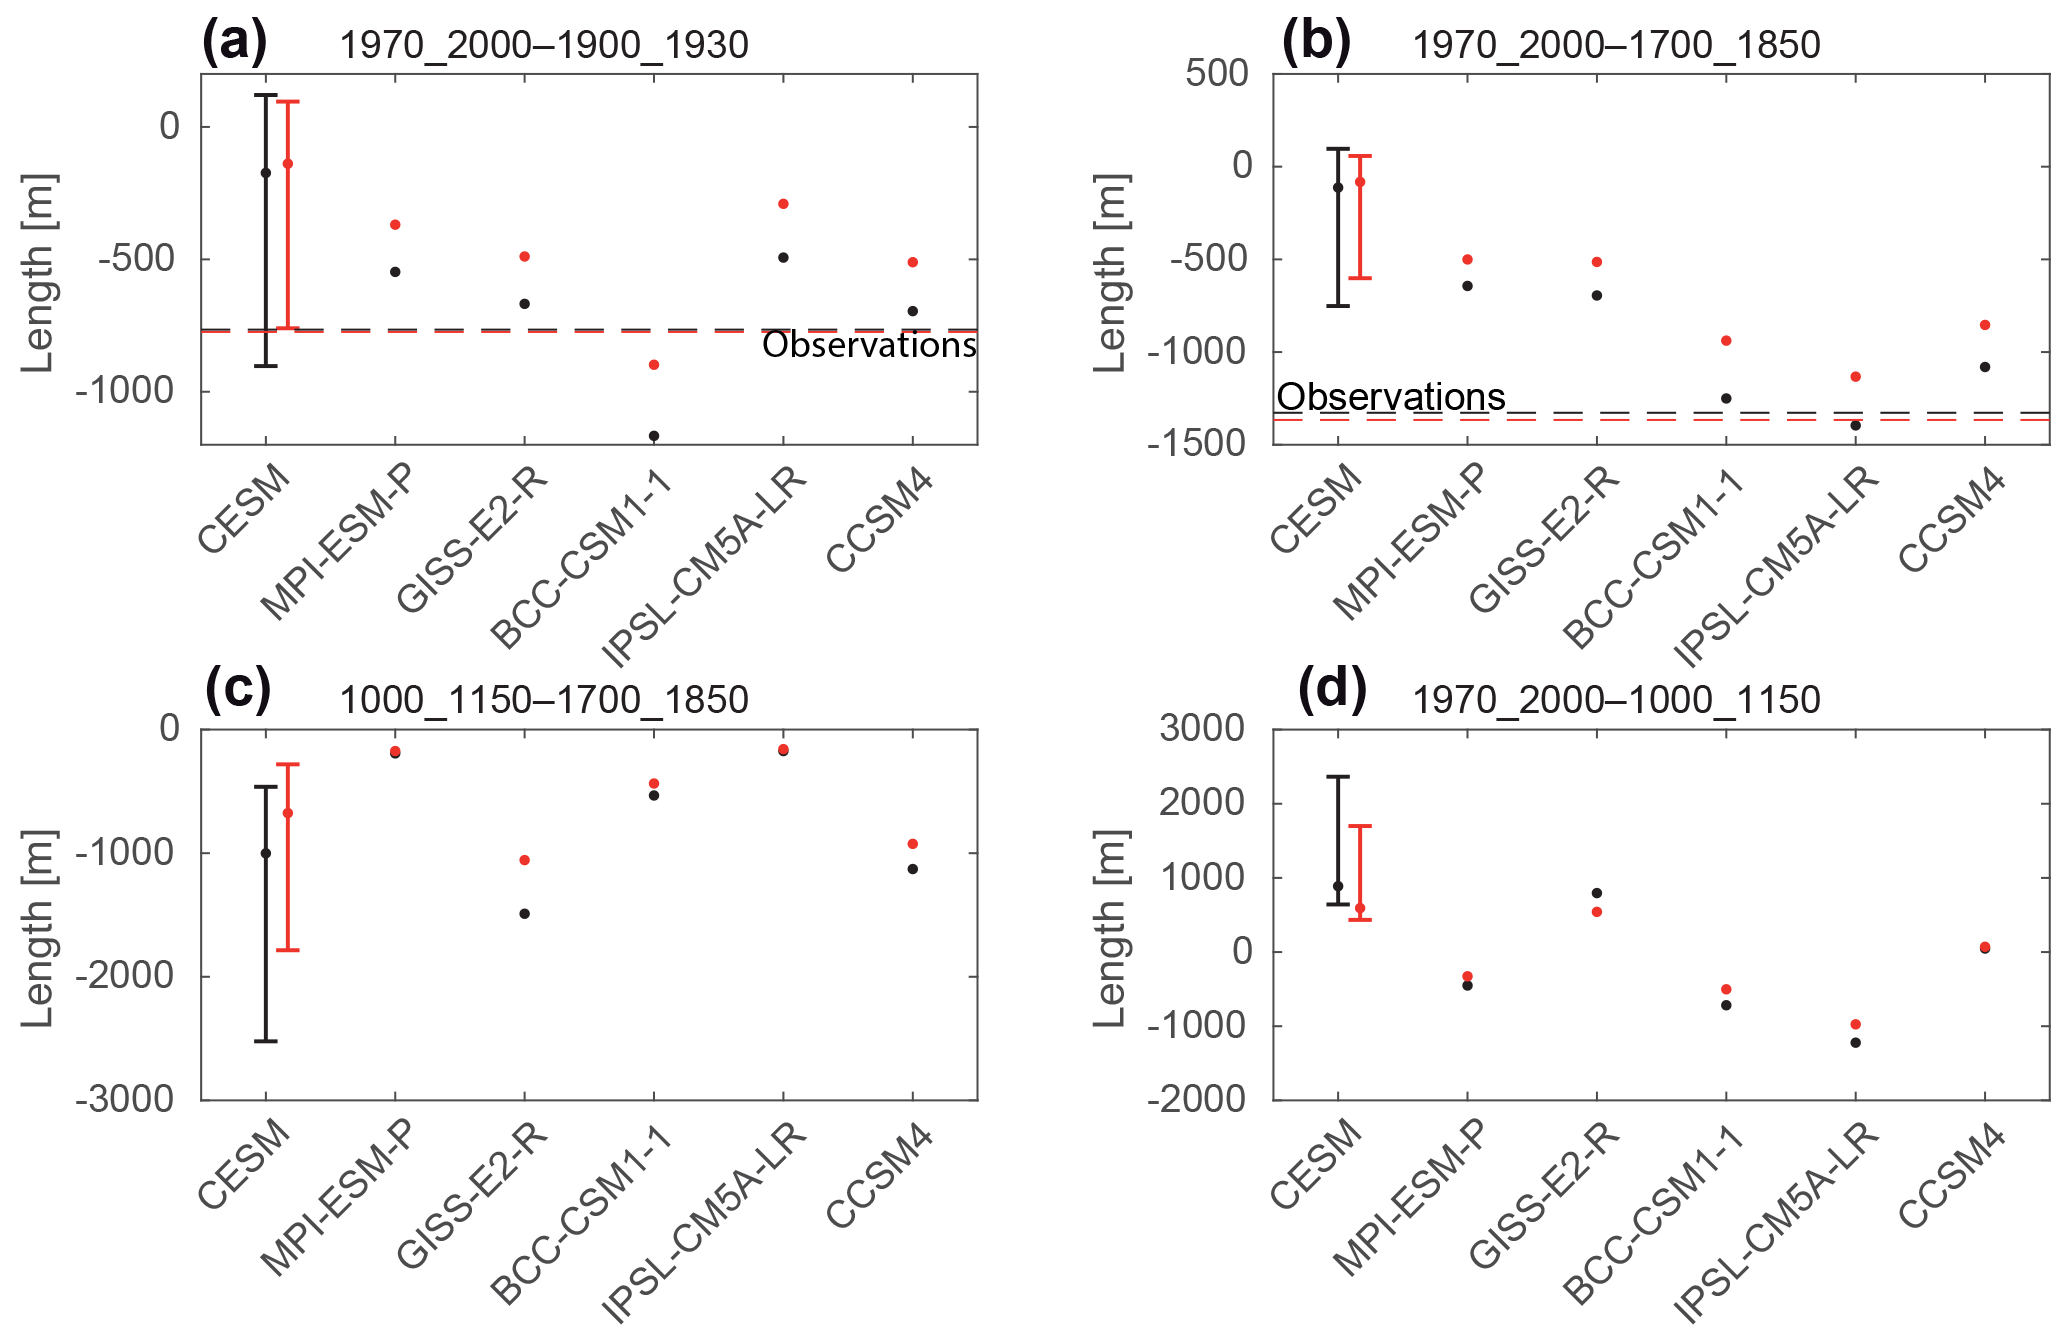
Figure 4Mean (black) and median (red) of the difference in glacier length between (a) 1970–2000 and 1900–1930; (b) 1970–2000 and 1700–1850; (c) 1000–1150 and 1700–1850; and (d) 1970–2000 and 1000–1150. In panels (a) and (b), observations are given as a horizontal dashed line. No observation is available for (c) and (d). For (b), the average of model results is made only for the glaciers that have observations. For CESM, the bar gives the ensemble range.
The signal is clearer when comparing the late 20th century with the years 1700–1850 (Fig. 4b), which roughly corresponds to the maximum extent in the simulated results. All the simulations driven by CESM underestimate the observed changes between those two periods, as the simulated glacier retreat starts much later than in the observations (Fig. 3). The simulations using the standard version of OGGM driven by the other climate models are at the margin or out of the CESM ensemble range, suggesting that the difference are not only due to internal climate variability but are related to different characteristics of the simulations performed with the various climate models. Those simulated results are closer to observations, in particular the ones driven by CCSM4, IPSL and BCC (Beijing Climate Center) model results.
Computing the difference between the years 1000 and 1150 CE (Fig. 4c), when the glacier extent was close to its minimum in nearly all the simulations, and the years 1700–1850 CE confirms the differences deduced qualitatively from Fig. 3. Some models have a large positive growth trend over the pre-industrial period while some others have a much smaller one, with potentially a very large contribution of internal variability. The comparison between the late 20th century and the beginning of the millennium also reveals some clear differences between the simulations (Fig. 4d). For some of them, as the ones driven by the IPSL and MPI models, the minimum is clearly reached in the late 20th century while many glaciers were smaller during the period 1000–1150 CE in the simulations driven by CESM and GISS outputs. It is difficult to estimate from observations when glaciers were smaller than presently as the evidence may still be buried under the ice (Goehring et al., 2011; Luthi et al., 2014; Solomina et al., 2016). For the Alps, this might have occurred before 1000 CE or in the periods 1200–1280 and 1400–1550 CE, but there is currently no direct evidence that this was actually the case during the past millennium (Luthi et al., 2014).
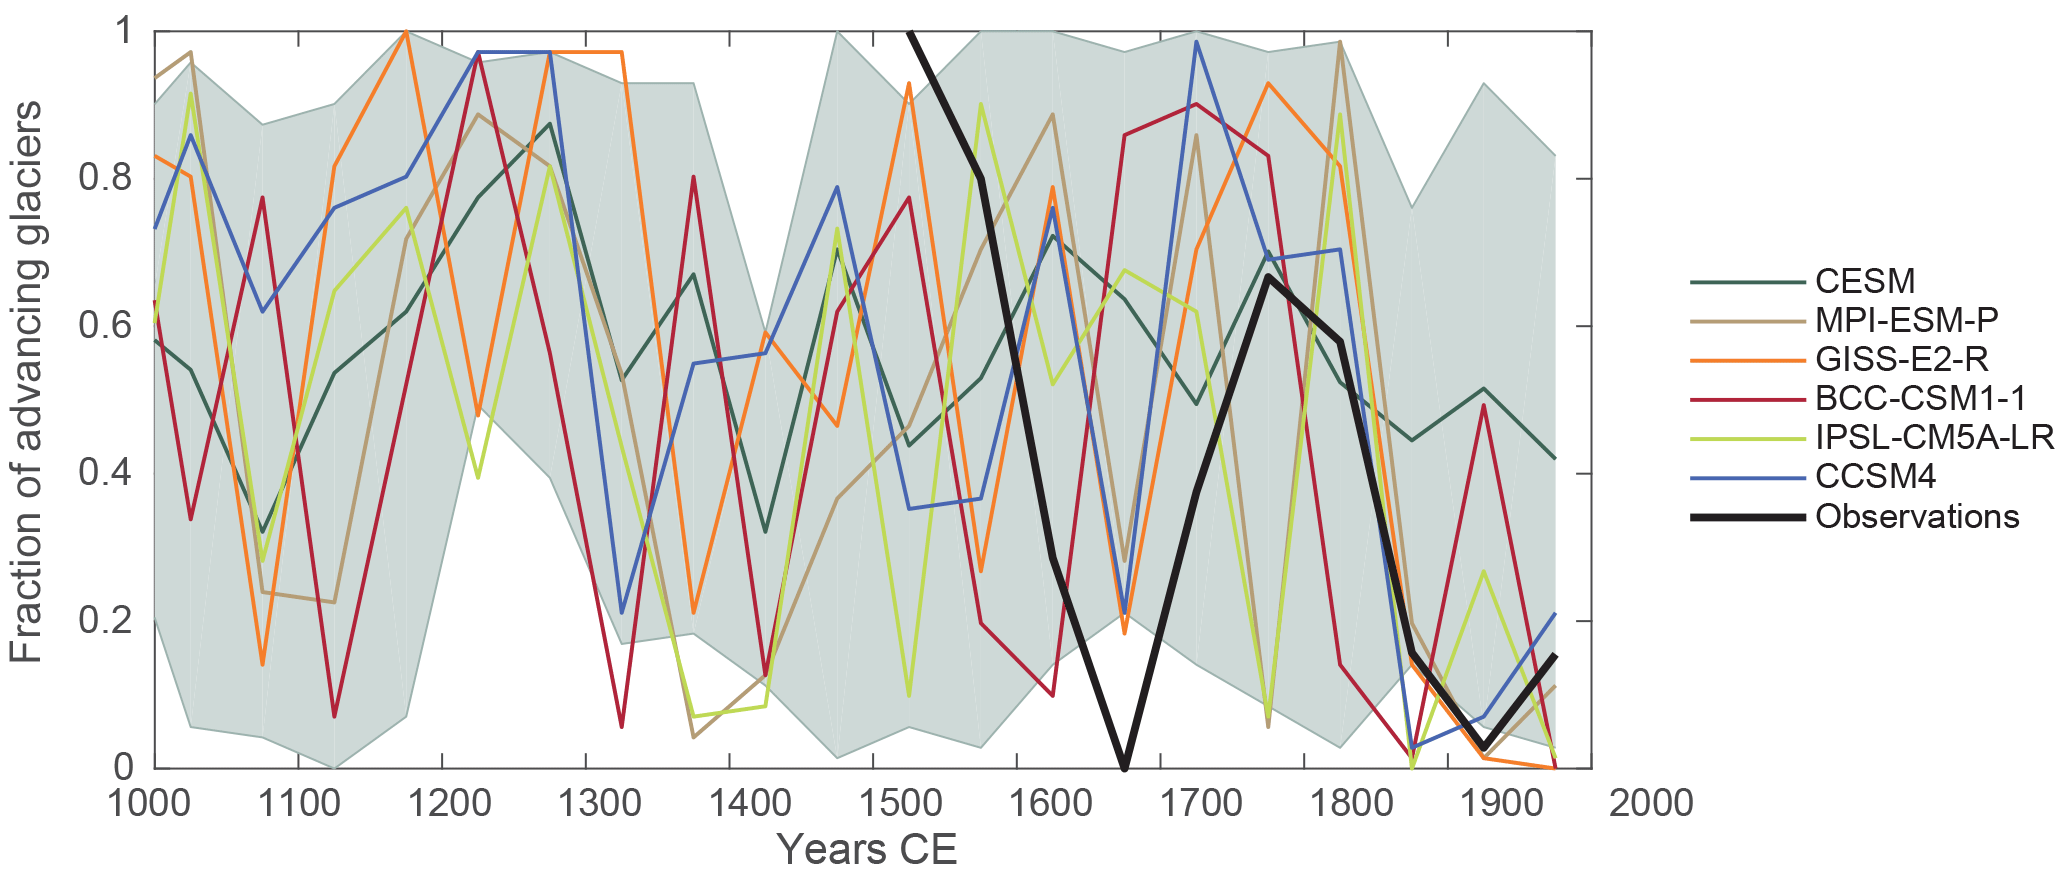
Another instructive diagnostic is the proportion of glaciers that are advancing over a specific period (Fig. 5), since it can potentially be compared to observations (e.g. Solomina et al., 2016). However, this diagnostic is by construction noisier than the glacier length itself and is strongly influenced by internal variability, with the simulations driven by CESM covering nearly the full range between 0 % and 100 % of advancing glaciers for several periods. Estimates derived from observations also display uncertainties. The evidence for a glacier advance, as derived for instance from a moraine position, may actually correspond to a time where the glacier is close to a maximum extent rather than still advancing (Grove, 2004; Solomina et al., 2016). The absence of evidence of advance may also only be due to the lack of a preserved signal in geomorphological features, not to the glacier changes themselves. The model–data comparison can thus only be qualitative and must be interpreted with caution.
As described in the synthesis of Solomina et al. (2016) for the Alps, many glaciers display a minimum extent around the 9th–11th century. This is followed by a first advance in the 12th century, a retreat at the beginning of the 13th century and a general advance in the late 13th century (Holzhauser et al., 2005; Luthi et al., 2014; Le Roy et al., 2015). This advance after the 11th century is in general agreement with our results except that the majority of models simulates an increase in glacier length for the beginning of the 13th century too, while the 12th century is generally characterized by a small number of advances. This would suggest a wrong timing of the glacier advances in models and would be consistent with the higher simulated European temperatures compared to the reconstruction of Luterbacher et al. (2016) around 1100 CE and the lower simulated values compared to the reconstructed ones around 1200 CE. Nevertheless, the variability in the simulated results is too large to obtain a clear answer from the diagnostics of glacier advances alone.
Subsequently, observational evidence indicates a retreat around 1400 CE before new advances in the late 15th century and the 16th century, their timing varying between regions (Holzhauser et al., 2005; Schimmelpfennig et al., 2014; Luthi et al., 2014; Le Roy et al., 2015; Solomina et al., 2016). The early 15th century is also a period with glacier retreats in models, preceding major advances in good agreement with observations. The variability between models is larger for the years 1500–1850, when the extent was close to its maximum, and no clear common signal can be deduced from the diagnostics of glacier advances in the simulations for this period.
The early 15th century corresponds to a minimum for glacier advances in many models (Fig. 5) and a relative minimum in glacier length (Fig. 3). Although the simulated temperatures are generally mild during this period, they are not high and, in particular, are generally lower than at the beginning of the millennium (Fig. 1). This clearly illustrates the impact of the long response timescales of glaciers. The simulated glacier retreats in the early 15th century appear to be partly due to the temperatures at that time but also to the recovery from the large advances in the 13th and 14th century.
The warming over the 20th century has a clear impact on glacier length, inducing a simulated retreat of nearly all the glaciers in agreement with observations, except in some experiments driven by CESM members that display a weak temperature increase over the Alps (Fig. 3 and Supplement Fig. S1). Nevertheless, the contemporaneous temperature does not appear to be the only variable driving the glacier length changes when comparing two 30-year period at the beginning and the end of the 20th century (Fig. 6a). The contribution of temperature is present, but the response time of the glacier as well as the influence of precipitation variability, for instance, can still obscure the link between temperature and glacier length for those relatively short periods.
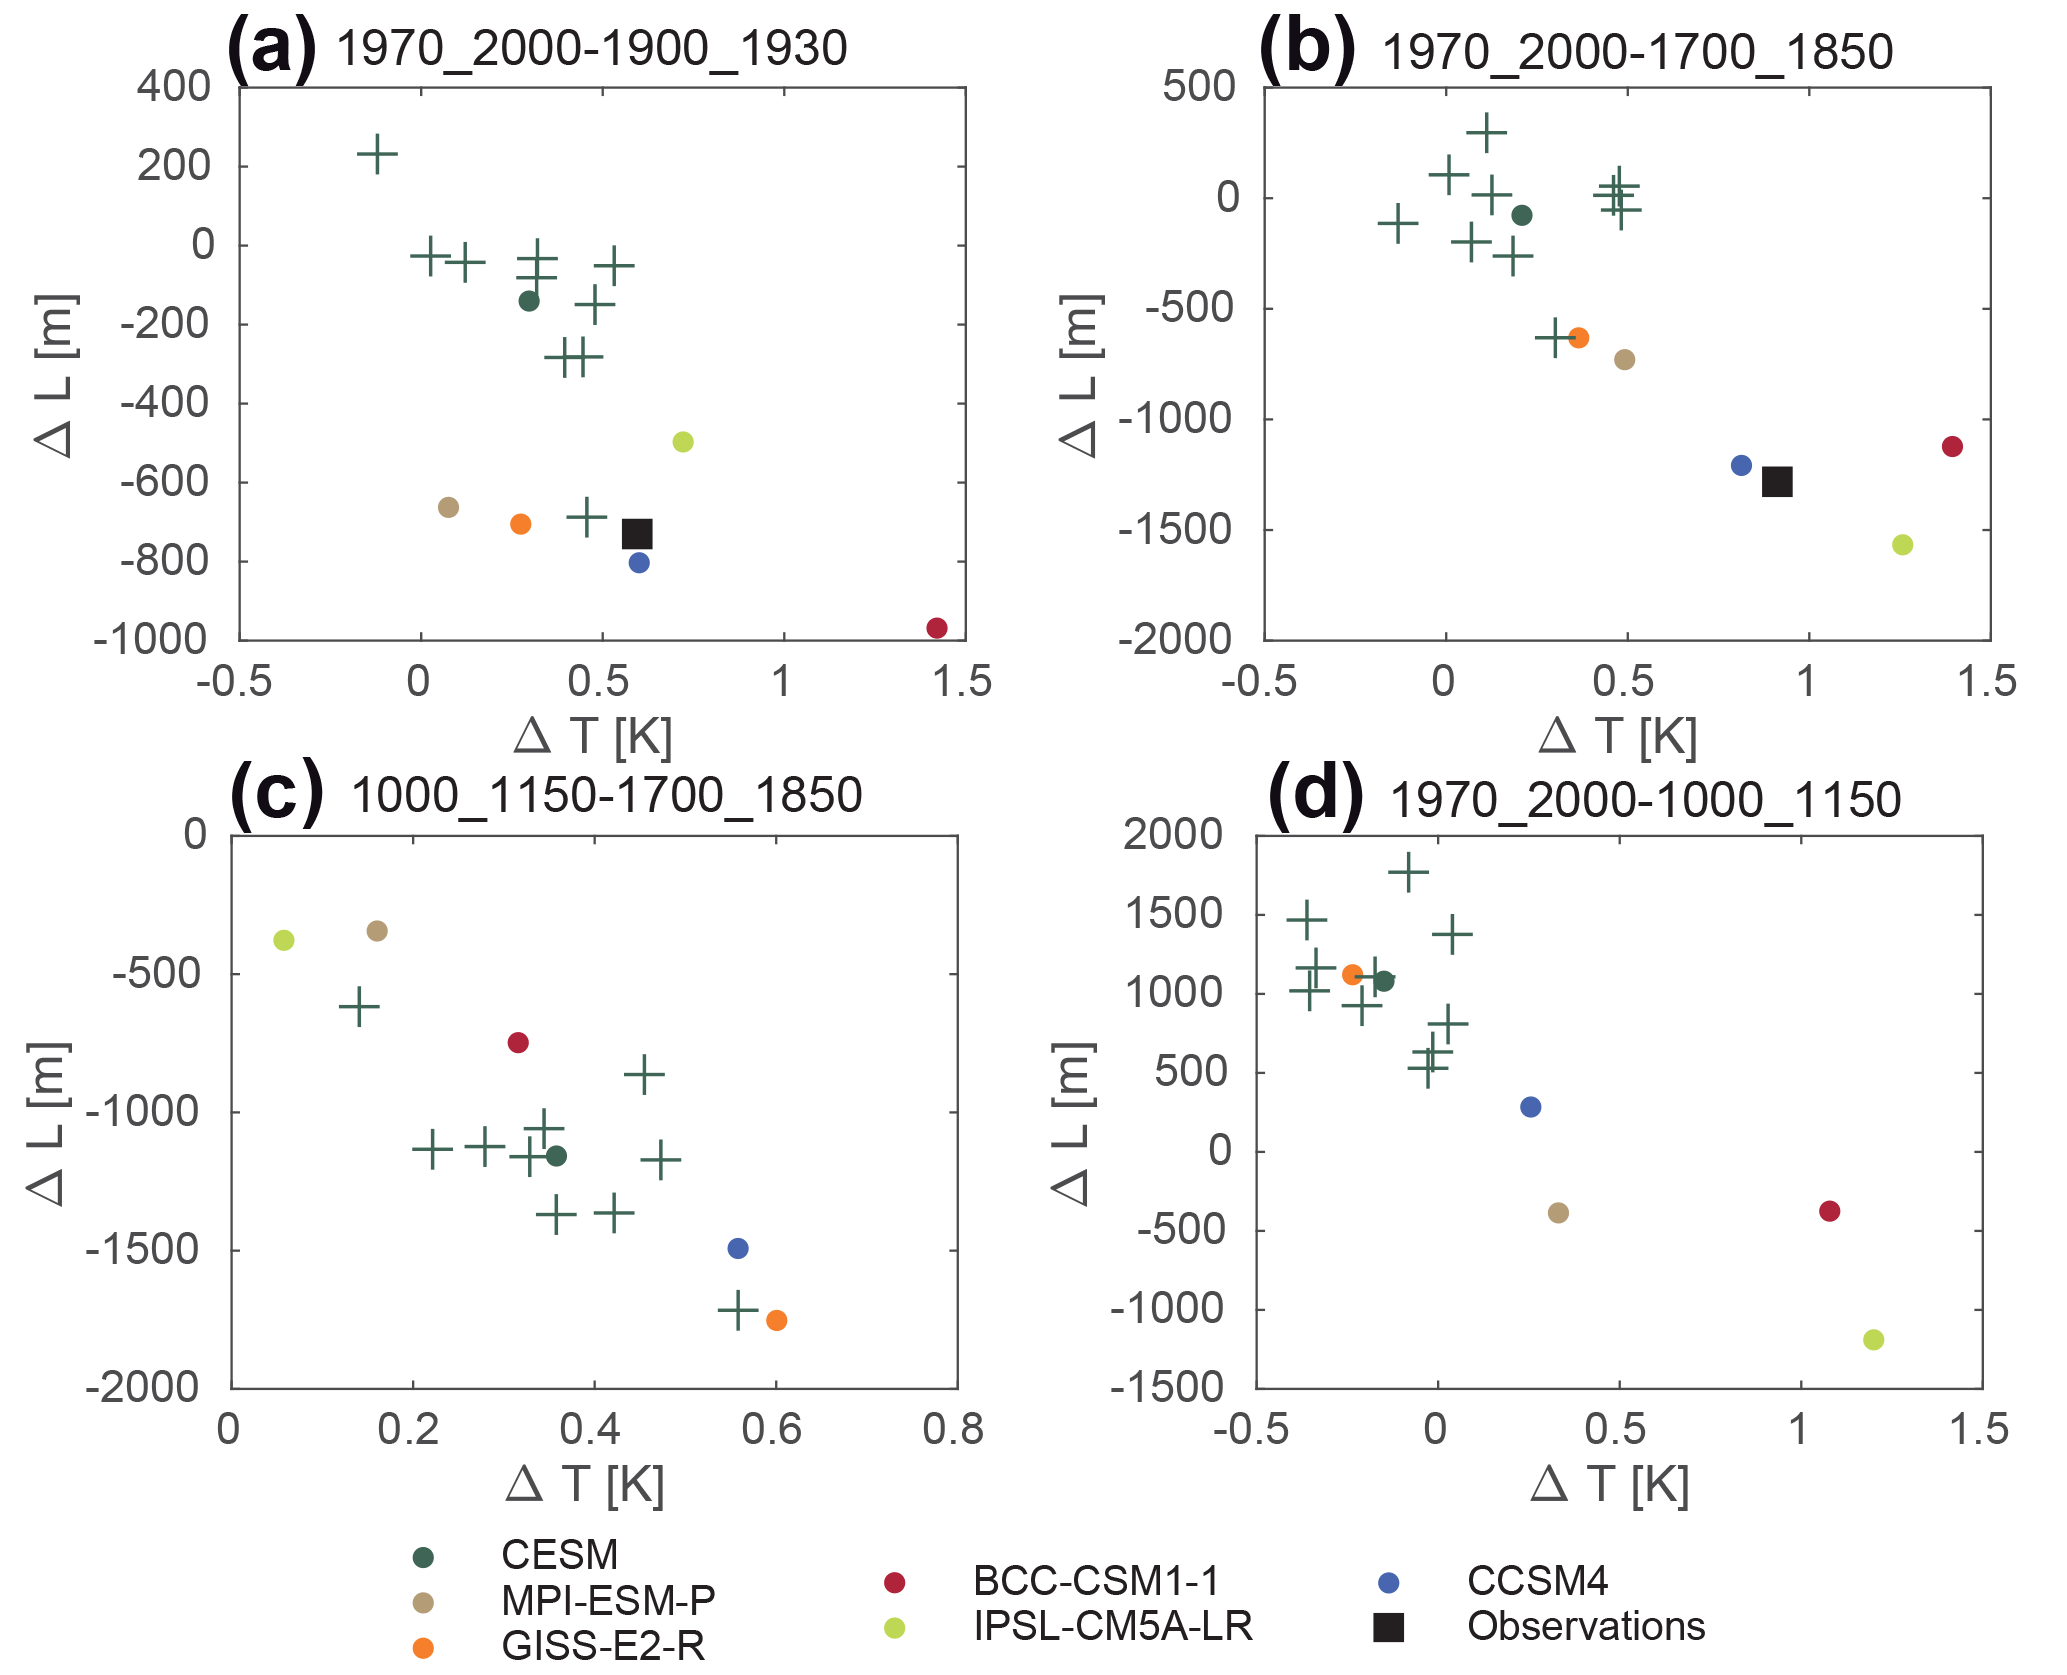
Figure 6Glacier length changes as a function of summer temperature changes in the Alps for the differences between (a) 1970–2000 and 1900–1930; (b) 1970–2000 and 1700–1850; (c) 1000–1150 and 1700–1850; and (d) 1970–2000 and 1000–1150. For (b), the average of model results is made only for the glaciers that have observations. The crosses represent the individual CESM ensemble members, the ensemble mean being represented by a dot of the same colour.
The association between summer temperature and glacier changes is more direct and linear when analysing length changes on longer timescales. The relative minimum in glacier length in the 12th century (Fig. 3) is clearly due to the warm simulated temperatures at that time (Fig. 1). The climate models that have the largest temperature changes over the pre-industrial period and between pre-industrial period and the 20th century are also the ones that lead to the larger changes in glacier length (Fig. 6b, c, d).
This confirms the dominant role of temperature fluctuations in glacier evolution in the Alps (Oerlemans, 2001; Huss et al., 2008; Steiner et al., 2008; Leclerq and Oerlemans, 2012; Zekollari et al., 2014). Furthermore, although some simulations display smaller or larger values compared to observations for each variable, the model ensemble agrees very well with observations for the ratio between temperature and glacier length changes between the pre-industrial period and the 20th century (Fig. 6b). This suggests that the glacier model has a reasonable temperature sensitivity. An alternative interpretation is to state that the link between reconstructed temperatures and glacier length observations is compatible with model results using the standard parameters of OGGM.
The parameter set and experimental design applied in the simulations described in Sect. 3 are identical to the ones of the standard version of the OGGM model (Maussion et al., 2018). In order to estimate how our results are sensitive to this choice, a series of sensitivity experiments has been performed, addressing uncertainties in OGGM representation of the glacier dynamics, the surface mass balance and the way climate model results are processed before using them to drive the glacier model.
In the first two experiments, the creep parameter has been multiplied and divided by a factor of 2 for all the glaciers, applying a value of 4.8×10⁻²⁴ and 1.2×10⁻²⁴ s−1 Pa−3. In the next two experiments, the climate sensitivity parameter μ* has been uniformly decreased and increased by 10 %. These experiments are not intended to correspond to a new calibration of these parameters but are used to provide a measure of the impact of a variation in their range of uncertainty (Marzeion et al., 2012; Maussion et al., 2018).
In the standard simulations, a very simple bias correction is applied to climate model results, ensuring that after the adjustment the climate models have the same mean over the reference period as the CRU data set used to calibrate OGGM climate sensitivity parameter (see Sect. 2). However, the variance and the magnitude of the response to a perturbation is likely different at the altitude of the glacier compared to the lower altitude corresponding to the land surface at the scale of the global climate model (Mountain Research Initiative EDW Working Group, 2015; Kotlarski et al., 2015). Consequently, we have scaled simulated temperatures in the final sensitivity experiment so that the variance for each month has the same value as for CRU data set. The temperatures have not been detrended before computing the variance and this thus includes a scaling of the warming over the 20th century as well as of the interannual variability, but the correction is not timescale dependent. This scaling takes into account not only the elevation dependence of the changes but also any bias in the simulated variance (Maraun and Widmann, 2018).
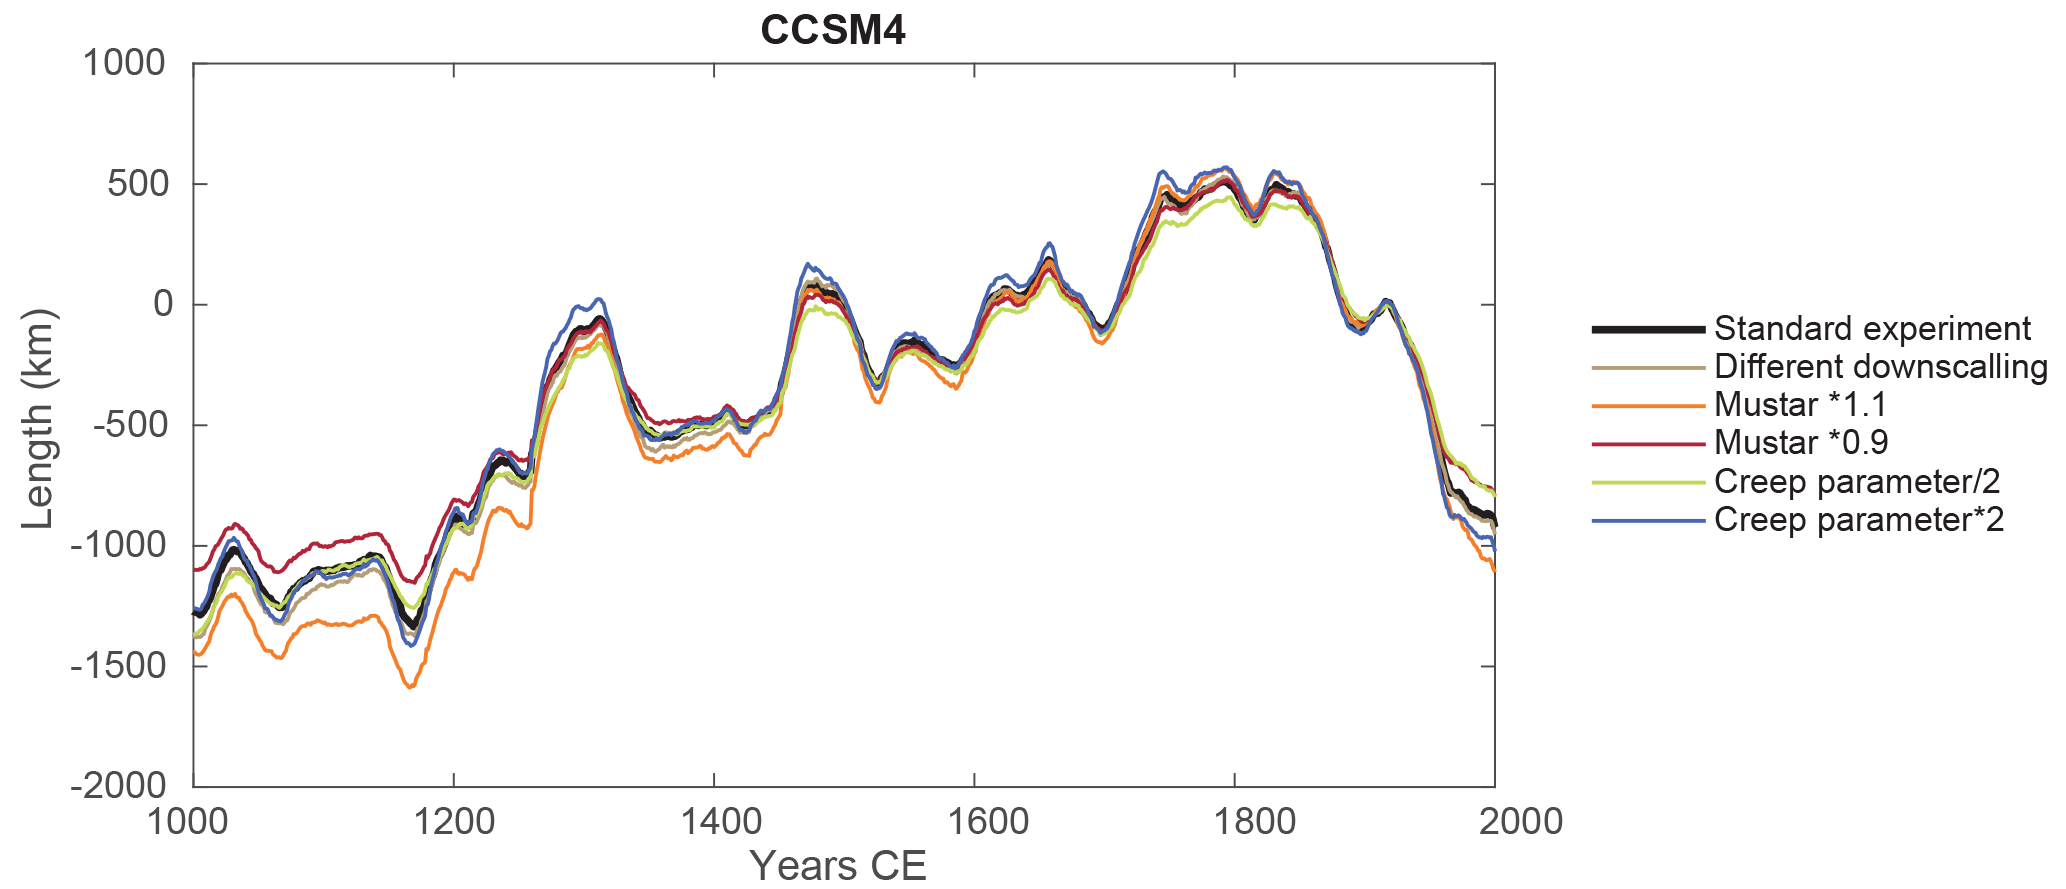
Figure 7Length changes averaged over the 71 glaciers for the standard and sensitivity experiments using CCSM4 results.
Those changes in parameters have a very large impact on glacier volume, in agreement with previous tests performed with OGGM (Maussion et al., 2018). The differences can reach up to a factor of 2 compared to the standard experiment. They also have a clear impact on the mean length of the glacier. However, when discarding the first 150 years of simulations (when the adjustment to the new parameters occurs), the changes in glacier length averaged over the 71 glaciers are very small. This is illustrated for CCSM4 in Fig. 7. Similar results have been obtained for the other climate models (not shown). In particular, the sensitivity to glacier model parameters and to the correction method applied to climate model results is much smaller than the contribution of internal variability (see Fig. 3), whose role as a dominant source of uncertainty in a model–data comparison is thus confirmed. This conclusion is reached for the Alps and for the selected climate models. Different results might be obtained for other regions or for other models displaying larger biases. Additionally, sensitivity experiments with larger perturbations of parameters would lead to larger differences with the standard experiment. Nevertheless, the small changes in the results of our sensitivity experiments indicate that the main conclusions obtained in Sect. 3 are not critically dependent on the choices made in the application of OGGM.
The simulations performed with OGGM driven by climate model results have shown that there is no inconsistency between the climate provided by the model ensemble and glacier length observations. Disagreements are found for individual glaciers, but this was expected as global models are not able to represent the small-scale processes that may rule some glacier changes. However, when analysing the 71 selected glaciers, there is no systematic bias in the timing or the amplitude of simulated glacier changes and the observed length variations are generally well within the range of simulated values. This agreement was achieved without any specific calibration of the glacier model and does not appear critically dependent on the choice of some model parameters.
This provides an additional positive evaluation of climate models and, by using a new type of data, confirms their ability to reproduce the dominant changes over the past millennium. The successful application of global climate models driving a global glacier model over the past millennium also reinforces the validity of this approach to study future changes on similar timescales.
Some studies have argued that the large melting of Alpine glaciers in the 19th century might be due to a modification of the ice albedo caused by the deposition of black carbon of anthropogenic origin (Painter et al., 2013). This hypothesis has recently been challenged (e.g. Luthi, 2014), in particular because no evidence of a significant deposition at the time of the retreat was found in an ice core collected in the Alps (Sigl et al., 2018). Although the simulated changes are underestimated here for some glaciers, this additional forcing does not seem to be required systematically to reproduce past glacier changes in models.
In addition to the overall compatibility of the ensemble of simulations with observations, the comparison between simulated results and estimates of past glacier length fluctuations may help identify some specific characteristics of individual climate model simulations. This comparison is complicated because of the large contribution of internal climate variability on glacier length fluctuations. Nevertheless, some diagnostics appear robust enough to assess the overall climate model skill in the region studied. In particular, some simulations underestimate the amplitude of the glacier changes between the 18th century and the end of the 20th century. This disagreement may have several origins, such as model biases in temperature or precipitation changes. However, an independent comparison between simulated and reconstructed temperatures suggests that these models have too weak a warming over the past 2 to 3 centuries, suggesting an important contribution from this variable in the glacier model behaviour.
Another robust characteristic of many simulations is the timing of the minimum glacier extent over the past millennium. For some climate models, this occurs clearly at the end of the simulation while for some other models the minimum extent takes place at the beginning of the millennium. Unfortunately, observations do not allow the determination of which behaviour is more realistic. Although there are not enough observations in the Alps to argue in favour of a systematic lower extent than today during some periods in the past millennium, the evidence is maybe still hidden below the ice.
More generally, our experiments have demonstrated the interest of driving a global glacier model by climate model outputs in order to have a direct comparison between simulated and observed glacier length. This allows a more quantitative evaluation of the models and a more precise interpretation of the records. For instance, the beginning of the 15th century is characterized by a general glacier retreat in simulations and reconstructions but without particularly high temperatures, illustrating that even though the link between summer temperature and glacier length is strong in the Alps, it is not always straightforward because of the long response time of glaciers. Our results thus open up the application of the same approach to other regions and the integration of glacier records with others in multi-proxy assessments of past climate reconstructions.
The code of OGGM (DOI: http://doi.org/10.5281/zenodo.1149701, Maussion et al., 2018) is freely available online (http://oggm.org/; last access: 11 January 2018). Simulated glacier lengths will be made available in a public repository (https://zenodo.org/record/1319334\#.W2go2Lg6-M; last access: 23 July 2018) (Goosse et al., 2018).
The supplement related to this article is available online at: https://doi.org/10.5194/cp-14-1119-2018-supplement.
The authors declare that they have no conflict of interest.
This work was supported by Fonds National de la Recherche Scientifique
(F.R.S.-FNRS-Belgium) in the framework of the project “Evaluating simulated
centennial climate variability over the past millennium using global glacier
modelling” (grant agreement PDR T.0028.18). Hugues Goosse is Research
Director within the F.R.S.-FNRS. We would like to thank Olga Solomina for
sharing results of the synthesis of glacier records she led and for her
suggestions. We acknowledge the World Climate Research Programme's Working
Group on Coupled Modelling, which is responsible for CMIP, and we thank the
climate modelling groups (listed in Table 1 of this paper) for producing and
making available their model output. For CMIP, the US Department of Energy's
Program for Climate Model Diagnosis and Intercomparison provides coordinating
support and led the development of software infrastructure in partnership
with the Global Organization for Earth System Science Portals.
Edited by: Ed Brook
Reviewed by: three
anonymous referees
Abram, N. J., McGregor, H. V., Tierney, J. E., Evans, M. N., McKay, N. P., Kaufman, D. S., and the PAGES 2k Consortium: Early onset of industrial-era warming across the oceans and continents, Nature, 536, 411–418, https://doi.org/10.1038/nature19082, 2016.
Allison, I. and Kruss, P.: Estimation of recent climate change in Irian Jaya by numerical modeling of its tropical glaciers, Arctic Alpine Res., 9, 49–60, 1977.
Barth A. M., Clark, P. U., Clark, J., Roe, G. H., Marcott, S. A., Marshall McCabe, A. , Caffee, M. W., He, F., Cuzzone, J. K., and Dunlop, P.: Persistent millennial-scale glacier fluctuations in Ireland between 24 ka and 10 ka, Geology, 46, 151–154, https://doi.org/10.1130/G39796.1, 2017.
Bliss, A., Hock, R., and Radić, V.: Global response of glacier runoff to twenty-first century climate change, J. Geophys. Res.-Earth Surf., 119, 717–730, https://doi.org/10.1002/2015MS000447, 2014.
Cuffey, K. and Paterson, W.: The Physics of Glaciers, 4th Edition, Academic Press, 2010.
Dee, S. Emile-Geay, J., Evans, M. N., Allam, A., Steig, E. J., and Thompson, D.M.: PRYSM: An open-source framework for proxy system modeling, with applications to oxygen-isotope systems, J. Adv. Model. Earth Syst., 7, 1220–1247, 2015.
Doughty, A. M., Mackintosh, A. N., Anderson, B. M., Dadic, R., Putnam, A. E., Barrell, D. J. A., Denton, G. H., Chinn, T. J. H., and Schaefer, J. M.: An exercise in glacier length modeling: Interannual climatic variability alone cannot explain Holocene glacier fluctuations in New Zealand, Earth Planet. Sc. Lett., 470, 48–53, https://doi.org/10.1016/j.epsl.2017.04.032, 2017.
Dufresne, J. L., Foujols, M., Denvil, S., Caubel, A., Marti, O., Aumont, O., Balkanski, Y., Bekki, S., Bellenger, H., Benshila, R., Bony, S., Bopp, L., Braconnot, P., Brockmann, P., Cadule, P., Cheruy, F., Codron, F., Cozic, A., Cugnet, D., de Noblet, N., Duvel, J. P., Ethé, C., Fairhead, L., Fichefet, T., Flavoni, S., Friedlingstein, P., Grandpeix, J. Y., Guez, L., Guilyardi, E., Hauglustaine, D., Hourdin, F., Idelkadi, A., Ghattas, J., Joussaume, S., Kageyama, M., Krinner, G., Labetoulle, S., Lahellec, A., Lefebvre, M. P., Lefevre, F., Levy, C., Li, Z. X., Lloyd, J., Lott, F., Madec, G., Mancip, M., Marchand, M., Masson, S., Meurdesoif, Y., Mignot, J., Musat, I., Parouty, S., Polcher, J., Rio, C., Schulz, M., Swingedouw, D., Szopa, S., Talandier, C., Terray, P., Viovy, N., and Vuichard, N.: Climate change projections using the IPSL-CM5 Earth System Model: From CMIP3 to CMIP5, Clim. Dyn., 40, 2123–2165, https://doi.org/10.1007/s00382-012-1636-1, 2013.
Evans, M. N., Tolwinski-Ward, S. E., Thompson, D. M., and Anchukaitis, K. J.: Applications of proxy system modeling in high resolution paleoclimatology, Quaternary Sci. Rev., 76, 16–28, https://doi.org/10.1016/j.quascirev.2013.05.024, 2013.
Farinotti, D., Brinkerhoff, D. J., Clarke, G. K. C., Füst, J. J., Frey, H., Gantayat, P., Gillet-Chaulet, F., Girard, C., Huss, M., Leclercq, P. W., Linsbauer, A., Machguth, H., Martin, C., Maussion, F., Morlighem, M., Mosbeux, C., Pandit, A., Portmann, A., Rabatel, A., Ramsankaran, R., Reerink, T. J., Sanchez, O., Stentoft, P. A., Singh Kumari, S., van Pelt, W. J. J., Anderson, B., Benham, T., Binder, D., Dowdeswell, J. A., Fischer, A., Helfricht, K., Kutuzov, S., Lavrentiev, I., McNabb, R., Gudmundsson, G. H., Li, H., and Andreassen, L. M.: How accurate are estimates of glacier ice thickness? Results from ITMIX, the Ice Thickness Models Intercomparison eXperiment, The Cryosphere, 11, 949–970, https://doi.org/10.5194/tc-11-949-2017, 2017.
Fernández-Donado, L., González-Rouco, J. F., Raible, C. C., Ammann, C. M., Barriopedro, D., García-Bustamante, E., Jungclaus, J. H., Lorenz, S. J., Luterbacher, J., Phipps, S. J., Servonnat, J., Swingedouw, D., Tett, S. F. B., Wagner, S., Yiou, P., and Zorita, E.: Large-scale temperature response to external forcing in simulations and reconstructions of the last millennium, Clim. Past, 9, 393–421, https://doi.org/10.5194/cp-9-393-2013, 2013.
Gent, P. R., Danabasoglu, G., Donner, L. J., Holland, M. M., Hunke, E. C., Jayne, S. R., Lawrence, D. M., Neale, R. B., Rasch, P. J., Vertenstein, M., Worley, P. H., Yang, Z.-L., and Zhang, M.: The Community Climate System Model Version 4, J. Clim., 24, 4973–4991, https://doi.org/10.1175/2011JCLI4083.1, 2011.
Giesen, R. H. and Oerlemans, J.: Calibration of a surface mass balance model for global-scale applications, The Cryosphere, 6, 1463–1481, https://doi.org/10.5194/tc-6-1463-2012, 2012.
Goehring, B. M., Schaefer, J. M., Schluechter, C., Lifton, N. A., Finkel R. C., Timothy Jull, A. J., Akçar, N., and Alley, R. B.: The Rhone Glacier was smaller than today for most of the Holocene, Geology 39, 679–682, https://doi.org/10.1130/G32145.1, 2011
Gonzalez-Rouco, J. F., Beltrami, H., Zorita, E., and von Storch, H.: Simulation and inversion of borehole temperature profiles in surrogate climates: spatial distribution and surface coupling, Geophys. Res. Lett., 33, L01703, https://doi.org/10.1029/2005GL024693, 2006.
Goosse, H., Renssen, H., Timmermann, A., and Bradley, R. S.: Internal and forced climate variability during the last millennium: a model-data comparison using ensemble simulations, Quaternary Sci. Rev., 24, 1345–1360, https://doi.org/10.1016/j.quascirev.2004.12.009, 2005.
Goosse, H., Crespin, E, Dubinkina, S., Loutre, M. F., Mann, M. E., Renssen, H., Sallaz-Damaz, Y., and Shindell, D.: The role of forcing and internal dynamics in explaining the “Medieval Climate Anomaly”, Clim. Dyn., 39, 2847–2866, https://doi.org/10.1007/s00382-012-1297-0, 2012a.
Goosse, H., Guiot, J., Mann, M. E., Dubinkina, S., and Sallaz-Damaz, Y.: The medieval climate anomaly in Europe: comparison of the summer and annual mean signals in two reconstructions and in simulations with data assimilation, Global Planet. Change, 84–85, 35–407, https://doi.org/10.1016/j.gloplacha.2011.07.002, 2012b.
Goosse, H., Barriat, P.-Y., Dalaiden, Q., Klein, F., Marzeion, B., Maussion, F., Pelucchi P., and Vlug, A.: Simulated length of 71 Alpine glaciers over the last millennium using OGGM [Data set], Zenodo, http://doi.org/10.5281/zenodo.1319334, 2018.
Gregory J. M., White, N. J., Church, J. A., Bierkens, M. F. P., Box, J. E., van den Broeke, M. R., Cogley, J. G., Fettweis, X., Hanna, E., Huybrechts, P., Konikow, L. F., Leclercq, P. W., Marzeion, B., Oerlemans, J., Tamisiea, M. E., Wada, Y., Wake, L. M., and van de Wale, R. S. W.: Twentieth-century global-mean sea level rise: Is the whole greater than the sum of the parts?, J. Clim., 26, 4476–4499, https://doi.org/10.1175/JCLI-D-12-00319.1, 2013.
Grove, J. M.: Little Ice Ages: Ancient and Modern, second ed., vol. 2, Routledge, London and New York, 2004.
Guiot, J., Corona, C., and ESCARSEL members: Growing season temperatures in Europe and climate forcings over the past 1400 years, PLOS One, 5, e9972, https://doi.org/10.1371/journal.pone.0009972.g001, 2010.
Harris, I., Jones, P., Osborn, T., and Lister, D.: Updated high-resolution grids of monthly climatic observations – the CRU TS3.10 Dataset, Int. J. Clim., 34, 623–642, https://doi.org/10.1002/joc.3711, 2014.
Hegerl, G., Luterbacher, J., González-Rouco, F., Tett, S. F. B., Crowley T., and Xoplaki, E.: Influence of human and natural forcing on European seasonal temperatures, Nat. Geos., 4, 99–103, https://doi.org/10.1038/NGEO1057, 2011.
Holzhauser, H., Magny, M., and Zumbühl, H. J.: Glacier and lake-level variations in west-central Europe over the last 3500 years, Holocene, 15, 789–801, 2005.
Huss, M. and Hock, R.: A new model for global glacier change and sea-level rise, Front. Earth Sci., 3, 1–22, https://doi.org/10.3389/feart.2015.00054, 2015.
Huss, M., Bauder, A., Funk, M., and Hock, R.: Determination of the seasonal mass balance of four Alpine glaciers since 1865, J. Geophys. Res., 113, F01015, https://doi.org/10.1029/2007JF000803, 2008.
Hutter, K.: The effect of longitudinal strain on the shear stress of an ice sheet: in defence of using streched coordinates, J. Glaciol., 27, 39–56, 1981.
Hutter, K.: Theoretical glaciology: material science of ice and the mechanics of glaciers and ice sheets, Springer, 483 pp., 1983.
Ivy-Ochs, S., Kerschner, H., Maisch, M., Christl, M., Kubik, P. W., and Schlüchter, C.: Latest Pleistocene and Holocene glacier variations in the European Alps, Quaternary Sci. Rev., 28, 2137–2149, 2009.
Jarvis, A., Reuter, H. I., Nelson, A., and Guevara, E.: Hole-filled seamless SRTM data V4, International Centre for Tropical Agriculture (CIAT), available at: http://srtm.csi.cgiar.org (last access: 15 November 2017), 2008.
Jòhannesson, T., Raymond, C. F., and Waddington, E. D.: A simple method for determining the response time of glaciers, in: Glacier Fluctuations and Climatic Change, 343–352, Kluwer Academic Publishers, 1989.
Jomelli, V., Khodri, M., Favier, V., Brunstein, D., Ledru, M. P., Wagnon, P., Blard, P. H., Sicart, J. E., Braucher, R., Grancher, D., Bourlès, D. L., Braconnot, P., and Vuille, M.: Irregular tropical glacier retreat over the Holocene epoch driven by progressive warming, Nature, 474, 196–200, https://doi.org/10.1038/nature10150, 2011.
Jones, P. D., Briffa, K. R., Osborn, T. J., Lough, J. M., van Ommen, T., Vinther, B. M., Luterbacher, J., Zwiers, F. W., Wahl, E., Schmidt, G., Ammann, C., Mann, M. E., Wanner, H., Buckley, B. M., Cobb, K., Esper, J., Goosse, H., Graham, N., Jansen, E., Kiefer, T., Kull, C., Mosley-Thompson, E., Overpeck, J. T., Schulz, M., Tudhope, S., Villalba, R., and Wolff, E.: High-resolution paleoclimatology of the last millennium: a review of the current status and future prospects, The Holocene, 19, 3–49, 2009.
Jungclaus, J. H., Lorenz, S. J., Timmreck, C., Reick, C. H., Brovkin, V., Six, K., Segschneider, J., Giorgetta, M. A., Crowley, T. J., Pongratz, J., Krivova, N. A., Vieira, L. E., Solanki, S. K., Klocke, D., Botzet, M., Esch, M., Gayler, V., Haak, H., Raddatz, T. J., Roeckner, E., Schnur, R., Widmann, H., Claussen, M., Stevens, B., and Marotzke, J.: Climate and carbon-cycle variability over the last millennium, Clim. Past, 6, 723–737, https://doi.org/10.5194/cp-6-723-2010, 2010.
Klein, F., Goosse, H., Graham, N. E., and Verschuren, D.: Comparison of simulated and reconstructed variations in East African hydroclimate over the last millennium, Clim. Past, 12, 1499–1518, https://doi.org/10.5194/cp-12-1499-2016, 2016.
Kotlarski, S., Lüthi, D., and Schär, C.: The elevation dependency of 21st century European climate change: an RCM ensemble perspective, Int. J. Climatol., 35, 3902–3920, https://doi.org/10.1002/joc.4254, 2015.
Landrum, L., Otto-Bliesner, B. L., Wahl, E. R., Conley, A., Lawrence, P. J., Rosenbloom, N., and Teng, H.: Last millennium climate and its variability in CCSM4, J. Climate., 26, 1085–1111, https://doi.org/10.1175/JCLI-D-11-00326.1, 2013.
Leclercq, P. W. and Oerlemans, J.: Global and hemispheric temperature reconstruction from glacier length fluctuations, Clim. Dynam., 38, 1065–1079, 2012.
Leclercq, P. W., Pitte, P., Giesen, R. H., Masiokas, M. H., and Oerlemans, J.: Modelling and climatic interpretation of the length fluctuations of Glaciar Frías (north Patagonian Andes, Argentina) 1639–2009 AD, Clim. Past, 8, 1385–1402, https://doi.org/10.5194/cp-8-1385-2012, 2012.
Leclercq, P. W., Oerlemans, J., Basagic, H. J., Bushueva, I., Cook, A. J., and Le Bris, R.: A data set of worldwide glacier length fluctuations, The Cryosphere, 8, 659–672, https://doi.org/10.5194/tc-8-659-2014, 2014.
Le Roy, M., Nicolussi, K., Deline, P., Astrade, L., Edouard, J.L., Miramont, C., and Arnaud, F.: Calendar-dated glacier variations in the western European Alps during the Neoglacial: the Mer de Glace record, Mont Blanc massif, Quaternary Sci. Rev., 108, 1–22, https://doi.org/10.1016/j.quascirev.2014.10.033, 2015.
Leysinger Vieli, G. J.-M. C. and Gudmundsson, G. H.: On estimating length fluctuations of glaciers caused by changes in climatic forcing, J. Geophys. Res., 109, F01007, https://doi.org/10.1029/2003JF000027, 2004.
Luterbacher, J., Dietrich, D., Xoplaki, E., Grosjean, M., and Wanner, H.: European seasonal and annual temperature variability, trends, and extremes xince 1500, Science, 5, 303, 1499–1503, https://doi.org/10.1126/science.1093877, 2004.
Luterbacher, J., Werner, J. P., Smerdon, J. E., Fernández-Donado, L., González-Rouco, F. J., Barriopedro, D., Ljungqvist F. C., Büntgen, U., Zorita, E., Wagner, S., Esper, J., McCarroll, D., Toreti, A., Frank, D., Jungclaus, J. H., Barriendos, M., Bertolin, C., Bothe, O., Brázdil, R., Camuffo, D., Dobrovolný, P., Gagen, M., García-Bustamante, E., Ge, Q., Gómez-Navarro, J. J., Guiot, J., Hao, Z., Hegerl G. C., Holmgren, K., Klimenko, V. V., Martín-Chivelet, J., Pfister, C., Roberts, N., Schindler, A., Schurer, A., Solomina, O., von Gunten, L., Wahl, E., Wanner, H., Wetter, O., Xoplaki, E., Yuan, N., Zanchettin, D., Zhang, H., and Zerefos, C.: European summer temperatures since Roman times, Environ. Res. Lett., 11, 024001, https://doi.org/10.1088/1748-9326/11/2/024001, 2016.
Lüthi, M. P.: Little Ice Age climate reconstruction from ensemble reanalysis of Alpine glacier fluctuations, The Cryosphere, 8, 639–650, https://doi.org/10.5194/tc-8-639-2014, 2014.
Mackintosh, A. N., Anderson, B. M., and Pierrehumbert, R. T.: Reconstructing climate from glaciers, An. Rev. Earth Planet, Sciences, 45, 649–680, https://doi.org/10.1146/annurev-earth-063016-020643, 2017.
Malone, A. G. O., Pierrehumbert, R. T., Lowell, T. V., Kelly, M. A., and Stroup, J. S.: Constraints on southern hemisphere tropical climate change during the Little Ice Age and Younger Dryas based on glacier modeling of the Quelccaya Ice Cap, Peru, Quaternary Sci. Rev., 125, 106–116, https://doi.org/10.1016/j.quascirev.2015.08.001, 2015.
Mann, M. E., Zhang, Z., Rutherford, S., Bradley, R. S., Hughes M. K., Shindell, D., Ammann, C., Faluvegi, G., and Ni, F.: Global signatures and dynamical origins of the Little Ice Age and Medieval Climate Anomaly, Science, 326, 1256–1260, https://doi.org/10.1126/science.1177303, 2009.
Maraun, D. and Widmann, M.: Statistical downscaling and bias correction for climate research, Cambridge University Press, 2018.
Marzeion, B., Jarosch, A. H., and Hofer, M.: Past and future sea-level change from the surface mass balance of glaciers, The Cryosphere, 6, 1295–1322, https://doi.org/10.5194/tc-6-1295-2012, 2012.
Marzeion, B., Kaser, G., Maussion, F., and Champollion, N.: Limited influence of climate change mitigation on short-term glacier mass loss, Nature Climate Change, 8, 305–308, https://doi.org/10.1038/s41558-018-0093-1, 2018.
Masiokas, M. H., Luckman, B., Villalba, R., Delgado, S., Skvarca, P., and Ripalta, A.: Little Ice Age fluctuations of small glaciers in the Monte Fitz Roy and Lago del Desierto areas, south Patagonian Andes, Argentina, Palaeogeogr. Palaeoclimatol. Palaeoecol., 281, 351–362, https://doi.org/10.1016/j.palaeo.2007.10.031, 2009.
Maussion, F., Butenko, A., Eis, J., Fourteau, K., Jarosch, A. H., Landmann, J., Oesterle, F., Recinos, B., Rothenpieler, T., Vlug, A., Wild, C. T., and Marzeion, B.: The Open Global Glacier Model (OGGM) v1.0, Geosci. Model Dev. Discuss., https://doi.org/10.5194/gmd-2018-9, in review, 2018.
Maussion, F., Rothenpieler, T., Recinos B., Vlug, A., Marzeion, B., Oesterle, F., Landmann, J., Jarosch, A. H., Eis J., Butenko, A., Fourneau K., and Wild C. T.: OGGM/oggm: v1.0.0 (Version v1.0.0), Zenodo, https://doi.org/10.5281/zenodo.1149701, 2018.
Moberg, A., Sundberg, R., Grudd, H., and Hind, A.: Statistical framework for evaluation of climate model simulations by use of climate proxy data from the last millennium – Part 3: Practical considerations, relaxed assumptions, and using tree-ring data to address the amplitude of solar forcing, Clim. Past, 11, 425–448, https://doi.org/10.5194/cp-11-425-2015, 2015.
Moran, A. P., Ivy Ochs, S., Christl, M., and Kerschner, H.: Exposure dating of a pronounced glacier advance at the onset of the late-Holocene, in the central Tyrolean Alps, The Holocene, 27, 1350–1358, 2017.
Mountain Research Initiative EDW Working Group: Pepin, N., Bradley, R. S., Diaz, H. F., Baraer, M., Caceres, E. B., Forsythe, N., Fowler, H., Greenwood, G., Hashmi, M. Z., Liu, X. D., Miller, J. R., Ning, L., Ohmura, A., Palazzi, E., Rangwala, I., Schöner, W., Severskiy, I., Shahgedanova, M., Wang, M. B., Williamson, S. N., and Yang, D. Q.: Elevation-dependent warming in mountain regions of the world, Nature Clim. Change, 5, 424–430, https://doi.org/10.1038/nclimate2563, 2015.
Neukom, R., Gergis, J., Karoly, D., Wanner, H., Curran, M., Elbert, J., González-Rouco, F., Linsley, B., Moy, A., Mundo, I., Raible, C., Steig, E., van Ommen, T., Vance, T., Villalba, R., Zinke, J., and Frank, D.: Inter-hemispheric temperature variability over the last millennium, Nat. Clim. Change, 4, 362–367, https://doi.org/10.1038/nclimate2174, 2014.
New, M., Lister, D., Hulme, M., and Makin, I.: A high-resolution data set of surface climate over global land areas, Climate Research, 21, 1–25, https://doi.org/10.3354/cr021001, 2002.
Nussbaumer, S. U. and Zumbühl, H. J.: The Little Ice Age history of the Glacier des Bossons (Mont Blanc massif, France): a new high-resolution glacier length curve based on historical documents, Clim. Change, 111, 301–334, https://doi.org/10.1007/s10584-011-0130-9, 2012.
Oerlemans, J.: Glaciers as indicators of a carbon dioxide warming, Nature, 320, 607–609, https://doi.org/10.1038/320607a0, 1986.
Oerlemans, J.: Holocene glacier fluctuations: is the current rate of retreat exceptional?, Ann. Glaciol., 31, 39–44, https://doi.org/10.3189/172756400781820246, 2000.
Oerlemans, J.: Glaciers and climate change. A. A. Balkema Publishers, 148 pp., 2001.
Oerlemans, J.: Extracting a climate signal from 169 Glacier records, Science, 308, 675–677, https://doi.org/10.1126/science.1107046, 2005.
Otto-Bliesner, B. L., Brady, E. C., Fasullo, J., Jahn, A., Landrum, L., Stevenson, S., Rosenbloom, N., Mai, A., and Strand, G.: Climate variability and change since 850 C.E. An ensemble approach with the Community Earth System Model (CESM), B. Am. Meteor. Soc., 97, 735–754, https://doi.org/10.1175/BAMS-D-14-00233.1, 2016.
PAGES 2k Consortium: Continental-scale temperature variability during the last two millennia, Nat. Geosci., 6, 339–346, https://doi.org/10.1038/ngeo1797, 2013.
PAGES2k Consortium: A global multiproxy database for temperature reconstructions of the Common Era, Scientific Data, 4, 170088, https://doi.org/10.1038/sdata.2017.88, 2017.
PAGES 2k-PMIP3 group: Continental-scale temperature variability in PMIP3 simulations and PAGES 2k regional temperature reconstructions over the past millennium, Clim. Past, 11, 1673–1699, https://doi.org/10.5194/cp-11-1673-2015, 2015.
Painter, T. H., Flanner, M. G., Kaser, G., Marzeion, B., VanCuren, R. A., and Abdalati, W.: End of the Little Ice Age in the Alps forced by industrial black carbon, P. Natl. Acad. Sci. USA, 110, 15216–15221, https://doi.org/10.1073/pnas.1302570110, 2013.
Phipps, S. J., McGregor, H. V., Gergis, J., Gallant, A. J., Neukom, R., Stevenson, S., and Van Ommen, T. D.: Paleoclimate data–model comparison and the role of climate forcings over the past 1500 years, J. Clim., 26, 6915–6936, https://doi.org/10.1175/JCLI-D-12-00108.1, 2013.
Purdie, H., Anderson, B., Chinn, T., Owens, I., Mackintosh, A., and Lawson, W.: Franz Josef and Fox Glaciers, New Zealand: Historic length records, Global Planet. Change, 121, 41–52, https://doi.org/10.1016/j.gloplacha.2014.06.008, 2014.
Raible, C. C., Casty, C., Luterbacher, J., Pauling, A., Esper, J., Frank, D. C., Büntgen, U., Roesch, A. C., Tschuck, P., Wild, M., Vidale, P.-L., Schär, C., and Wanner, H.: Climate variability – observations, reconstructions, and model simulations for the Atlantic-European and Alpine region from 1500–2100 AD, Clim. Change, 79, 9–29, https://doi.org/10.1007/s10584-006-9061-2, 2006.
RGI Consortium: Randolph Glacier Inventory – A dataset of global glacier outlines: Version 5.0: Technical Report, Global Land Ice Measurements from Space, Colorado, USA, Digital Media, https://doi.org/10.7265/N5-RGI-50, 2015.
Roe, G. H.: What do glaciers tell us about climate variability and climate change?, J. Glaciol., 57, 567–579, https://doi.org/10.3189/002214311796905640, 2011.
Roe, G. H. and O'Neal, M. A.: The response of glaciers to intrinsic climate variability: observations and models of late-Holocene variations in the Pacific Northwest, J. Glaciol., 55, 839–854, https://doi.org/10.3189/002214309790152438, 2009.
Roe, G. H., Baker, M. B., and Herla, F.: Centennial glacier retreat as categorical evidence of regional climate change, Nature Geosci., 10, 95–99, https://doi.org/10.1038/ngeo2863, 2017.
Sagredo, E. A., Lowell, T. V, Kelly, M. A., Rupper, S., Carlos Aravena, J., Ward, D. J., and Malone, A. G. O.: Equilibrium line altitudes along the Andes during the Last millennium: Paleoclimatic implications, The Holocene, 27, 1019–1033, https://doi.org/10.1177/0959683616678458, 2017.
Schimmelpfennig, I., Schaefera, J. M., Akçarc, N., Koffmana, T., Ivy-Ochse, S., Schwartz, R., Finkel, R. C., Zimmerman, S., and Schlüchter, C.: A chronology of Holocene and Little Ice Age glacier culminations of the Steingletscher, Central Alps, Switzerland, based on high-sensitivity beryllium-10 moraine dating, Earth Plan. Sc. Lett., 393, 220–230, 2014.
Schmidt, G. A., Jungclaus, J. H., Ammann, C. M., Bard, E., Braconnot, P., Crowley, T. J., Delaygue, G., Joos, F., Krivova, N. A., Muscheler, R., Otto-Bliesner, B. L., Pongratz, J., Shindell, D. T., Solanki, S. K., Steinhilber, F., and Vieira, L. E. A.: Climate forcing reconstructions for use in PMIP simulations of the last millennium (v1.0), Geosci. Model Dev., 4, 33–45, https://doi.org/10.5194/gmd-4-33-2011, 2011.
Schmidt, G. A., Jungclaus, J. H., Ammann, C. M., Bard, E., Braconnot, P., Crowley, T. J., Delaygue, G., Joos, F., Krivova, N. A., Muscheler, R., Otto-Bliesner, B. L., Pongratz, J., Shindell, D. T., Solanki, S. K., Steinhilber, F., and Vieira, L. E. A.: Climate forcing reconstructions for use in PMIP simulations of the Last Millennium (v1.1), Geosci. Model Dev., 5, 185–191, https://doi.org/10.5194/gmd-5-185-2012, 2012.
Schmidt, G. A., Kelley, M., Nazarenko, L., Ruedy, R., Russell, G. L., Aleinov, I., Bauer, M., Bauer, S. E., Bhat, M. K., Bleck, R., Canuto, V., Chen, Y., Cheng, Y., Clune, T. L., Genio, A. D., Fainchtein, R. D., Faluvegi, G., Hansen, J. E., Healy, R. J., Kiang, N. Y., Koch, D., Lacis, A., Legrande, A. N., Lerner, J., Lo, K. K., Matthews, E. E., Menon, S., Miller, R. L., Oinas, V., Oloso, A. O., Perlwitz, J. P., Puma, M. J., Putman,W. M., Rund, D., Romanou, A., Sato, M., Shindell, D. T., Sun, S., Syed, R. A., Tausnev, N., Tsigaridis, K., Unger, N., Voulgarakis, A., Yao, M.-S., and Zhang, J.: Configuration and assessment of the GISS ModelE2 contributions to the CMIP5 archive, J. Advan. in Mode. Earth Syst., 6, 141–184, https://doi.org/10.1002/2013MS000265, 2014.
Sigl, M., Abram, N. J., Gabrieli, J., Jenk, T. M., Osmont, D., and Schwikowski, M.: No role for industrial black carbon in forcing 19th century glacier retreat in the Alps, The Cryosphere Discuss., https://doi.org/10.5194/tc-2018-22, in review, 2018.
Slangen A. B. A., Adloff, F., Jevrejeva, S., Leclercq, P. W., Marzeion, B., Wada, Y., and Winkelmann, R.: A review of recent updates of sea-level projections at global and regional scales, Surv. Geophys., 38, 385–406, https://doi.org/10.1007/s10712-016-9374-2, 2016.
Solomina, O. N., Bradley, R. S., Jomelli, V., Geirsdottir, A., Kaufman, D. S., Kochf, J., McKay, N. P., Masiokas, M., Miller, G., Nesjei, A., Nicolussi, K., Owenl, L. A., Putnammn, A. E., Wanner, H., Wiles, Gr., and Yang, B.: Glacier fluctuations during the past 2000 years, Quaternary Sci. Rev., 149, 61–90, https://doi.org/10.1016/j.quascirev.2016.04.008, 2016.
Steiner, D., Walter, H. J., and Zumbühl, H. J.: The application of a non-linear back-propagation neural network to study the mass balance of Grosse Aletschgletscher, Switzerland, J. Glaciol., 51, 313–323, 2005.
Steiner, D., Pauling, A., Nussbaumer, S. U., Nesje, A., Luterbacher, J., Wanner, H., and Zumbühl, H. J.: Sensitivity of European glaciers to precipitation and temperature – two case studies, Clim. Change, 90, 413–441, https://doi.org/10.1007/s10584-008-9393-1, 2008.
Stevens, B., Giorgetta, M., Esch, M., Mauritsen, T., Crueger, T., Rast, S., Salzmann, M., Schmidt, H., Bader, J., Block, K., Brokopf, R., Fast, I., Kinne, S., Kornblueh, L., Lohmann, U., Pincus, R., Reichler, T., and Roeckner, E.: The atmospheric component of the MPI-M earth system model: ECHAM6, J. Adv. Model. Earth Syst., 5, 1–27, https://doi.org/10.1002/jame.20015, 2013.
Taylor, K. E., Stouffer, R. J., and Meehl, G. A.: An Overview of CMIP5 and the Experiment Design, B. Am. Meteorol. Soc., 93, 485–498, https://doi.org/10.1175/BAMS-D-11-00094.1, 2012.
Vincent, C., Le Meur, E., Six, D., and Funk, M.: Solving the paradox of the end of the Little Ice Age in the Alps, Geophys. Res. Lett., 32, 1–4, https://doi.org/10.1029/2005GL022552, 2005.
WGMS: Fluctuations of Glaciers Database, World Glacier Monitoring Service, Zurich, Switzerland, https://doi.org/10.5904/wgms-fog-2017-10, 2017.
Weber, S. L. and Oerlemans, J.: Holocene glacier variability: three case studies using an intermediate-complexity climate model, The Holocene, 13, 353–363, 2003.
Wiles, G. C., Lawson, D. L., Lyon, E., and Wiesenberg, N.: Tree-ring dates on two pre-Little Ice Age advances in Glacier Bay National Park and Preserve, Quat. Res., 76, 190–195, https://doi.org/10.1016/j.yqres.2011.05.005, 2011.
Wu, T., Song, L., Li, W., Wang, Z., Zhang, H., Xin, X., Zhang, Y., Zhang, L., Li, J., Wu, F., Liu, Y., Zhang, F., Shi, X., Chu, M., Zhang, J., Fang, Y., Wang, F., Lu, Y., Liu, X., Wei, M., Liu, Q., Zhou, W., Dong, M., Zhao, Q., Ji, J., Li, L., and Zhou, M.: An overview of BCC climate system model development and application for climate change studies, J. Met. Res., 28, 34–56, https://doi.org/10.1007/s13351-014-3041-7, 2014.
Zecchetto, S., Serandrei-Barbero, R., and Donnici, S.: Temperature reconstruction from the length fluctuations of small glaciers in the eastern Alps (northeastern Italy), Clim. Dyn., 49, 363–374, https://doi.org/10.1007/s00382-016-3347-5, 2017.
Zekollari, H., Fürst, J. J., and Huybrechts, P.: Modelling the evolution of Vadret da Morteratsch, Switzerland, since the Little Ice Age and into the future, J. Glaciol., 60, 1155–1159, https://doi.org/10.3189/2014JoG14J053, 2014.
Zemp, M., Hoelzle, M., and Haeberli, W.: Six decades of glacier mass-balance observations: a review of the worldwide monitoring network, Ann. Glaciol., 50, 101–111, https://doi.org/10.3189/172756409787769591, 2009.
Zemp, M., Frey, H., Gärtner-Roer, I., Nussbaumer, S.U., Hoelzle, M., Paul, F., Haeberli, W., Denzinger, F., Ahlstrøm, A. P., Anderson, B., Bajracharya, S., Baroni, C., Braun, L. N., Cáceres, B. E., Casassa, G., Cobos, G., Dávila, L. R., Delgado Granados, H., Demuth, M. N., Espizua, L., Fischer, A., Fujita, K., Gadek, B., Ghazanfar, A., Hagen, J. O., Holmlund, P., Karimi, N., Li, Z., Pelto, M., Pitte, P., Popovnin, V. V., Portocarrero, C. A., Prinz, R., Sangewar, C. V., Severskiy, I., Sigurđsson, O., Soruco, A., Usubaliev, R., and Vincent, C.: Historically unprecedented global glacier decline in the early 21st century, J. Glaciol. 61, 745–762, https://doi.org/10.3189/2015JoG15J017, 2015.
Zumbühl, H. J. and Nussbaumer, S.: Little ice age glacier history of the central and western Alps from pictorial documents, Cuadernos de Investigacíon Geográfica, 44, 115–136, https://doi.org/10.18172/cig.3363, 2018.