the Creative Commons Attribution 4.0 License.
the Creative Commons Attribution 4.0 License.
 | 10 Aug 2018
Mid-Cretaceous paleoenvironmental changes in the western Tethys
Elisabetta Erba
We present a continuous record of surface water temperature and fertility variations through the latest Barremian–Cenomanian interval (ca. 27 Myr) based on calcareous nannofossil abundances from the western Tethys. The nannofossil temperature index, calibrated with TEX86 sea surface temperatures, suggests that warmest (34–36 ∘C) conditions were reached during oceanic anoxic event (OAE) 1a onset, the Aptian–Albian boundary interval hyperthermals (113, Kilian level and Urbino level OAE 1b) and during a ca. 4 Myr long phase in the middle Albian. Coolest temperatures (29 ∘C) correspond instead to the late Aptian. Generally warm conditions characterized the Albian followed by a progressive cooling trend that started in the latest Albian (at the Marne a Fucoidi–Scaglia Bianca Formation transition). Temperate conditions occurred in the Cenomanian with frequent short-term variations highlighted by abundance peaks of the cold-water nannofossil species E. floralis and R. parvidentatum. Mid-Cretaceous surface water fertility was rather fluctuating and mostly independent from climatic conditions as well as from black shales intervals. Intense warming and fertility spikes were systematically associated only with black shales of OAE 1a and of the Aptian–Albian boundary hyperthermals. The Albian–Cenomanian rhythmic black shales are, in fact, associated with varying long-term climatic and fertility conditions. The similarity of western Tethys climatic and fertility fluctuations during OAE 1a, OAE 1b, the middle Albian and OAE 1d with nannofossil-based records from other basins indicated that these paleoenvironmental conditions were affecting the oceans at supra-regional to global scale.


The mid-Cretaceous was generally characterized by a warm climate with prevailing super-greenhouse conditions, weak latitudinal temperature gradients and the absence of ice sheets (e.g., Clarke and Jenkyns 1999; Föllmi, 2012; Friedrich et al., 2012; Bodin et al., 2015; O'Brien et al., 2017 and reference therein). Compilation of available sea surface temperatures (SSTs) based on δ18O and TEX86 recalibrated by O'Brien et al. (2017) suggests SSTs between 25 and 40 ∘C through the Aptian–Turonian interval at low latitudinal sites with maximum temperatures reached during the latest Cenomanian–Turonian “thermal maximum”. However, the studies performed over the last decades have demonstrated that the mid-Cretaceous was not continuously characterized by greenhouse conditions since cooling interludes were identified (e.g., Kemper, 1987; Hochuli et al., 1999; Price, 1999; Herrle and Mutterlose, 2003; Mutterlose et al., 2009; McAnena et al., 2013; Millán et al., 2014; Bottini et al., 2015). Moreover, the ocean–atmosphere system experienced phases of transient but sometimes prolonged paleoenvironmental perturbation in relation to widespread ocean anoxia, known as oceanic anoxic events (OAEs), which included the early Aptian OAE 1a, the early Albian OAE 1b, the latest Albian OAE 1d and the latest Cenomanian OAE 2 (see Weissert and Erba 2004 and Jenkyns, 2010, for a review). The majority of paleoenvironmental studies focused on OAEs and little is known about the intervals between these extreme events. This implies that, despite SST compilations (e.g., Clarke and Jenkyns, 1999; Friedrich et al., 2012; O'Brien et al., 2017), a continuous long-term reconstruction of paleoecological and paleoclimatic conditions over the Aptian–early Turonian interval is not available.
Important information regarding paleoenvironmental conditions can be gathered from nannofossils since calcareous nannoplankton is extremely sensitive to changes in surface water chemical and physical conditions. Specifically, decades of studies performed on calcareous nannofossils improved the knowledge about the paleoecology affinity of some species (e.g., Roth and Krumbach, 1986; Bralower, 1988; Premoli Silva et al., 1989a, b; Watkins, 1989; Coccioni et al., 1992; Erba et al., 1992; Erba, 1994; Herrle and Mutterlose, 2003; Herrle et al., 2003a; Tiraboschi et al., 2009), which were also used to calculate temperature and nutrient indices (e.g., Herrle et al., 2003a, b; Bornemann et al., 2005; Watkins et al., 2005; Browning and Watkins 2008; Tiraboschi et al., 2009; Pauly et al., 2012; Mutterlose and Bottini, 2013; Bottini et al., 2015; Kanungo et al., 2018) over specific intervals of the Cretaceous.
The sedimentary successions of the Umbria–Marche basin are ideal for long-term studies of paleoenvironmental conditions since they represent continuous pelagic records through the mid-Cretaceous in the Tethys Ocean. The Aptian–Albian interval corresponds to the Marne a Fucoidi Formation characterized by varicolored marlstones and marly limestones with black shales deposited in the early Aptian (Selli level OAE 1a), late Aptian “113 level”, “Kilian level” at the Aptian–Albian boundary and early Albian (Urbino level OAE 1b) (e.g., Coccioni et al., 1987, 1989; Erba, 1988, 1992a; Erba et al., 1989). Over the middle–late Albian, the Umbria–Marche basin was characterized by the deposition of rhythmic black shale (Herbert and Fischer, 1986; Premoli Silva et al., 1989b; Erba, 1992a; Galeotti et al., 2003; Tiraboschi et al., 2009). The sedimentation changed in the late Albian as represented by the Scaglia Bianca Formation consisting of whitish pelagic limestones with chert nodules, bands and radiolarian layers. The Scaglia Bianca Formation includes (i) the Pialli level (Coccioni, 2001; Gambacorta et al., 2015), which is the sedimentary expression of OAE 1d, (ii) rhythmic black shale and chert layers correlating with the mid-Cenomanian event I (MCE I) (Coccioni and Galeotti, 2003; Gambacorta et al., 2015), and (iii) a ∼1 m thick interval of black shales and radiolarian-rich sands representing the Bonarelli level (Bonarelli, 1891), which is the regional sedimentary expression of the latest Cenomanian OAE 2.
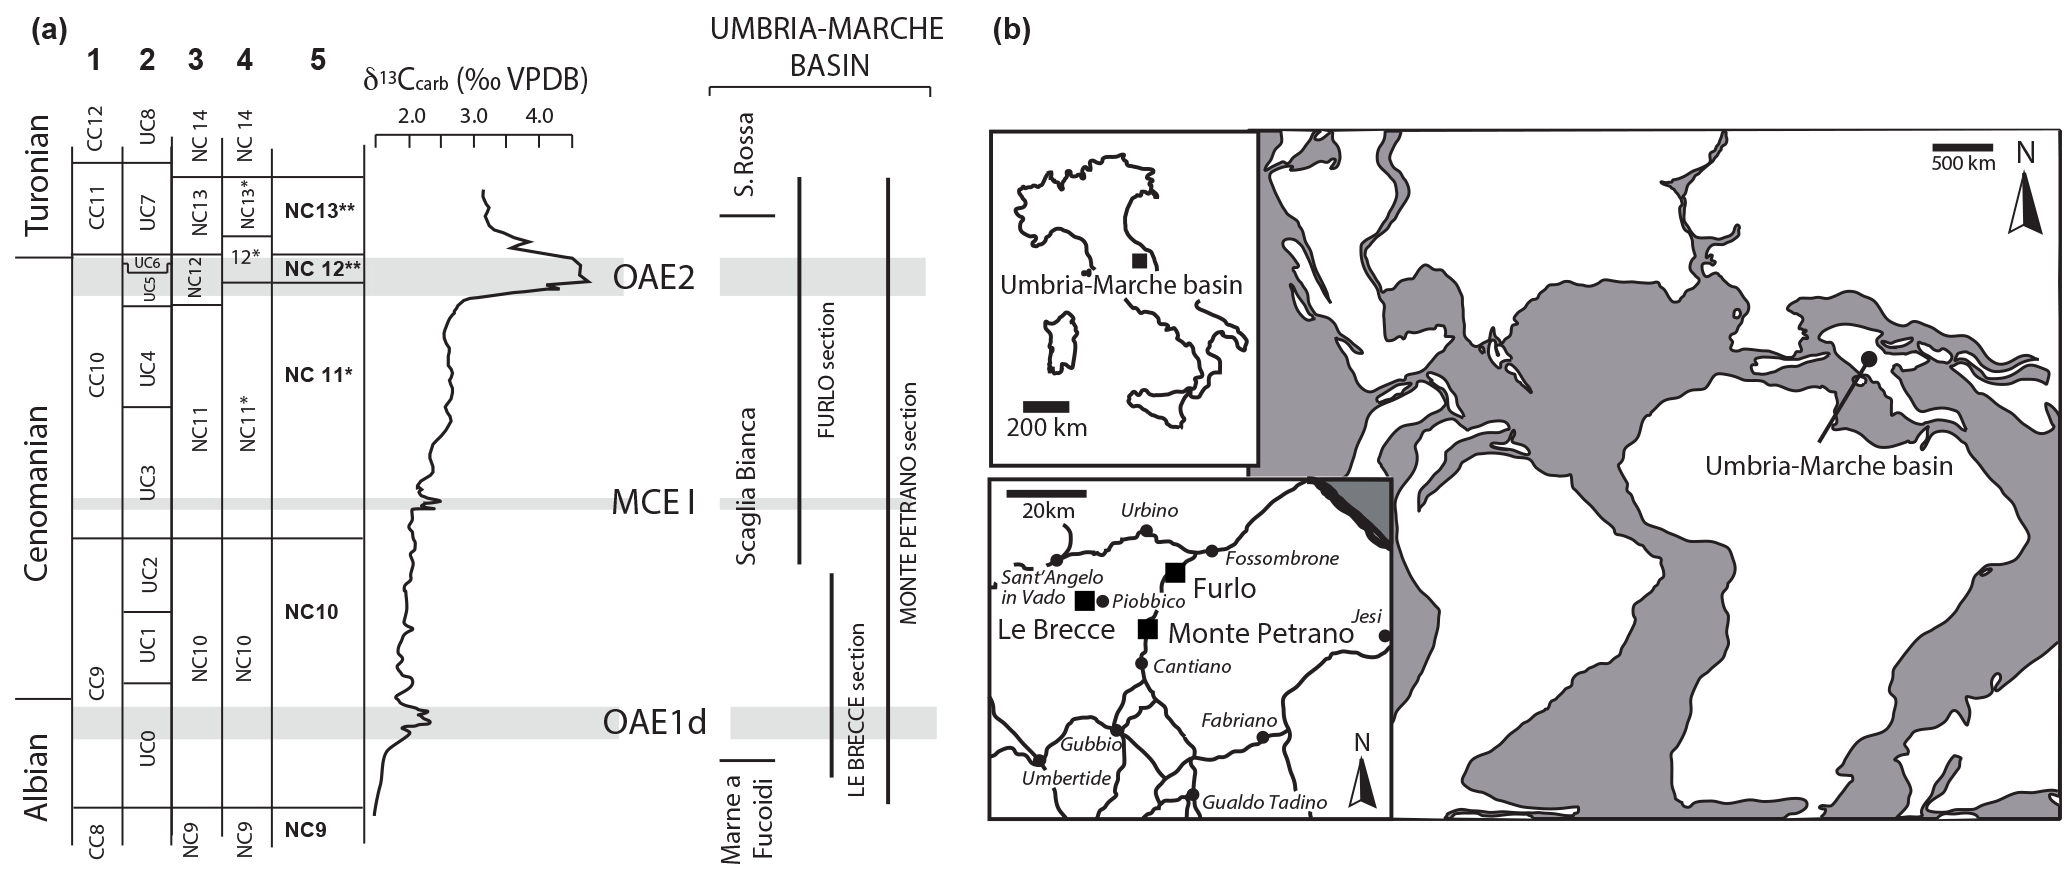
Figure 1(a) Stratigraphic ranges of the studied sections plotted against nannofossil biostratigraphy and chemostratigraphy of the late Albian–early Turonian time interval modified after Gambacorta et al. (2015). Nannofossil zones are after the following. 1: Sissingh (1977), 2: Burnett (1998), 3: Roth (1978), 4: Bralower et al. (1995), 5: Tsikos et al. (2004), Gambacorta et al. (2015). FO: first occurrence, LO: last occurrence. (b) Present-day and paleogeographic location of the studied sections modified after Gambacorta et al. (2015).
Here, we present new quantitative nannofossil data for the western Tethys Ocean (Umbria–Marche basin, Italy) used to derive surface water temperature and fertility during the late Albian–early Turonian. The new dataset is integrated with the nannofossil data previously collected from the same area for the latest Barremian–late Albian time interval (Tiraboschi et al., 2009; Bottini et al., 2015) to gain a long-term compilation of temperature and fertility variations at low latitudes through the mid-Cretaceous.
The questions we intend to answer are the following: (1) how did the climate and surface water fertility evolve in the western Tethys during the mid-Cretaceous? (2) Were temperature and fertility variations connected and to what degree? (3) How does the nannofossil temperature index correlate with other independent proxies of paleotemperature? (4) Are there any limitations in using calcareous nannofossils as paleoenvironmental tracers? (5) Is there a systematic correlation between black shales and high or low fertility and/or temperature?
2.1 Studied sites
In this work we investigated three nearby sections of the Umbria–Marche basin (Fig. 1): (1) the Monte Petrano section, spanning the pre-OAE 1d to the early Turonian interval, (2) Le Brecce, covering the OAE 1d, and (3) the Furlo sections through the late Cenomanian–early Turonian interval. The sections were selected to cover coeval intervals in order to discriminate any effect of selective diagenesis from primary paleoecological signals.
The studied sequence comprises the Scaglia Bianca Formation that lies above the Marne a Fucoidi Formation (lower Aptian–upper Albian) and is followed by the Scaglia Rossa Formation (lower Turonian–middle Eocene). Four members were distinguished within the Scaglia Bianca and described by Coccioni and Galeotti (2003).
The Furlo section, 30 m thick, is located in an abandoned quarry (Beaudoin et al., 1996, Mitchell et al., 2008, Lanci et al., 2010; Gambacorta et al., 2015) in the Furlo Gorge area, 25 km southeast of Urbino (Fig. 1). The section includes the MCE I and OAE 2. The Monte Petrano section covers 80.5 m and is located along a dirt road not far from the village of Moria (Schwarzacher, 1994; Giorgioni et al., 2012; Gambacorta et al., 2014; Fig. 1); it includes the OAE 1d, MCE I and OAE 2. The Le Brecce section, 20 m thick, is located 3 km west of the village of Piobbico at the km 34 point on the state road 257-Apecchiese, close to the Piobbico drill site (Tiraboschi et al., 2009; Gambacorta et al., 2015; Fig. 1). The section covers the interval encompassing OAE 1d, and a fault is present above the OAE 1d interval at ca. 16.5 m (Gabriele Gambacorta, personal communication, 2018).
The stratigraphic framework for the investigated sections is based on integrated lithostratigraphy and carbon-isotope stratigraphy calibrated with calcareous nannofossil biostratigraphy presented in Gambacorta et al. (2015). Three positive excursions in the δ13C record identify the OAE 1d, MCE I and OAE 2. Black shale layers of the Pialli level (at Le Brecce and Monte Petrano) are restricted to the lower part of the OAE 1d carbon-isotope excursion. The MCE I (at Monte Petrano and Furlo) coincides with a lithological shift to organic-rich black shales and black chert bands alternating with whitish limestones. The δ13C positive anomaly of OAE 2 (at Monte Petrano and Furlo) is associated with the organic-rich and carbonate-lean Bonarelli level, but only the first part of the OAE 2 carbon-isotope excursion is preserved since a hiatus at the top of the Bonarelli level elides most of the “plateau”, the “c” peak and the first part of the decrease. The interval elided corresponds to ca. 340–490 and ∼320–470 kyr at Monte Petrano and Furlo, respectively (Gambacorta et al., 2015).
2.2 Calcareous nannofossil relative abundance
Calcareous nannofossil assemblages were quantitatively investigated under polarizing light microscope at 1250X magnification in smear slides prepared using standard techniques, without centrifuging or cleaning in order to retain the original sedimentary composition. A small quantity of rock was powdered in a mortar with bidistillate water and mounted on a glass slide with Norland optical adhesive. A total of 77 smear slides for the Le Brecce section (sampled each 20 cm), 356 smear slides for the Furlo section (sampling rate from 0 to 5.8 m = 20 cm; sampling rate from 6 to 30 m = ca. 10 cm) and 171 smear slides for the Monte Petrano (sampled each 50 cm) were investigated. At least 300 nannofossil specimens were counted in each sample and percentages of single taxa were calculated relative to the total nannoflora. The total nannofossil abundance, reported in Figs. 2, 3 and 4, is the average number of nannofossils found in one field of view.
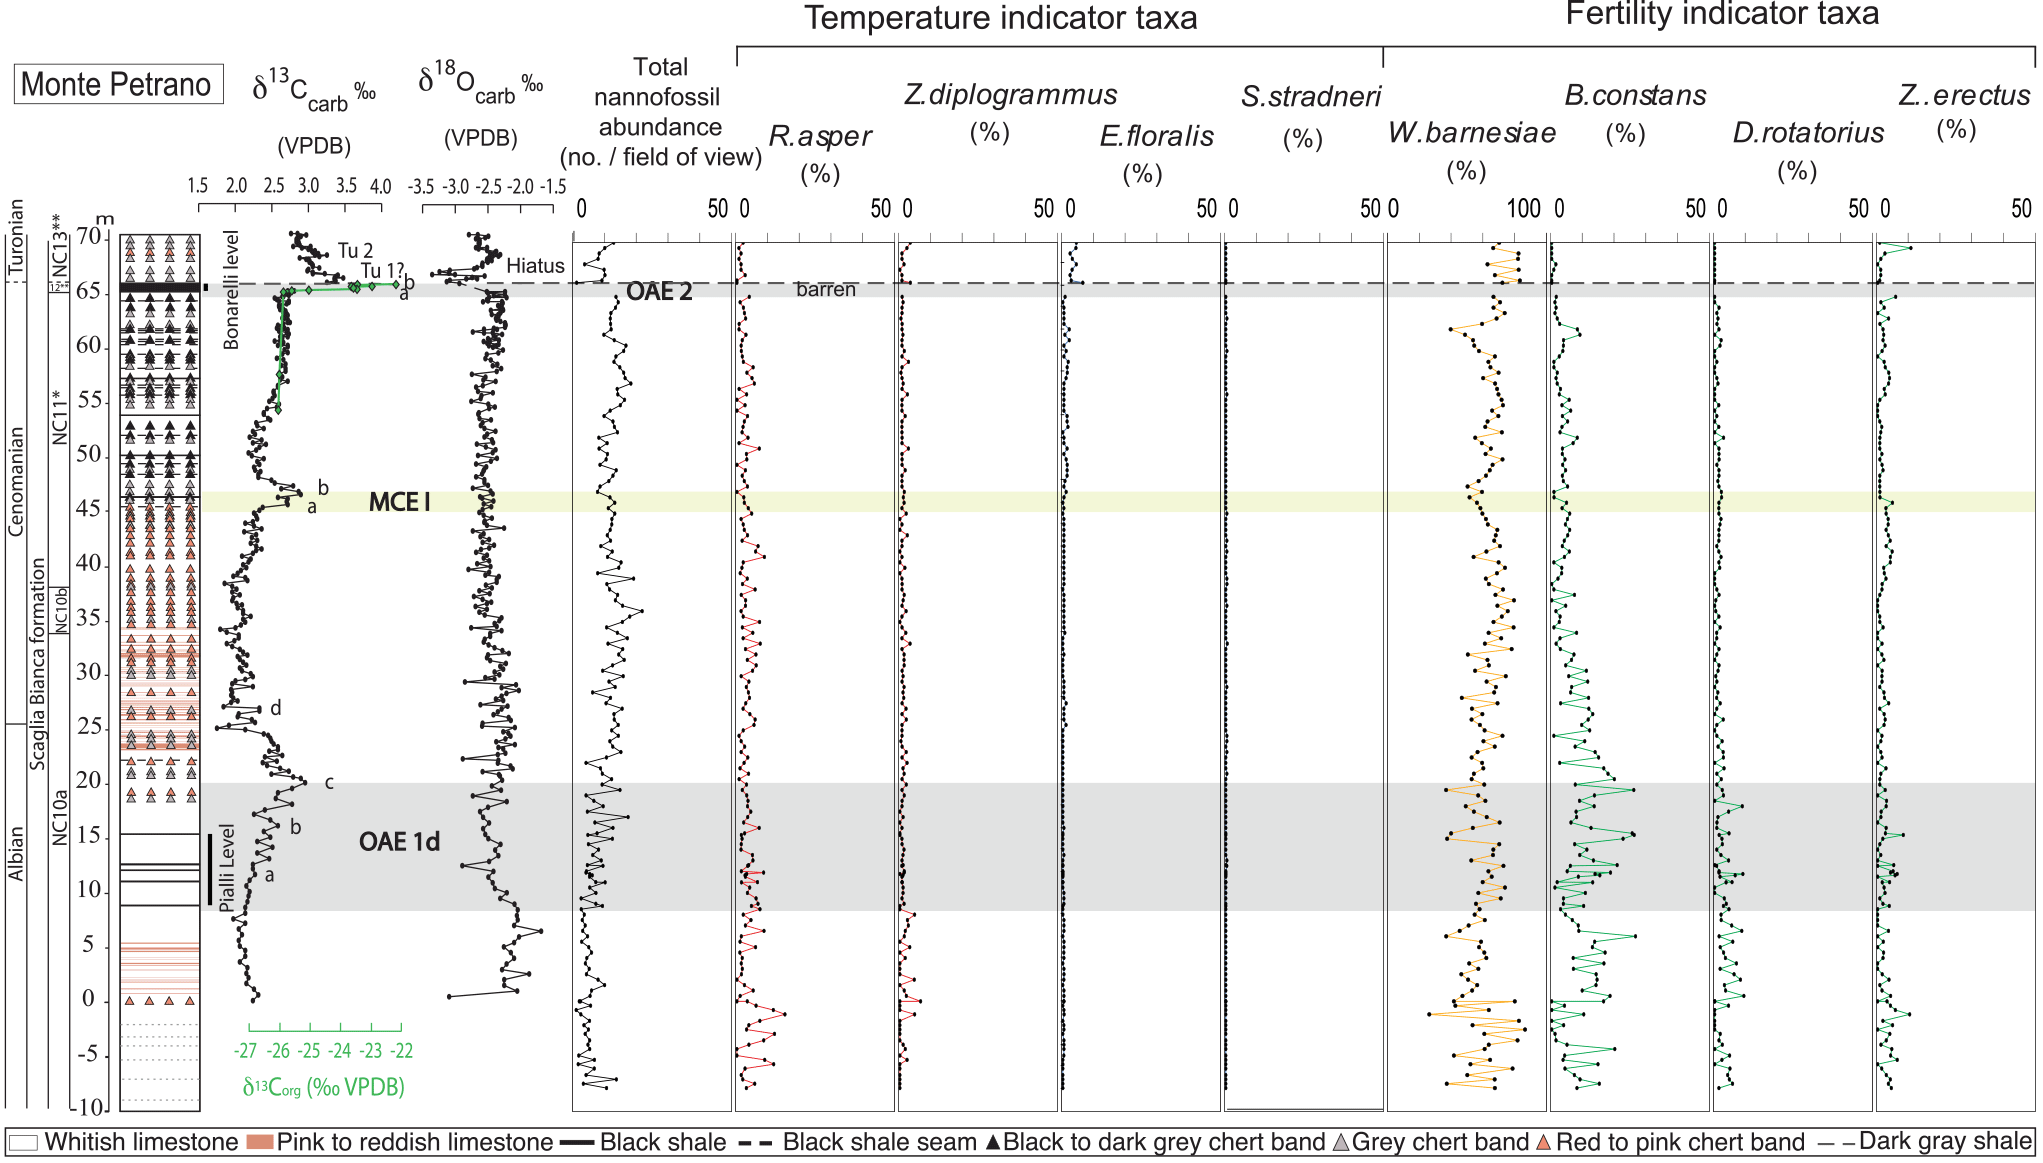
Figure 2Monte Petrano: total calcareous nannofossil abundance (average number of specimens in one field of view), relative abundance (%) of temperature and fertility indicator nannofossil species. The OAE 1d and OAE 2 are indicated by a grey band, the MCE I is represented by a yellow band. The stratigraphic framework (lithostratigraphy, biostratigraphy, chemostratigraphy) is from Gambacorta et al. (2015).
2.3 Nannofossil temperature and nutrient indices
Herrle et al. (2003a) proposed two indices based on selected nannofossil species: the temperature index (TI) and the nutrient index (NI), which have been successfully applied to Aptian and Albian intervals (e.g., Herrle, 2003; Herrle et al., 2003a, b; Tiraboschi et al., 2009; Herrle et al., 2010). Other authors proposed modified version of the TI and NI used in reconstructions through the Aptian (Bottini et al., 2015) and Albian (Tiraboschi et al., 2009).
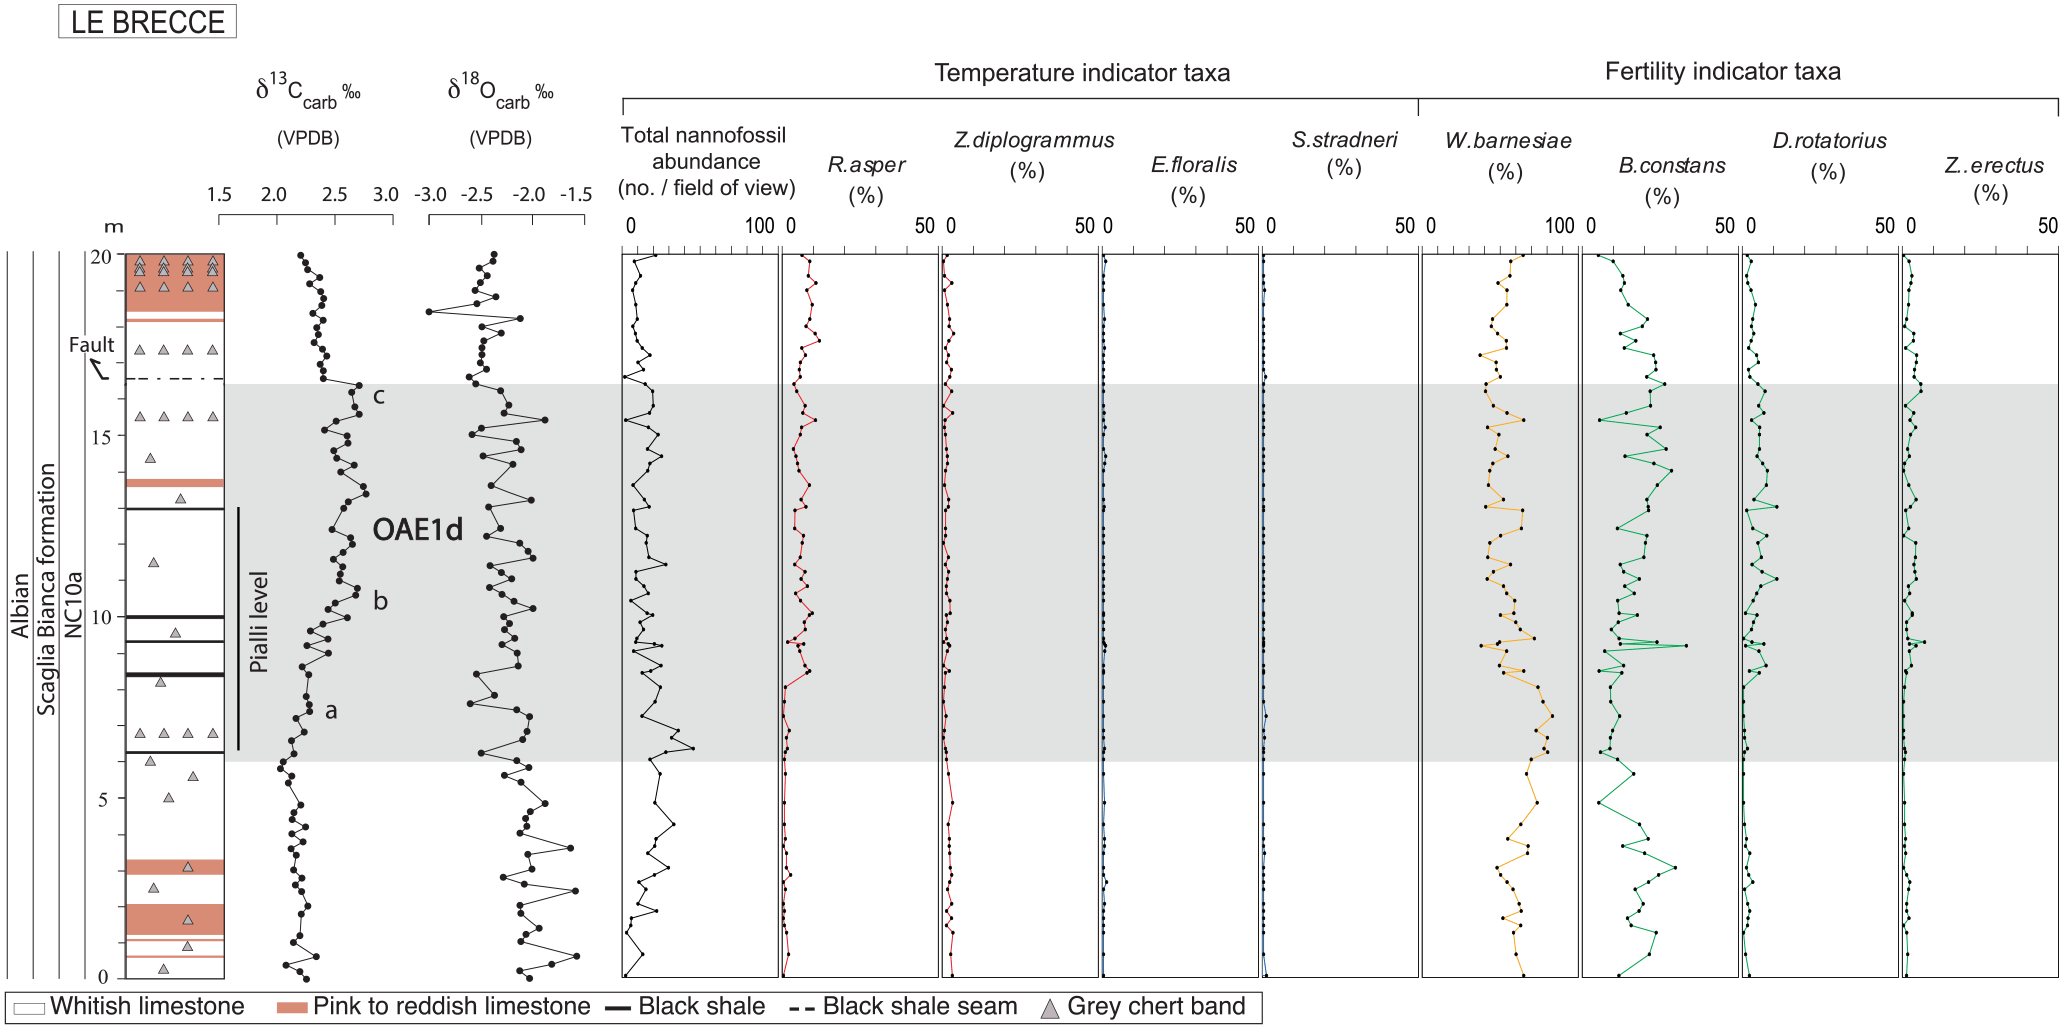
Figure 3Le Brecce: total calcareous nannofossil abundance (average number of specimens in one field of view), relative abundance (%) of temperature and fertility indicator nannofossil species. The OAE 1d is indicated by a grey band. The stratigraphic framework (lithostratigraphy, biostratigraphy, chemostratigraphy) is from Gambacorta et al. (2015).
Here, we adopt the TI and NI of Bottini et al. (2015). The NI includes higher-fertility (Biscutum constans, Zeugrhabdotus erectus, Discorhabdus rotatorius) and lower-fertility (W. barnesiae) nannofossil taxa (following Roth and Krumbach, 1986; Premoli Silva et al., 1989a, b; Watkins, 1989; Coccioni et al., 1992; Erba et al., 1992; Williams and Bralower, 1995; Bellanca et al., 1996; Herrle, 2002, 2003; Herrle et al., 2003a; Bornemann et al., 2005; Mutterlose et al., 2005; Tremolada et al., 2006; Tiraboschi et al., 2009). The TI is based on warmer-temperature (Rhagodiscus asper, Zeugrhabdotus diplogrammus) and cooler-temperature (Staurolithites stradneri, Eprolithus floralis, Repagulum parvidentatum) taxa (following Roth and Krumbach, 1986; Bralower, 1988; Wise Jr., 1988; Erba, 1992b; Erba et al., 1992; Mutterlose, 1992; Herrle and Mutterlose, 2003; Herrle et al., 2003a; Tiraboschi et al., 2009).
Ss: S. stradneri; Ef: E. floralis; Rp: R. parvidentatum; Ra: R. asper; Zd: Z. diplogrammus; Bc: B. constans; Dr: D. rotatorius; Ze: Z. erectus; Wb: W. barnesiae.
The TI and NI of Tiraboschi et al. (2009) were recalculated using Bottini et al. (2015).
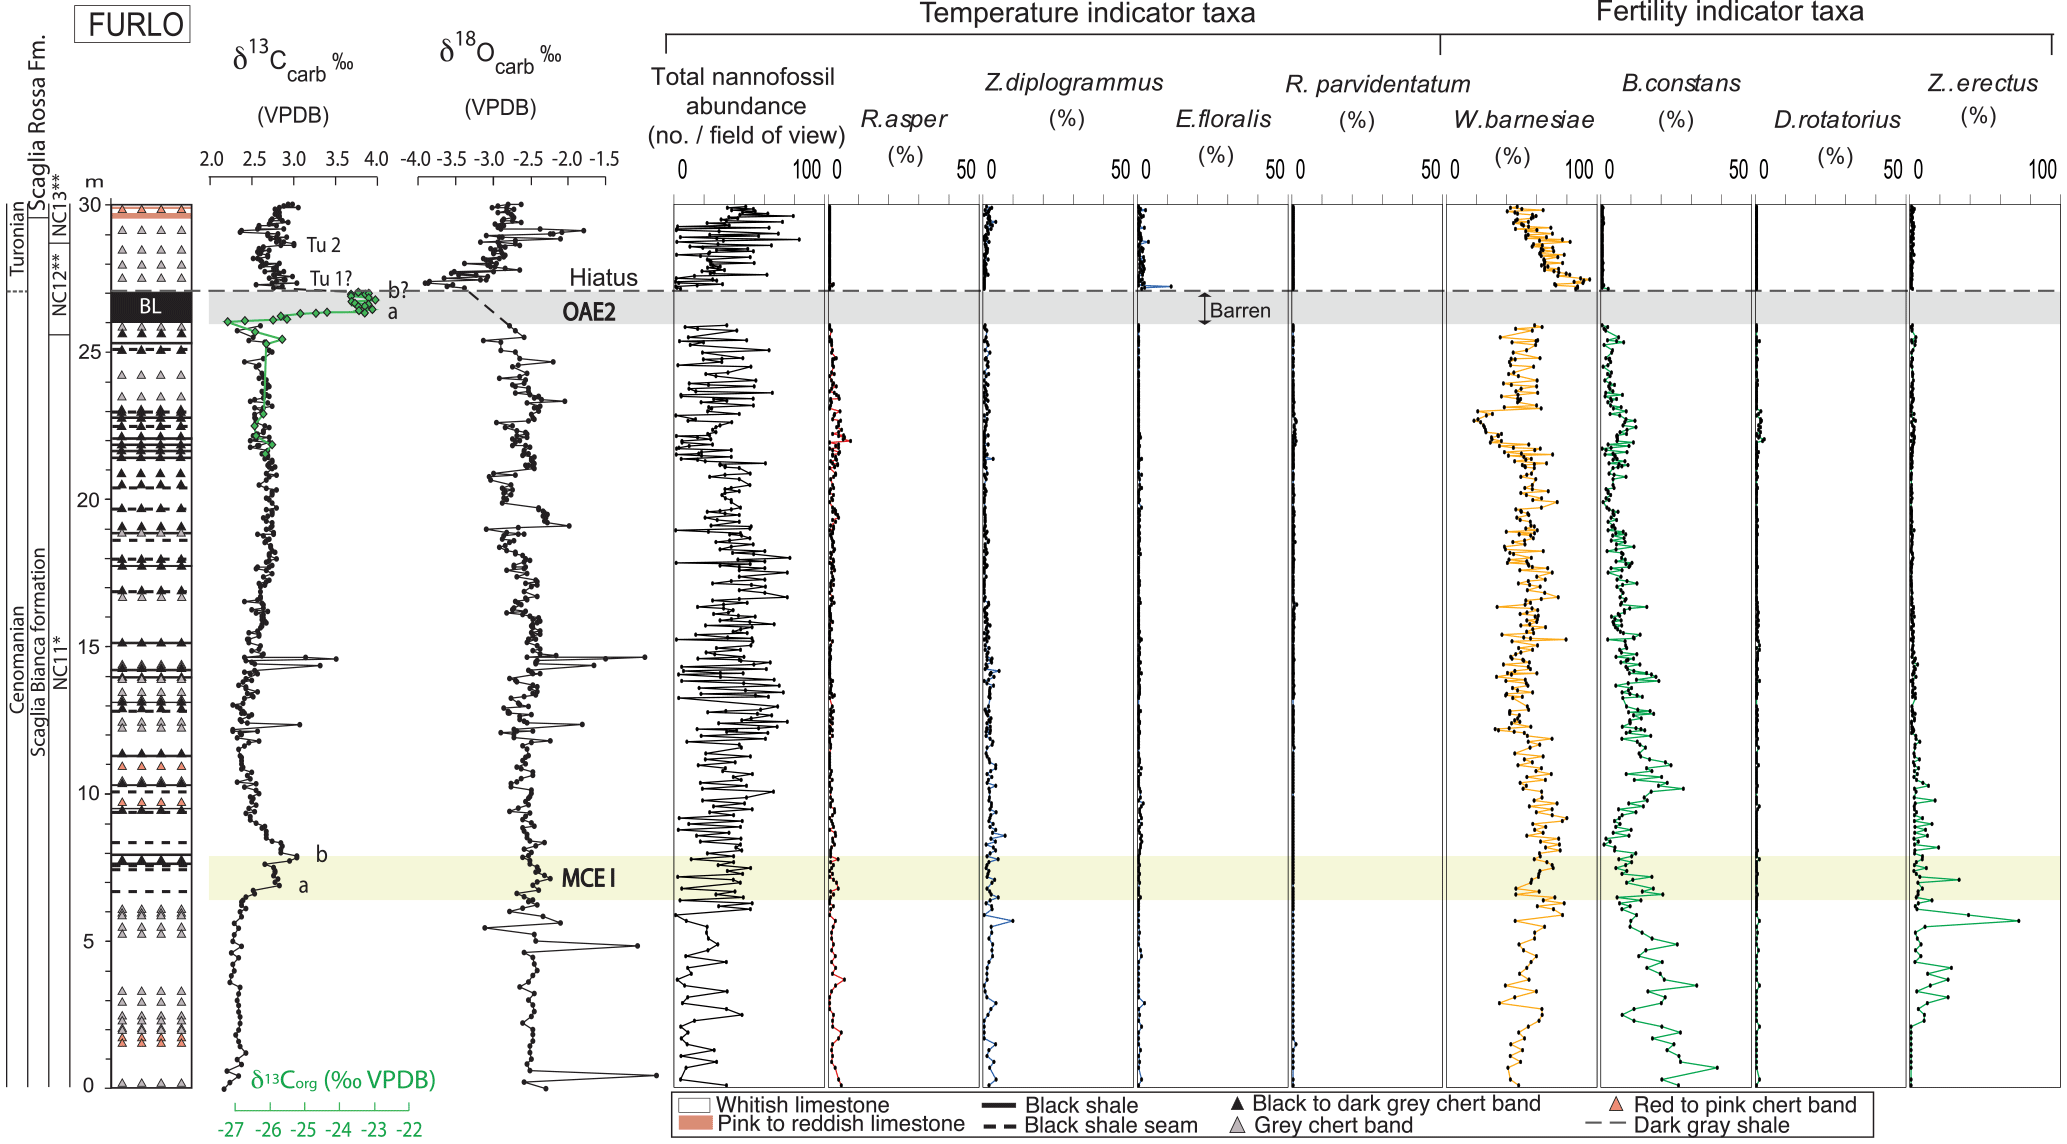
Figure 4Furlo: total calcareous nannofossil abundance (average number of specimens in one field of view), relative abundance (%) of temperature and fertility indicator nannofossil species. The OAE 2 is indicated by a grey band, the MCE I is represented by a yellow band. The stratigraphic framework (lithostratigraphy, biostratigraphy, chemostratigraphy) is from Gambacorta et al. (2015).
3.1 Calcareous nannofossil preservation
Calcareous nannofossils are generally common to abundant in the studied sections, with the exception of the Bonarelli level that is barren both at Furlo and Monte Petrano. Preservation at the Monte Petrano, Le Brecce and Furlo sections is moderate with some evidence of overgrowth. Although in all the three sites nannofossil assemblages are characterized by relatively high abundances (> 40 %) of Watznaueria barnesiae (Figs. 2, 3 and 4) possibly indicative of heavily altered samples (e.g., Thierstein and Roth, 1991), we exclude the possibility that nannofossil abundances were controlled by diagenesis since dissolution-prone species (e.g., D. rotatorius, B. constans, Z. erectus) are relatively abundant and there is not a systematic correlation between lithology and nannofossil abundance and/or preservation. We maintain that, although lithification and burial processes may have altered the micrite composition, the variations in abundance of the species detected preserve a primary signal of oceanic settings.
In the following paragraphs, a description of the major trends of the total nannofossil abundance and of the relative abundance of the taxa used for the calculation of the TI and NI is given for the three investigated sections.
3.2 Calcareous nannofossil abundances in the late Albian–early Turonian
In the Monte Petrano section (Fig. 2), the total abundance of calcareous nannofossils is between 0.7 and 21.7 (no. of specimens per field of view) with an average of 9.6 (no. of specimens per field of view). The Bonarelli level is barren of calcareous nannofossils. In the interval preceding OAE 1d the total abundance displays a relatively lower average (4.8 specimens per field of view). Higher values (average 12.1 specimens per field of view) are detected through the OAE 1d up to the base of OAE 2. W. barnesiae is the dominant species with a mean abundance of 61.6 %. Three intervals (0–8; 43–50; 60–63 m) are characterized by a lower W. barnesiae abundance (between 30 % and 50 %). Rhagodiscus asper ranges from 0 % to 15 % of the total assemblage (mean 3.2 %) and the highest values are displayed between −10 and 0 m. Zeugrhabdotus diplogrammus ranges from 0 % to 6.6 % (mean 1 %) with the highest peaks between −7 and 8 m. Staurolithites stradneri ranges from 0 % to 0.4 %, and it is encountered from 12.5 to 45 and 56 to 63 m. Eprolithus floralis ranges from 0 % to 6.3 % (mean 0.8%) and shows a first increase in relative abundance in the interval between the MCE I and the Bonarelli level (mean 0.8 %) and a further increase above OAE2 (mean 3.6 %). Biscutum constans ranges from 0 % to 26.5 % (mean 6.4 %), D. rotatorius from 0 % to 9.2 % (mean 1.6 %) and Z. erectus from 0 % to 10.5 % (mean 1.8 %). These three species are more abundant in the interval between the base of the section and the top of OAE 1d. In addition, Biscutum constans shows higher values between 60 and 62.5 m; Z. erectus displays higher abundances between 38.5 and 46 m, between 56 and 65 m, and at the very top of the section. Discorhabdus rotatorius and Z. erectus show abundances close to zero in the interval above OAE 2.
In the Le Brecce section (Fig. 3) the total abundance of calcareous nannofossils is between 0 and 73 (no. of specimens per field of view) with an average of 15.2 (no. of specimens per field of view). The highest abundances are registered between 3 and 7 m. Watznaueria barnesiae is the dominant species with an average abundance of 55.5 %. The interval from 0 to 8 m is characterized by a relatively higher abundance (average 65 %) compared to the interval above (8–20 m) with an average abundance of 50 %. Rhagodiscus asper ranges from 0 % to 11 % (mean 4.5 %), having the highest values within OAE 1d and above it (8–20 m). Zeugrhabdotus diplogrammus ranges from 0 % to 3.3 % (mean 1.35 %) and shows a higher abundance below OAE 1d. Eprolithus floralis and S. stradneri are scarce and range from 0 % to 1 % (mean 0.09 %) and from 0 % to 0.95 % (mean 0.05 %), respectively. S. stradneri is absent in the interval corresponding to OAE 1d except in two samples (3.4 and 6.6 m). Biscutum constans ranges from 0 % to 29.7% (mean 15.8 %). D. rotatorius ranges from 0 % to 10.7 % (mean 3.1 %) and Z. erectus from 0 % to 5.6 % (mean 1.7 %). Biscutum constans is more abundant from 0 to 3 m and from 11 to 18 m. D. rotatorius and Z. erectus are more abundant within and above OAE 1d (11 to 20 m).
In the Furlo section (Fig. 4) the total abundance of calcareous nannofossils is between 0 and 83 (no. of specimens per field of view) with an average of 31.69 (no. of specimens per field of view). The interval corresponding to the Bonarelli level is barren of calcareous nannofossils. Relatively lower total abundance is identified between 0 and 6 m and between 21.5 and 22.5 m. W. barnesiae is the dominant species with a mean abundance of 54 %. Only the interval between 22 and 23 m is characterized by a much lower average abundance (average 27.25 %). Rhagodiscus asper ranges from 0 % to 7 % (mean 0.78 %), showing peaks below the MCE I and between 19 and 23 m. Zeugrhabdotus diplogrammus fluctuates between 0 % and 9.6 % (mean 1 %), being more abundant in the interval between 0 and 14 m and above OAE 2. Eprolithus floralis ranges from 0 % to 10.8 % (mean 0.3 %), with the highest peaks displayed above OAE 2. R. parvidentatum ranges from 0 % to 1.2 % (mean 0.05 %) with relatively higher values displayed between 11 and 23 m. Biscutum constans ranges from 0 % to 38.5 % (mean 6.7 %), showing a higher abundance from 0 to 5 m and from 9 to 11 m. D. rotatorius ranges from 0 % to 2.5 % (mean 0.1 %) with peaks displayed between 22 and 23 m. Z. erectus ranges from 0 % to 72.1 % (mean 2.3 %), showing the highest values in the lowest part of the section between 2 and 7 m. The latter three species show abundances close to zero in the interval above OAE 2 (27–30 m).
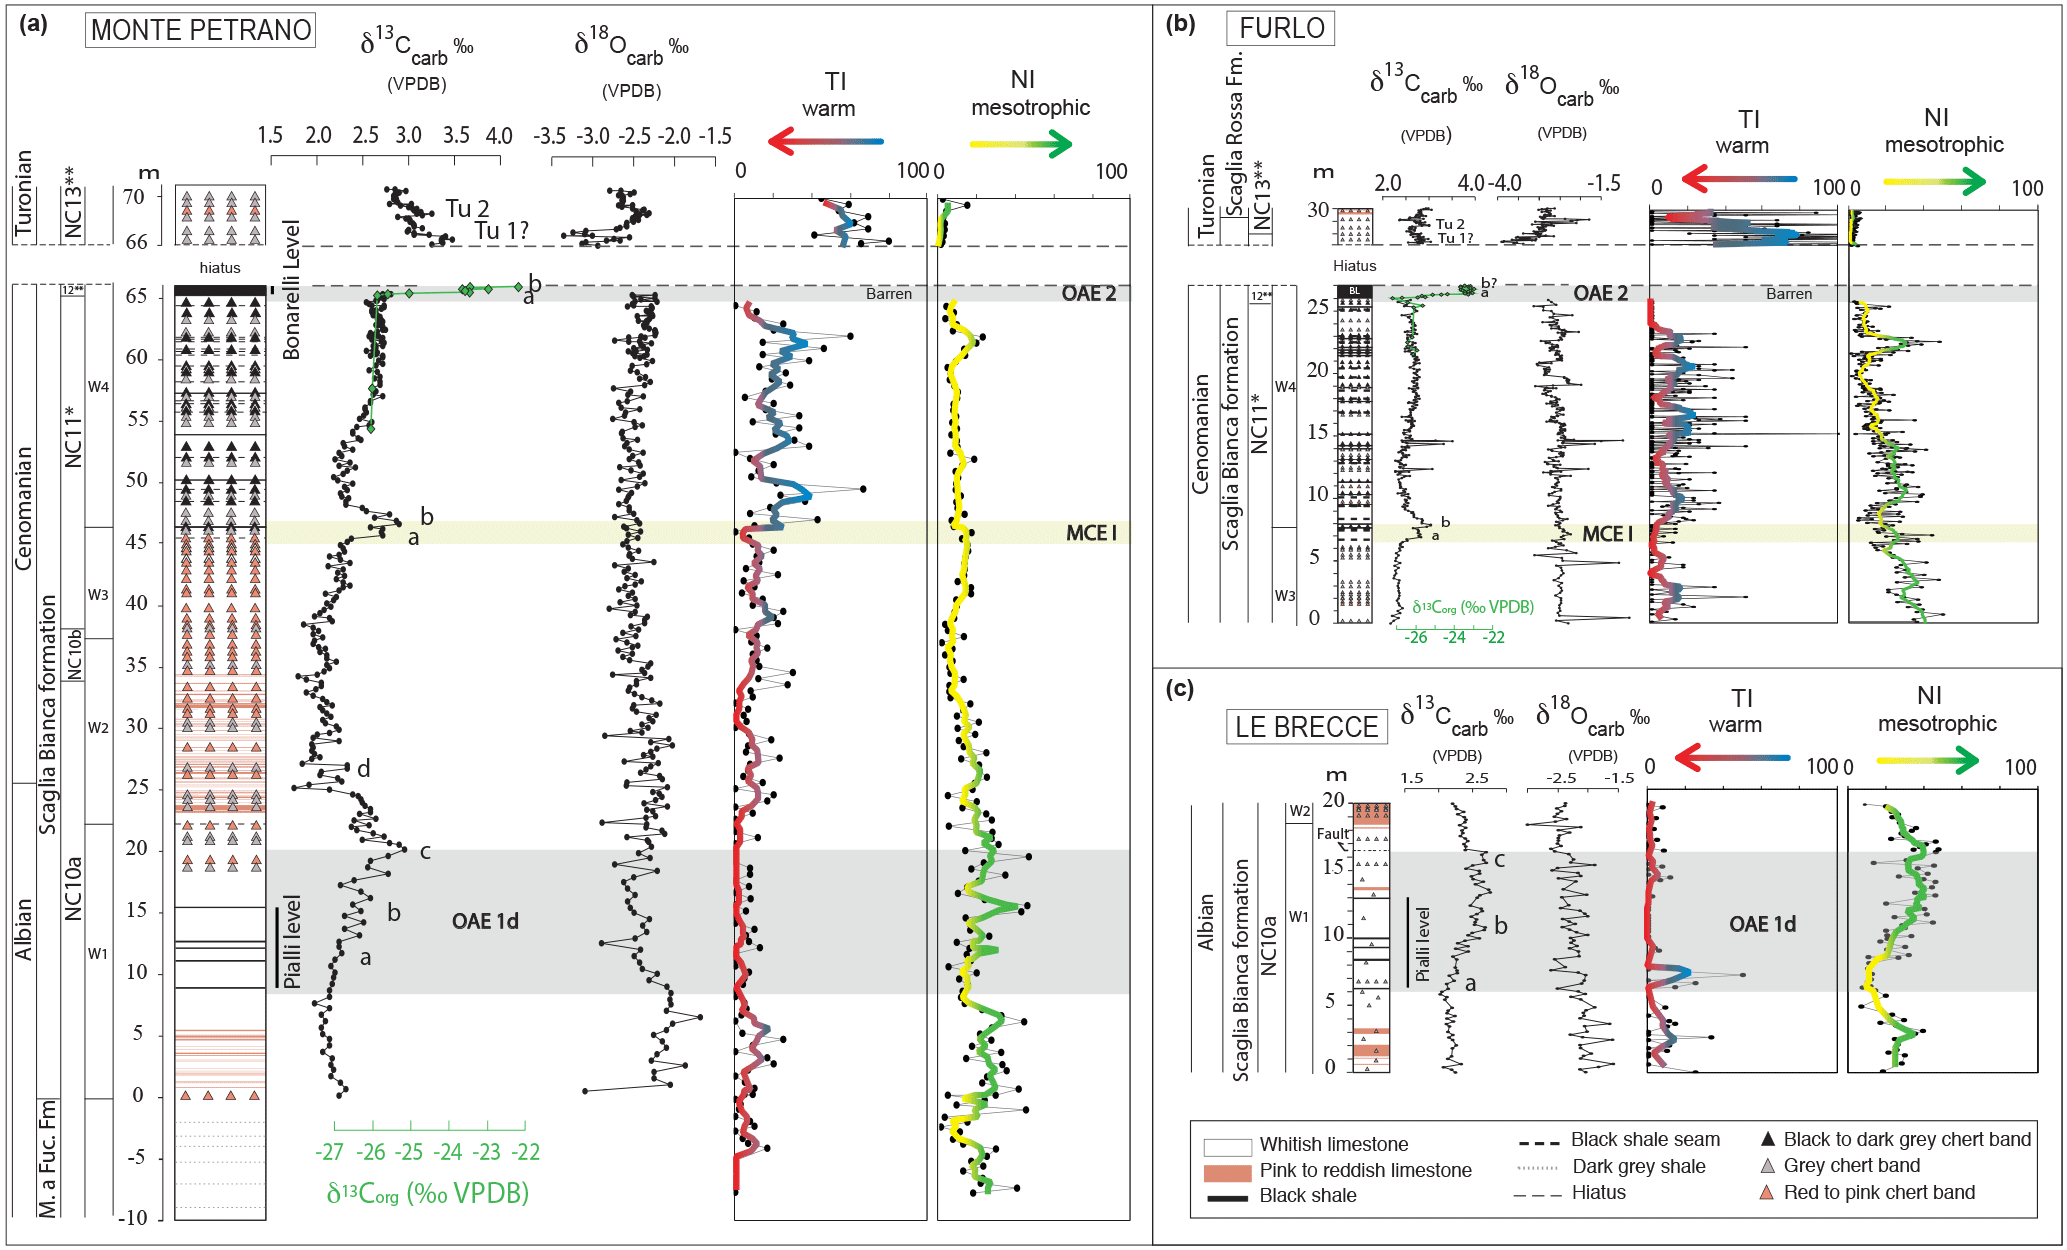
Figure 5Nannofossil temperature (TI) and nutrient (NI) indices for the (a) Monte Petrano, (b) Furlo and (c) Le Brecce sections. TI and NI are reported point by point (in black) and smoothed (TI: blue–red; NI: green–yellow). The TI and NI were smoothed using a 3-point moving average for Monte Petrano, a 5-point moving average for Le Brecce, a 6-point moving average for the interval 0–5.8 m of Furlo and an 11-point moving average for the interval 6–30 m of Furlo. Lower values of the TI indicate higher temperatures and vice versa. Higher values of the NI indicate higher surface water productivity and vice versa. Lithostratigraphy, biostratigraphy and chemostratigraphy are from Gambacorta et al. (2015).
3.3 Calcareous nannofossil temperature and nutrient indices (late Albian–early Turonian)
The fluctuations of nannofossil TI and NI are represented in Fig. 5. The three studied sections were analyzed with different sampling rates providing time resolutions of (a) ca. 60 kyr in the Late Albian (OAE 1d) and ca. 50 kyr in the Cenomanian of the Monte Petrano section, (b) ca. 24 kyr at Le Brecce (OAE 1d), and (c) ca. 20 kyr in the interval 0–5.8 m and ca. 10 kyr in the interval 6–30 m of the Furlo section throughout the Cenomanian (sedimentation rates are from G. Gambacorta, personal communication). In order to have smoothed TI and NI curves on comparable time windows (ca. 120 kyr across the OAE 1d interval and ca. 100 kyr through the Cenomanian), the nannofossil TI and NI were smoothed with a 3-point moving average at Monte Petrano, a 5-point moving average at Le Brecce, a 6-point moving average in the lower part of the Furlo section (0 to 5.8 m) and an 11-point moving average in the interval 6–30 m of Furlo. At Monte Petrano (Fig. 5) the TI shows relatively cooler conditions before OAE 1d followed by a warming starting prior to OAE 1d. General warm conditions are indicated also through OAE 1d characterized by some samples with TI close to zero (corresponding to highest temperature). The interval between the top of OAE 1d and MCE I is characterized by average TI shifted towards slightly cooler conditions. The MCE I is associated with transient warming followed by increasing TI values marking the onset of a progressive cooling interval with frequent oscillations in TI values. Three cooler interludes are identified over this interval alternated with warmer phases. A marked warming is detected just prior to OAE 2. All samples in the Bonarelli level are barren of calcareous nannofossils and therefore the TI cannot be calculated. In the early Turonian, above the hiatus eliding the earliest Turonian “thermal maximum” (Gambacorta et al., 2015), the TI is indicative of cooler conditions.
At Monte Petrano the NI is suggestive of higher surface water fertility characterizing the interval preceding OAE 1d. A decrease in the NI just precedes the onset of OAE 1d and characterizes the early phase of the event. Relatively higher fertility is detected during the middle and upper part of OAE 1d. The interval between OAE 1d and MCE I is marked by a decreasing trend of the NI, indicating progressively lower surface water fertility that remained suppressed for most of the Cenomanian. A moderate increase in the NI started in the NC10b nannofossil subzone and values remained almost constant up to ca. 60 m. A shift towards higher NI is identified in a discrete interval below OAE 2 (60–62 m) followed by an interval of low NI. All samples in the Bonarelli level are barren of calcareous nannofossils and therefore the NI cannot be derived. The interval above the Bonarelli level shows low NI except for a single higher value at the very top of the studied interval.
The interval before OAE 1d at Le Brecce (Fig. 5) shows relatively cooler conditions followed by some samples with lower TI prior to OAE 1d. A minor peak towards relatively cooler temperature marks the early phase of OAE 1d, while the rest of the event is characterized by warm conditions with most samples having TI equal to zero. A very minor cooling is evidenced close to the end of OAE 1d. Warm conditions mark the interval post-OAE 1d.
In the Le Brecce section the NI is suggestive of higher surface water fertility in the interval preceding OAE 1d. A decrease in fertility marks the onset of OAE 1d. An increase in the NI is detected in the middle and upper part of OAE 1d. Here, the NI is fluctuating more with alternated samples having relatively higher and lower NI values. The interval following OAE 1d is marked by a progressive decrease in NI values.
In the Furlo section (Fig. 5), samples with relatively higher TI are encountered in the lower part of the studied interval around 2–3 m, followed by a warming trend reaching warmest conditions during the MCE I. A progressive temperature decrease is registered at the end and after MCE I. Fluctuating TI values mark the interval between the MCE I and OAE 2 with four subsequent cooler intervals. Prior to OAE 2 all samples reached TI =0, marking intense warming. Samples in the Bonarelli level are barren of calcareous nannofossils and therefore the TI cannot be calculated. The TI record above the Bonarelli level and above the hiatus eliding the earliest Turonian “thermal maximum” (Gambacorta et al., 2015) is suggestive of cooler conditions although a few samples shift towards very low to zero values suggestive of short-lived warming spikes within a much cooler interval.
The NI is suggestive of higher surface water fertility over the interval preceding the MCE I whose onset is characterized by higher NI followed by a decrease in fertility reaching lower values soon after MCE I. The overlying Cenomanian interval is characterized by relatively higher NI but displaying a decreasing trend. Below OAE 2 (22–23 m) a distinct fertility phase is detected; this is followed by an interval of low NI until a peak just precedes OAE 2. All samples in the Bonarelli level are barren of calcareous nannofossils and therefore the NI could not be used. The interval above the Bonarelli level shows low NI values.
3.3.1 Comparison of the TI and NI in the three studied sections
The smoothed TI and NI calculated in the three studied sections are compared (Fig. 5) to (i) detect if similarities or differences in the main trends reflect primary signals and (ii) understand if records with different resolution highlight the same number and amplitude of fluctuations.
The TI and NI records obtained across the OAE 1d interval at Le Brecce and Monte Petrano show many similarities in trends and values. Concerning surface water fertility, at both sections there is a decrease in the NI starting prior to OAE 1d followed by an increasing trend initiating in the middle of the Pialli level. The highest NI values are reached in the terminal part of OAE 1d. Higher NI values are determined mainly by abundant B. constans in both sections (20–30 %). The TI indicates relatively cooler conditions prior to OAE 1d at either the Monte Petrano or Le Brecce section with a relative warming just preceding OAE 1d. The relative cooling at the onset is evidenced only at Le Brecce, while general warm conditions during OAE 1d are identified in both sections derived from higher abundances of R. asper (warm-water species) combined with very rare (≤1 %) cold-water species.
Considering Furlo and Monte Petrano, the TI shows similar trends although at Monte Petrano the TI has slightly higher values (cooler conditions) in the interval postdating the MCE I due to a relatively higher abundance of E. floralis. The sequence of warmer and cooler phases detected from the MCE I up to the onset of OAE 2 is related to alternated peaks of R. asper and E. floralis–R. parvidentatum (cold-water species). R. parvidentatum is found, although rarely, only at Furlo. The main difference in the two TI records regards the more pronounced fluctuations at Furlo, probably due to the lower resolution adopted at Monte Petrano. In both studied sections, the TI indicates a warming starting 3 m below the Bonarelli level (ca. 400 kyr; Lanci et al., 2010), while the interval above the Bonarelli level corresponding to the post-early Turonian “thermal maximum” is characterized by abundant E. floralis suggestive of cooler temperatures.
More pronounced differences are evidenced in the NI curves of Monte Petrano and Furlo. In particular, the NI calculated at Furlo is 2 to 3 times higher than at Monte Petrano due to more abundant B. constans and Z. erectus at Furlo. Such a difference in the smoothed NI values exists up to the middle part of the nannofossil zone NC11*, but from the middle part of NC11* to the base of OAE 2, the two NI curves show similar values. A fertility spike preceding OAE 2 of ca. 400 kyr (Lanci et al., 2010) coincides with the cooler interlude traced by the TI. The NI spike derives from higher abundances of B. constans, Z. erectus and D. rotatorius, while W. barnesiae (oligotrophic species) shows a minimum in abundance. Low NI values characterize both sections in the interval above the Bonarelli level.
The comparison of the three studied sites suggests that the relative abundances of analyzed nannofossil species and the TI and NI display similar and coeval fluctuations. This indicates that a primary signal is recorded by nannofossils. We interpret the differences in the NI of Furlo vs. Monte Petrano as depending on primary factors. We notice, in fact, that only fertility indicators differ in relative abundance, while the other analyzed species have similar abundances. The higher abundances of mesotrophic species at Furlo are therefore considered to reflect a relatively different setting at Furlo hypothesized to be located closer to the coast and thus having a higher input of nutrients from the continent as also suggested by sedimentological data (Gambacorta et al., 2016).

Figure 6(a) Composite section through the uppermost Barremian–Cenomanian, which includes the following from bottom to top: (i) Cismon core, (ii) Piobbico core, (iii) Monte Petrano, Le Brecce and Furlo sections. Nannofossil zones are from Erba (1988), Tiraboschi et al. (2009), Erba et al. (1999), Gambacorta et al. (2015). δ13C curve (5-point moving average); (b) nannofossil nutrient index (NI). The NIs of Furlo and Monte Petrano are both presented since the two NI records are interpreted to reflect local conditions. (c) Point by point δ18O and 5-point moving average; (d) nannofossil temperature index (TI). The dotted red line is based on R. asper relative abundance; (e) relative abundance (%) of R. asper and cold-water species (E. floralis and R. parvidentatum); (f) modified TI (m-TI, ∘C) takes into account R. asper abundance (%) and is calibrated with TEX86 SSTs (∘C) recalculated following Kim et al. (2010). TEX86 SSTs include data from (i) DSDP site 463 (Schouten et al., 2003); (ii) DSDP site 545 (McAnena et al., 2013); (iii) ODP sites 1258 and 1259 (Forster et al., 2007). δ13C and δ18O include data from the (i) Cismon core (Bottini et al., 2015), (ii) Piobbico core (Tiraboschi et al., 2009 and Bottini et al., 2015) and (iii) Monte Petrano (Giorgioni et al., 2012; Gambacorta et al., 2015). Nannofossil TI and NI composite curves include nannofossil data from (i) the Cismon core (Bottini et al., 2015); (ii) the Piobbico core (Tiraboschi et al., 2009; Bottini et al., 2015); (iii) the Monte Petrano, Le Brecce and Furlo sections (this work).
The nannofossil TI and NI derived for the Albian–Cenomanian time interval extend the record previously collected for the latest Barremian–Aptian (Bottini et al., 2015) and provide, for the first time, a complete and continuous reconstruction of paleoenvironmental conditions through the mid-Cretaceous of the western Tethys Ocean. We built a composite record (Fig. 6) that includes the following from bottom to top: (1) the Cismon core for the latest Barremian–early Aptian (up to the top of the Selli level); (2) the Piobbico core for the early Aptian (from the top of the Selli level) to the late Albian; (3) the Le Brecce section for the late Albian; and (4) the Monte Petrano section for the late Albian–Cenomanian.
4.1 Long-term changes in surface water fertility
The NI (Fig. 6) indicates low fertility in the latest Barremian–early Aptian interval (nannofossil zone NC6) except for a relative increase in fertility at the nannoconid decline and at the onset of OAE 1a. Mesotrophic conditions are reconstructed through the late Aptian (nannofossil zone NC7) with a temporary return to oligotrophy during the N. truittii acme interval. In the Aptian–Albian boundary interval, surface water fertility was again relatively low despite short-lived peaks in fertility marking the Kilian and Urbino levels and partially the Monte Nerone level. The middle Albian (nannofossil zone NC9) was characterized by overall mesotrophic conditions comparable to those detected for the late Aptian.
At the beginning of the late Albian, in correspondence to the lithostratigraphic change from the Marne a Fucoidi to the Scaglia Bianca Formation, a relatively short interval of oligotrophic conditions is followed by an increase in fertility, interrupted by a temporary drop associated with the Pialli level (onset of OAE 1d). Maximum NI values were reached in correspondence to the end of OAE 1d. A return to relatively low fertility was derived for the early Cenomanian (upper part of nannofossil zone NC10), followed by intermediate conditions through the rest of the Cenomanian. However, differences were evidenced at the investigated localities: at Monte Petrano the NI shows medium to low fertility, whereas at Furlo conditions were mesotrophic, possibly because this location was more proximal and under the influence of higher nutrient input due to runoff (Gambacorta et al., 2016). By the late Cenomanian time (upper part of nannofossil zone NC11*) a discrete interval of higher fertility was identified ca. 400 kyr prior to the onset of OAE 2.
4.2 Long-term changes in surface water temperature
The composite TI obtained from individual sections (Fig. 5) was modified taking into account the relative abundance of the warm-water species R. asper for the intervals marked by the highest nannofossil paleotemperature (TI =0). Such modification allows for the evaluation of potential fluctuations under excess warming when the TI reaches the full scale. The modified TI (m-TI) (Fig. 6) was also applied here to the western Tethyan records previously reconstructed by Tiraboschi et al. (2009) and Bottini et al. (2015) for the Albian and the Aptian, respectively, to derive a composite Aptian–Cenomanian curve.
The m-TI shows relatively warm conditions through the latest Barremian–earliest Aptian with a rapid warming event at OAE 1a onset, followed by a return to pre-OAE 1a paleotemperatures through the rest of the Selli event. It is, however, of remark that E. floralis globally appeared immediately after the end of OAE 1a. Consequently, warm TI paleotemperatures obtained for the latest Barremian–earliest Aptian interval are possibly overestimated. Soon after OAE 1a, the m-TI shows a cooling persisting through the late Aptian, with the lowest temperatures reached immediately after the N. truittii acme interval. A progressive increase in paleotemperatures characterized the latest Aptian–earliest Albian (nannofossil zone NC8) and was marked by hyperthermals detected in association with specific black shale levels (Kilian equivalent and Urbino level). The highest paleotemperature, similar to that of OAE 1a onset, was reached within OAE 1b. The m-TI record of the middle Albian (nannofossil zone NC9) underlines a prolonged warming phase with conditions similar to those characterizing the onset of OAE 1a and OAE 1b, and three cycles are recorded (Fig. 6). In the late Albian–Cenomanian interval, the m-TI shows intermediate conditions with ample fluctuations becoming more frequent in the middle to late Cenomanian between the MCE I and OAE 2.
The relationships between the nannofossil TI and other paleotemperature proxies were previously discussed for the Aptian–Albian interval (Tiraboschi et al., 2009; Bottini et al., 2015). A limited agreement is observed between the δ18O(bulk) record and the m-TI, although temperature trends appear quite similar across OAE 1a, in late Aptian–early Albian hyperthermals and during OAE 1d (Fig. 6).
TEX86-derived SSTs from the proto-North Atlantic (McAnena et al., 2013) were used to calibrate the average nannofossil TI obtained from DSDP site 463 and the Piobbico core through the late Aptian (Bottini et al., 2015). Here, a similar approach is applied using the m-TI and available TEX86 SSTs at low latitudes (Fig. 6), namely (1) DSDP site 463 in the mid-Pacific Mountains for OAE 1a (Dumitrescu et al., 2006), (2) DSDP site 545 in the proto-North Atlantic for the late Aptian (McAnena et al., 2013) (3) and ODP sites 1258–1259 at the Demerara Rise for the middle Albian–Cenomanian (Forster et al., 2007). Following O'Brien et al. (2017) all SSTs were recalculated with the calibration proposed by Kim et al. (2010) for oceans with SST > 15 ∘C. Two tie points were used to calibrate the m-TI curve with TEX86 SSTs during OAE 1a and the early late Aptian prior to the N. truittii acme. In fact, these intervals were characterized by similar temperatures worldwide (e.g., Schouten et al., 2003; Dumitrescu et al., 2006; Mutterlose et al., 2010, 2014) and equal average TI values for the Tethys and Pacific Ocean (Bottini et al., 2015).
For the late Aptian, the nannofossil TI indicates Tethyan temperatures warmer than in the Pacific Ocean (Bottini et al., 2015) and we assumed that TEX86 SSTs in the proto-North Atlantic were lower than in the western Tethys (Fig. 6) as indicated by a higher relative abundance of the cool-water boreal taxon R. parvidentatum in the proto-North Atlantic (McAnena et al., 2013) than at Piobbico (Fig. 6). The calibrated m-TI shows an average paleotemperature of ca. 33 ∘C in the interval preceding OAE 1a and ca. 36 ∘C at the onset of OAE 1a. It might be, however, that m-TI paleotemperatures of the Barremian–Aptian boundary interval are overestimated. The absence of the cold-water species E. floralis could have in fact altered the nannofossil results as discussed above. Considering that the nannofossil TI reconstructed from Tethyan and Pacific records (Bottini et al., 2015) for the latest Barremian–earliest Aptian time interval provided comparable results and that a ca. 8 ∘C increase was derived at the onset of OAE 1a at DSDP site 463 (Ando et al., 2008), we suppose that m-TI SSTs across the Barremian–Aptian boundary are overestimated by 3–4 ∘C. The coolest conditions of the middle–late Aptian corresponded to paleotemperatures of ca. 29 ∘C followed by an increase up to 32 ∘C across the Aptian–Albian boundary with hyperthermal spikes of 31 ∘C in the 113 level, 34 ∘C in the Kilian level and 36 ∘C in the Urbino level. Across the middle–late Albian, the m-TI from the western Tethys and TEX86 SSTs from the Demerara Rise (ODP site 1258) displays a long-lasting warming phase with temperatures fluctuating between 34 and 36 ∘C. A 2 ∘C decrease in paleotemperatures was recorded for the late Albian–early Cenomanian (33 ∘C on average) with oscillations between 32 ∘C and 34 ∘C. Nannofossil m-TI-derived paleotemperatures suggest a further cooling starting before the MCE I with values fluctuating around 32 ∘C.
In the late Cenomanian, TEX86 SSTs were ca. 2 to 4 ∘C higher with respect to m-TI-derived values. Indeed, R. parvidentatum was found only in the western Tethys, thus providing evidence for cooler conditions relative to the equatorial Demerara Rise (Hardas et al., 2012) where TEX86 SSTs were calculated (Forster et al., 2007). The m-TI-based paleotemperature shows a warming trend prior to OAE 2, but the absence of calcareous nannofossils in the Bonarelli level hampers climatic reconstructions across the Cenomanian–Turonian boundary.
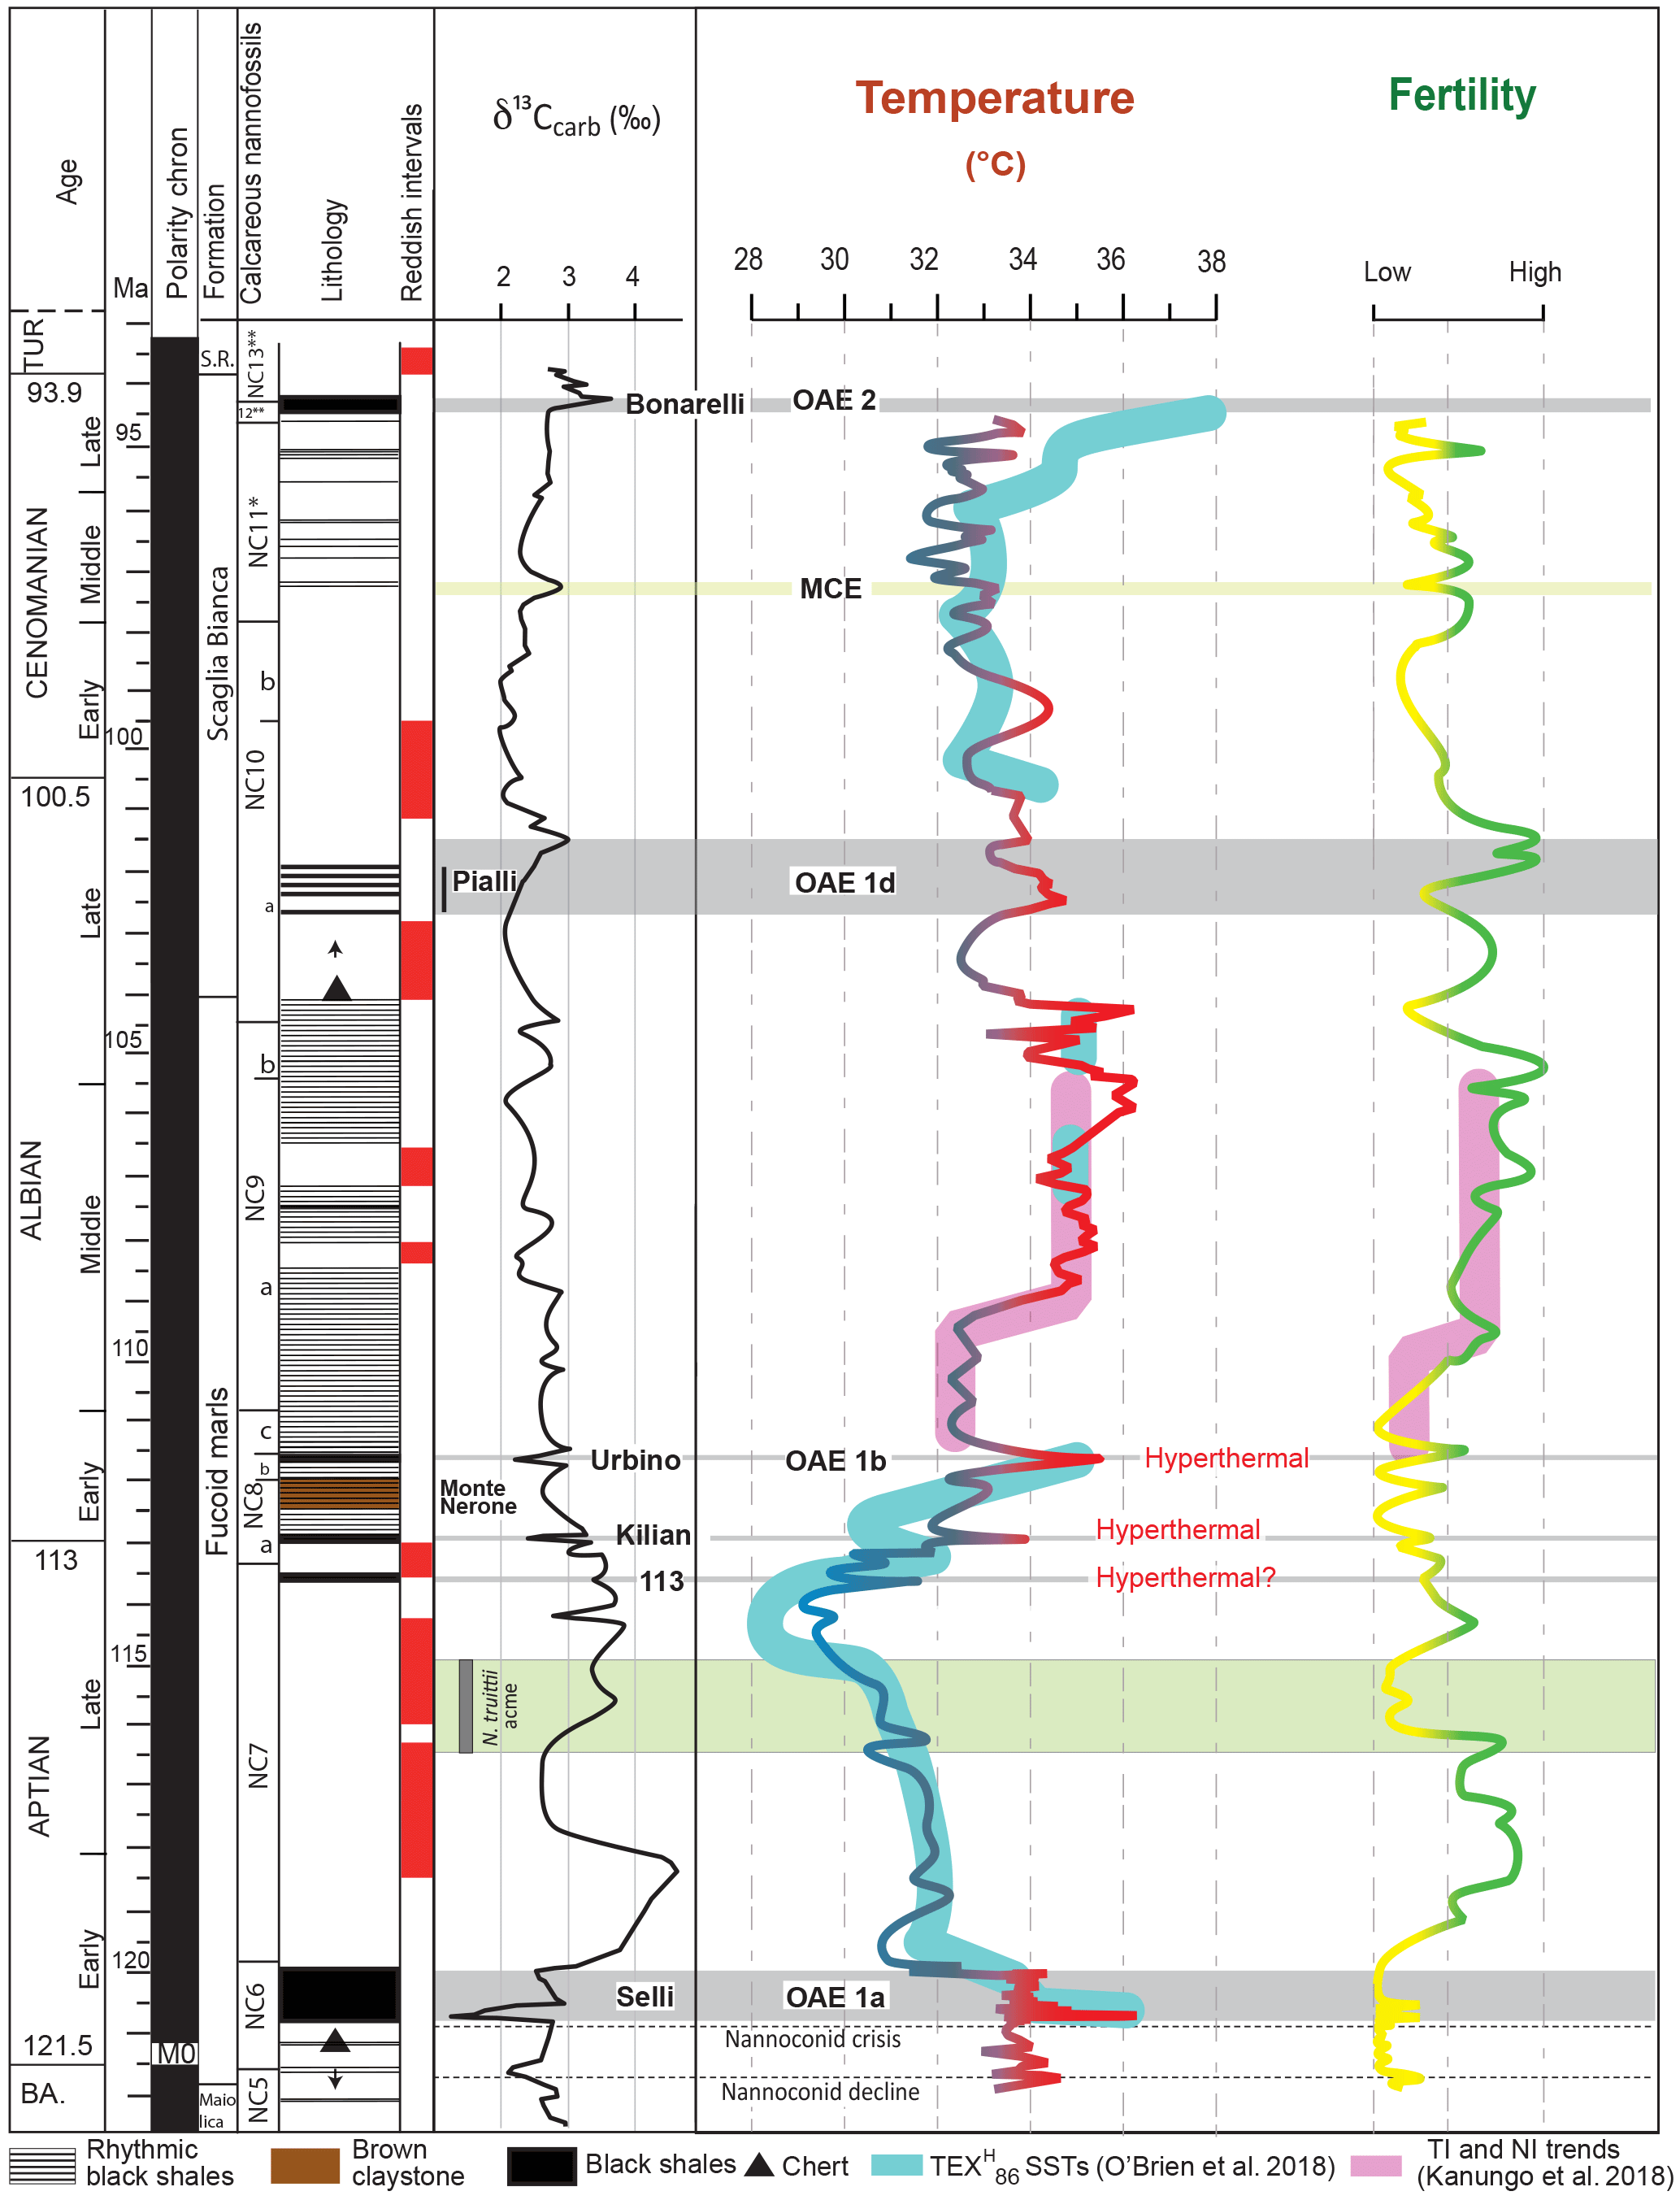
Figure 7Synthesis of nannofossil-based nutrient (NI) and temperature (m-TI) variations reconstructed in the western Tethys as in Fig. 6. Nannofossil-derived SSTs (∘C) are calibrated to TEX86 SSTs as in Fig. 6. Simplified TEX SSTs for ocean T > 15 ∘C (O'Brien et al., 2018) are reported in light blue. Middle Albian nannofossil TI and NI trends (pink lines) are from the Gault Clay Formation (Kanungo et al., 2018). Timescale is after Malinverno et al. (2010, 2012) for the late Barremian–Aptian and after the Geological Time Scale 2012 (Gradstein et al., 2012) for the Albian–Cenomanian.
The comparison of paleotemperatures reconstructed in this work, with average low-latitude TEX86 SSTs compiled by O'Brien et al. (2017), shows similar trends and temperature values for the Aptian and earliest Albian (Fig. 7). The middle Albian TEX86 SST record is instead limited to restricted intervals (middle part of nannofossil subzones NC9a and NC9b) but shows comparable range of temperatures to the m-TI SSTs. The m-TI also indicates similar SSTs to compiled TEX86 SSTs for the early and middle Cenomanian. The two paleotemperature proxies differ across the late Cenomanian, when TEX86 SSTs were 2 to 4 ∘C higher compared to calibrated m-TI.
4.3 Mid-Cretaceous environmental changes in the western Tethys: paleoceanographic implications
The temperature and fertility variations reconstructed for the latest Barremian to Cenomanian time interval (ca. 27 Ma) are discussed to derive causal or casual relationships with black shale deposition. It is not the purpose of this work to investigate the causes and processes that have induced the climatic and oceanographic changes identified.
The temperature and nutrient indices show long-term variations that are not systematically changing in phase or antiphase, suggesting that the two parameters were mostly independent from each other. The one-to-one correlation (Pearson correlation coefficient) of the TI and NI shows no significant correlation between the two factors (Furlo: ; Monte Petrano: ; Le Brecce: ). The record indicates, in fact, that intervals of higher fertility occurred during either warmer or cooler climatic conditions. An exception is represented by the hyperthermals (onset of OAE 1a, Kilian and Urbino levels), which consistently corresponded to higher fertility, although not statistically supported (through OAE 1a onset, OAE 1b and OAE 1d r<0.2; the TI–NI correlate only during the Kilian level r=0.97). Evidence for combined higher fertility and higher temperatures at the beginning of OAE 1a and across OAE 1b was additionally provided by nannofossil TI and NI at DSDP site 463 (Bottini et al., 2015) and from the Vocontian basin (Herrle et al., 2003a,b; Herrle 2003) and the Blake Nose (western Atlantic Ocean; Browning and Watkins 2008), respectively. The prolonged warm phase (ca. 4 Myr) identified in the middle Albian was also associated with long-lasting higher fertility. Calcareous nannofossil and oxygen isotope data (Kanungo et al., 2018) from the Gault Clay Formation (UK) show, similarly to the Tethys, an increase in temperature and fertility (Fig. 7) in the middle part of nannofossil subzone NC9a (middle Albian). Paleoenvironmental conditions across OAE 1d point to a warm climate and low fertility followed by lower temperature and higher fertility (Fig. 7). Similar paleotemperature and fertility fluctuations are recorded at supra-regional scale by nannofossil TI and NI from the Vocontian basin (Bornemann et al., 2005) and NI from the Blake Nose (western Atlantic Ocean, ODP Hole 1052; Watkins et al 2005). We therefore conclude that some of the climatic and fertility changes documented in the western Tethys were affecting the oceans at least at supra-regional scale.
In addition to OAEs, the Albian–Cenomanian record from the western Tethys is characterized by rhythmic black shales (Tiraboschi et al., 2009; Gambacorta et al., 2015) associated with varying long- and short-term climatic and fertility conditions. Specifically, in the early–middle Albian, anoxic sediments occurred under temperate and lower fertility conditions. But in the middle–late Albian, rhythmic black shales were associated with warm and generally more fertile surface waters. Lower–middle Albian black shales did not correspond to significant changes in surface water fertility or temperature, whereas intense warming and less fertile surface waters were reconstructed for middle–upper Albian black shales (Tiraboschi et al., 2009). These data suggest that fertility was not the primary factor controlling the deposition of rhythmic black shales, which were instead related to water stratification induced by lowered salinity (early–middle Albian) and warming (middle–late Albian).
Middle to late Cenomanian black shales (between the MCE I and the Bonarelli level) were mostly distributed during an interval of average lower fertility and temperate conditions, partly similar to those identified in the early Albian. In our record, the MCE I corresponds to the onset of more frequent climatic fluctuations evidenced by pulses of the abundant cold-water taxa R. parvidentatum and E. floralis. Previous works identified in the MCE I a turning point in the climatic and oceanographic regime leading to different paleoenvironmental conditions during the mid-Cenomanian (e.g., Erbacher and Thurow, 1997; Coccioni and Galeotti, 2003; Voigt et al., 2004; Friedrich et al., 2009; Zheng et al., 2016). Across middle–late Cenomanian black shales, short-term changes in nannofossil assemblages do not evidence a systematic increase in temperature or fertility during black shale deposition. These rhythmic anoxic intervals were suggested to derive from pulsed water stratification interrupted by intervals of bottom current activity, which temporarily restored oxygenated conditions (Gambacorta et al., 2016). A peculiar 200 kyr long interval preceding the Bonarelli level by ca. 400 kyr was marked by closely spaced black shales in a discrete interval of higher fertility and cooler conditions.
As discussed by Giorgioni et al. (2015), the late Albian change in sedimentation towards micritic pelagic limestones recognized in the Tethys and North Atlantic Ocean implies a major oceanic circulation rearrangement possibly derived from a much better connection between different oceanic basins and developed circulation mode. In the deep western Tethys, this time coincided with the shift from the Marne a Fucoidi varicolored marlstones and black shales to the Scaglia Bianca whitish limestones. The reconstructed TI–NI records (this work) indicate that such lithostratigraphic change corresponded to the end of the middle Albian warm phase and progressively decreasing temperatures. Calcareous nannofossil assemblages therefore provide evidence for a new paleoceanographic regime under improved interbasin connections and long-term sea level rise (e.g., Poulsen et al., 2003; Giorgioni et al., 2015). We notice that the upper Albian–lower Cenomanian Scaglia Bianca Formation is characterized by two intervals of red-colored limestones. Mid-Cretaceous red beds were interpreted to reflect good oxygenation, possibly induced by the inflow of colder and thus more oxygenated bottom waters (Hu et al., 2005). The presence of red beds also in correspondence to the late Aptian cooling and during the temporary and relative drop in temperatures during the middle Albian may further suggest that cooler climate influenced ocean oxygenation by promoting better oceanic circulation.
Quantitative analyses of nannofossil assemblages resulted in the first complete record of surface water temperature and fertility variations through the latest Barremian–Cenomanian interval (ca. 27 Myr) in the western Tethys (central Italy).
A modified nannofossil TI (m-TI), which takes into account the relative abundance of the warm-water species R. asper, is proposed to estimate the extent of the warming when the TI reaches the full-scale (zero) maximum warmth. The calibration of the m-TI with TEX86 SSTs allowed for the assignment of SST values to the m-TI. The warmest conditions in the Aptian (ca. 36 ∘C) were identified at the onset of OAE 1a. The middle–late Aptian was instead marked by the coolest conditions (ca. 29 ∘C) of the entire studied interval. Hyperthermals were recognized across the Aptian–Albian boundary interval in the 113 level (31 ∘C), Kilian level (34 ∘C) and Urbino level OAE 1b (36 ∘C), which was the last and most intense of the hyperthermals with temperatures similar to those estimated for the onset of OAE 1a. Similar high temperatures were reached in the middle Albian (34 ∘C-36 ∘C) that correspond to the most prolonged (ca. 4 Myr) warm phase of the studied interval. Temperate climate was instead reconstructed for the early Albian and the Cenomanian, although in the Cenomanian temperatures were strongly fluctuating between 32 and 34 ∘C.
SSTs in the western Tethys were similar to SSTs from other oceanic basins and different latitudes during the early Aptian, in the middle Albian and in the early–middle Cenomanian. During the late Aptian, the western Tethys SSTs were instead ca. 1 ∘C warmer than in the proto-North Atlantic, while in the late Cenomanian they were 2–4 ∘C cooler with respect to paleotemperatures of the equatorial Atlantic Ocean.
The Albian–Cenomanian rhythmic black shales were associated with varying long- and short-term climatic and fertility conditions: (i) temperate and lower fertility in the early–middle Albian, (ii) warm and generally more fertile surface waters in the middle–late Albian, and (iii) lower fertility and temperate conditions in the middle to late Cenomanian.
A peculiar black shale interval preceding the Bonarelli level by ca. 400 kyr occurred during a phase of higher fertility and cooler conditions.
The shift from the Marne a Fucoidi to the Scaglia Bianca Formation coincided with the end of the middle Albian warm phase and the onset of pelagic limestone deposition, reflecting a new paleoceanographic regime with possibly improved inter-oceanic connections under rising sea level.
The MCE I corresponded instead to the onset of more frequent climatic fluctuations and rhythmic black shales suggestive of alternated phases of water stratification and enhanced bottom current activity.
All intervals represented by red-colored lithologies, such as in the late Aptian, middle Albian and early Cenomanian, correspond to cooler conditions, possibly influencing the degree of oxygenation at the seafloor.
Calcareous nannofossils cited in this work
Biscutum Black in Black and Barnes, 1959
Biscutum constans (Górka, 1957) Black in Black and
Barnes,
1959
Discorhabdus Noël, 1965
Discorhabdus rotatorius (Bukry, 1969) Thierstein,
1973
Eprolithus Stover, 1966
Eprolithus floralis (Stradner, 1962) Stover,
1966
Repagulum Forchheimer, 1972
Repagulum parvidentatum (Deflandre and Fert, 1954)
Forchheimer,
1972
Rhagodiscus Reinhardt, 1967
Rhagodiscus asper (Stradner, 1963) Reinhardt,
1967
Staurolithites Caratini, 1963
Staurolithites stradneri (Rood et al., 1971) Bown,
1998
Watznaueria Reinhardt, 1964
Watznaueria barnesiae (Black, 1959) Perch-Nielsen,
1968
Zeugrhabdotus Reinhardt, 1965
Zeugrhabdotus diplogrammus (Deflandre in Deflandre
and Fert, 1954) Burnett in Gale et al.,
1996
Zeugrhabdotus erectus (Deflandre in Deflandre and
Fert, 1954) Reinhardt,
1965
Data presented in the paper can be accessed by contacting the corresponding author at cinzia.bottini@unimi.it.
CB and EE performed the calcareous nannofossil analyses and wrote the paper.
The authors declare that they have no conflict of interest.
We thank the two anonymous reviewers for their constructive comments, which
improved the paper, and the handling editor Luc Beaufort. The researchers were funded through SIR-2014
(Ministero dell'Istruzione, dell'Università e della Ricerca–Scientific
Independence of young Researchers) to Cinzia Bottini.
Edited by: Luc Beaufort
Reviewed by: two anonymous referees
Ando, A., Kaiho, K., Kawahata, H., and Kakegawa, T.: Timing and magnitude of early Aptian extreme warming: Unraveling primary δ18O variation in indurated pelagic carbonates at Deep Sea Drilling Project Site 463, central Pacific Ocean, Palaeogeogr. Palaeocl., 260, 463–476, 2008.
Beaudoin, B., M'Ban, E. P., Montanari, A., and Pinault, M.: Lithostratigraphie haute résolution (< 20 ka) dans le Cénomanien du bassin d'Ombrie-Marches (Italie), CR Acad. Sci., Paris, 323, Série Ila, 689–696, 1996.
Bellanca, A., Claps, M., Erba, E., Masetti, D., Neri, R., Premoli Silva, I., and Venezia, F.: Orbitally induced limestone/marlstone rhythms in the Albian-Cenomanian Cismon section (Venetian region, northern Italy): sedimentology, calcareous and siliceous plankton distribution, elemental and isotope geochemistry, Palaeogeogr. Palaeocl., 126, 227–260, 1996.
Bodin, S., Meissner, P., Janssen, N. M., Steuber, T., and Mutterlose, J.: Large igneous provinces and organic carbon burial: Controls on global temperature and continental weathering during the Early Cretaceous, Global Planet. Change, 133, 238–253, 2015.
Bonarelli, G.: Il territorio di Gubbio: Notizie geologiche, Tipografia Economica, Roma, Italy, p. 38, 1891.
Bornemann, A., Pross, J., Reichelt, K., Herrle, J. O., Hemleben, C., and Mutterlose, J.: Reconstruction of short term palaeoceanographic changes during the formation of the Late Albian – Niveau Breistroffer – black shales (Oceanic Anoxic Event 1d, SE France), J. Geol. Soc., 162, 623–639, 2005.
Bottini, C., Erba, E., Tiraboschi, D., Jenkyns, H. C., Schouten, S., and Sinninghe Damsté, J. S.: Climate variability and ocean fertility during the Aptian Stage, Clim. Past, 11, 383–402, https://doi.org/10.5194/cp-11-383-2015, 2015.
Bralower, T. J.: Calcareous nannofossil biostratigraphy assemblages of the Cenomanian-Turonian boundary interval: Implications for the origin and timing of oceanic anoxia, Paleoceanography, 3, 275–316, 1988.
Bralower, T. J., Leckie, R. M., Sliter, W. V., Thierstein, H. R.: An integrated Cretaceous timescale, in: Geochronology Time Scales and Global Stratigraphic Correlation, edited by: Berggren, W. A., Kent, D. V., Aubry, M.-P., and Hardenbol, J., SEPM Spec. P., 54, 65–79, 1995.
Browning, E. L. and Watkins, D. K.: Elevated primary productivity of calcareous nannoplankton associated with ocean anoxic event 1b during the Aptian/Albian transition (Early Cretaceous), Paleoceanography, 23, PA2213, https://doi.org/10.1029/2007PA001413, 2008.
Burnett, J. A.: Upper Cretaceous, in: Calcareous Nannofossil Biostratigraphy, edited by: Bown, P. R., Chapman and Hall, London, UK, 132–199, 1998.
Clarke, L. J. and Jenkyns, H. C.: New oxygen isotope evidence for long-term Cretaceous climatic change in the Southern Hemisphere, Geology, 27, 699–702, 1999.
Coccioni, R.: The Pialli Level from the latest Albian of the Umbria–Marche Apennines (Italy), GeoItalia, 38 Forum FIST, 192–193, 2001.
Coccioni, R. and Galeotti, S.: The mid-Cenomanian Event: prelude to OAE 2, Palaeogeogr. Palaeocl., 190, 427–440, 2003.
Coccioni, R., Nesci, O., Tramontana, M., Wezel, C. F., and Moretti, E.: Descrizione di un livelloguida “Radiolaritico-Bituminoso-Ittiolitico” alla base delle Marne a Fucoidi nell'Appennino Umbro-Marchigiano, Boll. Soc. Geol. Ital., 106, 183–192, 1987.
Coccioni, R., Franchi, R., Nesci, O., Wezel, F. C., Battistini, F., and Pallecchi, P.: Stratigraphy and mineralogy of the Selli Level (Early Aptian) at the base of the Marne a Fucoidi in the Umbro-Marchean Apennines, Italy. in: Cretaceous of the Western Tethys, edited by: Wiedmann, J., Proceedings 3rd International Cretaceous Symposium, Tübingen 1987, E. Schweizerbart'sche Verlagsbuchhandlung, Stuttgart, Germany, 563–584, 1989.
Coccioni, R., Erba, E., and Premoli Silva, I.: Barremian-Aptian calcareous plankton biostratigraphy from the Gorgo a Cerbara section (Marche, Central Italy) and implication for planktonic evolution, Cretaceous Res., 13, 517–537, 1992.
Dumitrescu, M., Brassell, S. C., Schouten, S., Hopmans, E. C., and Sinninghe Damsté, J. S.: Instability in tropical Pacific seasurface temperatures during the early Aptian, Geology, 34, 833–866, 2006.
Erba, E.: Aptian-Albian calcareous nannofossil biostratigraphy of the Scisti a Fucoidi cored at Piobbico (central Italy), Riv. Ital. Paleontol. S., 94, 249–284, 1988.
Erba, E.: Calcareous nannofossil distribution in pelagic rhythmic sediments (Aptian-Albian Piobbico core, central Italy), Riv. Ital. Paleontol. S., 97, 455–484, 1992a.
Erba, E.: Middle Cretaceous calcareous nannofossils from the Western Pacific (ODP Leg 129), Evidence for paleoequatorial crossing, Proc. ODP Sci. Res., 129, 189–201, 1992b.
Erba, E.: Nannofossils and superplumes: the early Aptian nannoconid crisis, Paleoceanography, 9, 483–501, 1994.
Erba, E., Coccioni, R., and Premoli Silva, I.: The “Scisti a Fucoidi” in the Umbria-Marche area: The Apecchiese road sections, Mem. Descr. Carta Geol. Ital., 39, 146–164, 1989.
Erba, E., Castradori, D., Guasti, G., and Ripepe, M.: Calcareous nannofossil and Milankovitch cycles: The example of the Albian Gault Clay Formation (southern England), Palaeogeogr. Palaeocl., 93, 47–69, 1992.
Erba E., Duncan R. A., Bottini C., Tiraboschi D., Weissert H., Jenkyns H. C., and Malinverno, A.: Environmental Consequences of Ontong Java Plateau and Kerguelen Plateau Volcanism, GSA Special Paper, 511, 271–303, https://doi.org/10.1130/2015.2511(15), 2015.
Erbacher, J. and Thurow, J.: Influence of oceanic anoxic events on the evolution of mid-Cretaceous radiolaria in the North Atlantic and western Tethys, Mar. Micropaleontol., 30, 139–158, 1997.
Föllmi, K. B.: Early Cretaceous life, climate and anoxia, Cretaceous Res., 35, 230–257, 2012.
Friedrich, O., Erbacher, J., Wilson, P. A., Moriya, K., and Mutterlose, J.: Paleoenvironmental changes across the Mid Cenomanian Event in the tropical Atlantic Ocean (Demerara Rise, ODP Leg 207) inferred from benthic foraminiferal assemblages, Mar. Micropaleontol., 71, 28–40, 2009.
Friedrich, O., Norris, R. D., and Erbacher, J.: Evolution of middle to Late Cretaceous oceans – a 55 my record of Earth's temperature and carbon cycle, Geology, 40, 107–110, 2012.
Galeotti, S., Sprovieni, M., Coccioni, R., Bellanca, A., Neri, R.: Orbitally modulated black shale deposition in the upper Albian Amadeus Segment (central Italy): A multi-proxy reconstruction, Palaeogeogr. Palaeocl., 190, 441–458, 2003.
Gambacorta, G., Bersezio, R., and Erba, E.: Sedimentation in the Tethyan pelagic realm during the Cenomanian: Monotonous settling or active redistribution?, Paleoceanogr. Paleocl. 409, 301–319, 2014.
Gambacorta, G., Jenkyns, H. C., Russo, F., Tsikos, H., Wilson, P. A., Faucher, G., and Erba, E.: Carbon-and oxygen-isotope records of mid-Cretaceous Tethyan pelagic sequences from the Umbria–Marche and Belluno Basins (Italy), Newsl. Stratigr., 48, 299–323, 2015.
Gambacorta, G., Bersezio, R., Weissert, H., and Erba, E.: Onset and demise of Cretaceous oceanic anoxic events: The coupling of surface and bottom oceanic processes in two pelagic basins of the western Tethys, Paleoceanography, 31, 732–757, 2016.
Giorgioni, M., Weissert, H., Bernasconi, S. M., Hochuli, P. A., Coccioni, R., and Keller, C. E.: Orbital control on carbon cycle and oceanography in the mid-Cretaceous greenhouse, Paleoceanography, 27, PA1204, https://doi.org/10.1029/2011PA002163, 2012.
Giorgioni, M., Weissert, H., Bernasconi, S. M., Hochuli, P. A., Keller, C. E., Coccioni, R., Petrizzo, M. R., Lukeneder, A., Garcia, T.I.: Paleoceanographic changes during the Albian–Cenomanian in the Tethys and North Atlantic and the onset of the Cretaceous chalk, Global Planet. Change 126, 46–61, 2015.
Gradstein, F. M., Ogg, J. G., Schmitz, M. D., and Ogg, G. M.: The Geologic Time Scale 2012, Elsevier B.V., Amsterdam, the Netherlands, 2, 793–853, 2012.
Hardas, P., Mutterlose, J., Friedrich, O., and Erbacher, J.: The Middle Cenomanian Event in the equatorial Atlantic: the calcareous nannofossil and benthic foraminiferal response, Mar. Micropaleontol., 96, 66–74, 2012.
Herbert, T. D. and Fischer, A. G.: Milankovitch climatic origin of Mid-Cretaceous black shale rhythms in central Italy, Nature, 321, 739–743, https://doi.org/10.1038/321739a0, 1986.
Herrle, J. O.: Paleoceanographic and paleoclimatic implications on mid-Cretaceous black shale formation in the Vocontian Basin and the Atlantic. Evidence from calcareous nannofossils and stable isotopes, Tübinger Mikropaläontol. Mittell., 27, 1–114, 2002.
Herrle, J. O.: Reconstructing nutricline dynamics of Mid-Cretaceous oceans: Evidence from calcareous nannofossils from the Niveau Paquier black shale (SE France), Mar. Micropaleontol., 47, 307–321, 2003.
Herrle, J. O. and Mutterlose, J.: Calcareous nannofossils from the Aptian–Lower Albian southeast France: paleoecological and biostratigraphic implication, Cretaceous. Res., 24, 1–22, 2003.
Herrle, J. O., Pross, J., Friedrich, O., Kössler, P., and Hemleben, C.: Forcing mechanisms for Mid-Cretaceous black shale formation: Evidence from the upper Aptian and lower Albian of the Vocontian Basin (SE France), Palaeogeogr. Palaeocl., 190, 399–426, 2003a.
Herrle, J. O., Pross, J., Friedrich, O., and Hemleben, C.: Short-term productivity changes in the Cretaceous Tethyan ocean: Evidence from the early Albian oceanic anoxic event 1b, Terra Nova, 15, 14–19, 2003b.
Herrle, J. O., Kosler, P., and Bollmann, J.: Palaeoceanographic differences of early Late Aptian black shale events in the Vocontian Basin (SE France), Palaeogeogr. Palaeocl., 297, 367–376, 2010.
Hochuli, P. A., Menegatti, A. P., Weissert, H., Riva, A., Erba, E., Premoli and Silva, I.: Episodes of high productivity and cooling in the early Aptian Alpine Tethys, Geology, 27, 657–660, 1999.
Hu, X., Kuidong, Z., Yilmaz, I. O., and Yongxiang, L.: Stratigraphic transition and palaeoenvironmental changes from the Aptian oceanic anoxic event 1a (OAE1a) to the oceanic red bed 1 (ORB1) in the Yenicesihlar section, central Turkey, Cretaceous Res., 38, 40–51, 2012.
Jenkyns, H. C.: Geochemistry of oceanic anoxic events, Geochem. Geophy. Geosy., 11, Q03004, https://doi.org/10.1029/2009GC002788, 2010.
Kanungo, S., Bown, P. R., Young, J. R., and Gale, A. S.: A brief warming event in the late Albian: evidence from calcareous nannofossils, macrofossils, and isotope geochemistry of the Gault Clay Formation, Folkestone, southeastern England, J. Micropalaeontol., 37, 231–247, 2018.
Kemper, E.: Das Klima der Kreide-Zeit, Geologisches Jahrbuch A, 96, 5–185, 1987 (in German).
Lanci, L., Muttoni, G., and Erba, E.: Astronomical tuning of the Cenomanian Scaglia Bianca Formation at Furlo, Italy, Earth Planet. Sc. Lett., 292, 231–237, 2010.
Malinverno, A., Erba, E., and Herbert, T. D.: Orbital tuning as an inverse problem: Chronology of the early Aptian oceanic anoxic event 1a (Selli Level) in the Cismon APTICORE, Paleoceanography, 25, PA2203, https://doi.org/10.1029/2009PA001769, 2010.
Malinverno, A., Hildebrandt, J., Tominaga, M., and Channell, J. E. T.: M-sequence geomagnetic polarity time scale (MHTC12) that steadies global spreading rates and incorporates astrochronology constraints, J. Geophys. Res., 117, B06104, https://doi.org/10.1029/2012JB009260, 2012.
McAnena, A., Flögel, S., Hofmann, P., Herrle, J. O., Griesand, A., Pross, J., Talbot, H. M., Rethemeyer, J., Wallmann, K., and Wagner, T.: Atlantic cooling associated with a marine biotic crisis during the mid-Cretaceous period, Nat. Geosci., 6, 558–651, 2013.
Millán, M. I., Weissert, H. J., and López-Horgue, M. A.: Expression of the Late Aptian cold snaps and the OAE1b in a highly subsiding carbonate platform (Aralar, northern Spain), Palaeogeogr. Palaeocl., 411, 167–179, 2014.
Mitchell, R. N., Bice, D. M., Montanari, A., Cleaveland, L. C., Christianson, K. T., Coccioni, R., and Hinnov, L. A.: Oceanic anoxic cycles? Orbital prelude to the Bonarelli Level (OAE 2), Earth Planet. Sc. Lett. 267, 1–16, 2008.
Mutterlose, J.: Migration and evolution patterns of floras and faunas in marine Early Cretaceous sediments of NW Europe, Palaeogeogr. Palaeocl., 94, 261–282, 1992.
Mutterlose, J. and Bottini, C.: Early Cretaceous chalks from the North Sea giving evidence for global change, Nat. Commun., 4, 1686, https://doi.org/10.1038/ncomms2698, 2013.
Mutterlose, J., Bornemann, A., and Herrle, J. O.: Mesozoic calcareous nannofossils – state of the art, Palaeont. Z., 79, 113–133, 2005.
Mutterlose, J., Bornemann, A., and Herrle, J.: The Aptian–Albian cold snap: Evidence for “mid” Cretaceous icehouse interludes, Neues Jahrb. Geol. P.-A., 252, 217–225, 2009.
Mutterlose, J., Bottini, C., Schouten, S., and Sinninghe Damsté, J. S.: High sea-surface temperatures during the early Aptian OAE 1a in the Boreal Realm, Geology, 42, 439–442, 2014.
O'Brien, C. L., Robinson, S. A., Pancost, R. D., Damsté, J. S. S., Schouten, S., Lunt, D. J., Alsenz, H., Bornemann, A., Bottini, C., Brassell, S. C., Farnsworth, A., Forster, A., Huber, B. T., Inglis, G. N., Jenkyns, H. C., Linnert, C., Littler, K., Markwick, P., McAnena, A., Mutterlose, J., Naafs, B. D. A., Püttmann, W., Sluijs, A., van Helmond, A. G. M., Vellecoop, J., Wagner, T. and Wrobel, N. E.: Cretaceous sea-surface temperature evolution: Constraints from TEX86 and planktonic foraminiferal oxygen isotopes, Earth-Sci. Rev., 172, 224–247, 2017.
Pauly, S., Mutterlose, J., and Alsen, P.: Early Cretaceous palaeoceanography of the Greenland–Norwegian Seaway evidenced by calcareous nannofossils, Mar. Micropaleontol., 90, 72–85, 2012.
Poulsen, C. J., Barron, E. J., Arthur, M. A., and Peterson, W. H.: Response of the mid-Cretaceous global oceanic circulation to tectonic and CO2 forcings. Paleoceanography, 16, 576–592, 2001.
Premoli Silva, I., Ripepe, M., and Tornaghi, M. E.: Planktonic foraminiferal distribution record productivity cycles: evidence from the Aptian-Albian Piobbico core (central Italy), Terra Nova, 1, 443–448, 1989a.
Premoli Silva, I., Erba, E., and Tornaghi, M. E.: Paleoenvironmental signals and changes in surface fertility in mid-Cretaceous Corg-rich pelagic facies of the Fucoid Marls (central Italy), Geobios, Mémoire Spécial, 11, 225–236, 1989b.
Price, G. D.: The evidence and implications of polar ice during the Mesozoic, Earth-Sci. Rev., 48, 183–210, 1999.
Roth, P. H.: Cretaceous nannoplankton biostratigraphy and oceanography of the northwestern Atlantic Ocean, Initial Reports of the Deep Sea Drilling Project, 44, 731–759, https://doi.org/10.2973/dsdp.proc.44.134.1978, 1978.
Roth, P. H. and Krumbach, K. R.: Middle Cretaceous calcareous Nannofossil biogeography and preservation in the Atlantic and Indian oceans: implication for paleogeography, Mar. Micropaleontol., 10, 235–266, 1986.
Schouten, S., Hopmans, S., Forster, A., Van Breugel, Y., Kuypers, M. M. M., and Sinninghe Damsté, J. S.: Extremely high seasurface temperatures at low latitudes during the middle Cretaceous as revealed by archaeal membrane lipids, Geology, 31, 1069–1072, 2003.
Schwarzacher, W.: Cyclostratigraphy of the Cenomanian in the Gubbio district, Italy: a field study, in: Orbital forcing and cyclic sequences, edited by: de Boer, P. L. and Smith, D. G., Sp. Publ. Int., 19, 99–107, 1994.
Sissingh, W.: Biostratigraphy of Cretaceous calcareous nannoplankton, Geol. Mijnbouw, 56, 37–65, 1977.
Thierstein, H. R. and Roth, P. H.: Stable isotopic and carbonate cyclicity in Lower Cretaceous deep-sea sediments: Dominance of diagenetic effects, Mar. Geol., 97, 1–34, 1991.
Tiraboschi, D., Erba, E., and Jenkyns, H. C.: Origin of rhythmic Albian black shales (Piobbico core, central Italy) Calcareous nannofossil quantitative and statistical analysis and paleoceanographic reconstructions, Paleoceanography, 24, PA2222, https://doi.org/10.1029/2008PA001670, 2009.
Tremolada, F., Erba, E., and Bralower, T. J.: Late Barremian to Early Aptian calcareous nannofossil paleoceanography and paleoecology from the Ocean Drilling Program Hole 641C (Galicia Margin), Cretaceous. Res., 87, 887–897, 2006.
Tsikos, H., Jenkyns, H. C., Walsworth-Bell, B., Petrizzo, M. R., Forster, A., Kolonic, S., Erba, E., Premoli Silva, I., Baas, M., Wagner, T., and Sinninghe Damsté, J. S.: Carbon- isotope stratigraphy recorded by the Cenomanian–Turonian Oceanic Anoxic Event: correlation and implications based on three key localities, J. Geol. Soc. London 161, 711–719, 2004.
Voigt, S., Gale, A. S., and Flögel, S.: Midlatitude shelf seas in the Cenomanian-Turonian greenhouse world: Temperature evolution and North Atlantic circulation, Paleoceanography, 19, PA4020, https://doi.org/10.1029/2004PA001015, 2004.
Watkins, D. K.: Nannoplankton productivity fluctuations and rhythmically-bedded pelagic carbonates of the Greenhorn Limestone (Upper Cretaceous), Palaeogeogr. Palaeocl., 74, 75–86, 1989.
Watkins, D. K., Cooper, M. J., and Wilson, P. A.: Calcareous nannoplankton response to late Albian oceanic anoxic event 1d in the western North Atlantic, Paleoceanography and Paleoclimatology, 20, PA2010, https://doi.org/10.1029/2004PA001097, 2005.
Weissert, H. and Erba, E.: Volcanism, CO2 and palaeoclimate: a Late Jurassic–Early Cretaceous carbon and oxygen isotope record, J. Geol. Soc. London, 161, 695–702, 2004.
Williams, J. R. and Bralower, T. J.: Nannofossil assemblage, fine fraction stable isotopes, and the paleoceanography of the Valanginian-Barremian (Early Cretaceous) North Sea Basin, Paleoceanography, 10, 815–839, 1995.
Wise, S. W. : Mesozoic-Cenozoic history of calcareous nannofossils in the region of the Southern Ocean, Palaeogeogr. Palaeocl., 67, 157–179, 1988.
Zheng, D., Zhang, Q., Chang, S. C., and Wang, B.: A new damselfly (Odonata: Zygoptera: Platystictidae) from mid-Cretaceous Burmese amber, Cretaceous Res., 63, 142–147, 2016.