the Creative Commons Attribution 4.0 License.
the Creative Commons Attribution 4.0 License.
 | 08 Oct 2018
Ice core evidence for decoupling between midlatitude atmospheric water cycle and Greenland temperature during the last deglaciation
Amaëlle Landais
Emilie Capron
Valérie Masson-Delmotte
Samuel Toucanne
Rachael Rhodes
Trevor Popp
Bo Vinther
Bénédicte Minster
Frédéric Prié
The last deglaciation represents the most recent example of natural global warming associated with large-scale climate changes. In addition to the long-term global temperature increase, the last deglaciation onset is punctuated by a sequence of abrupt changes in the Northern Hemisphere. Such interplay between orbital- and millennial-scale variability is widely documented in paleoclimatic records but the underlying mechanisms are not fully understood. Limitations arise from the difficulty in constraining the sequence of events between external forcing, high- and low- latitude climate, and environmental changes.
Greenland ice cores provide sub-decadal-scale records across the last deglaciation and contain fingerprints of climate variations occurring in different regions of the Northern Hemisphere. Here, we combine new ice d-excess and 17O-excess records, tracing changes in the midlatitudes, with ice δ18O records of polar climate. Within Heinrich Stadial 1, we demonstrate a decoupling between climatic conditions in Greenland and those of the lower latitudes. While Greenland temperature remains mostly stable from 17.5 to 14.7 ka, significant change in the midlatitudes of the northern Atlantic takes place at ∼16.2 ka, associated with warmer and wetter conditions of Greenland moisture sources. We show that this climate modification is coincident with abrupt changes in atmospheric CO2 and CH4 concentrations recorded in an Antarctic ice core. Our coherent ice core chronological framework and comparison with other paleoclimate records suggests a mechanism involving two-step freshwater fluxes in the North Atlantic associated with a southward shift of the Intertropical Convergence Zone.
- Article
(823 KB) -
Supplement
(443 KB) - BibTeX
- EndNote


The last deglaciation (∼19 000 to 11 000 years before present, ka) is the most recent major reorganization of global climate and is thus extensively documented by proxy records from natural climate archives. The wealth of high-resolution records from well-dated archives and data synthesis obtained over the past decades show two modes of climate variability during this period (e.g., Denton et al., 2010; Clark et al., 2012). The first is a long-term increase in global surface temperature and atmospheric CO2 concentration between 18 and 11 ka. Superimposed on this is a sequence of centennial-scale transitions between three quasi-stable intervals documented in Northern Hemisphere temperature, namely (i) the Heinrich Stadial 1 (∼17.5–14.7 ka) that encompasses the massive rafting episode known as Heinrich event 1 (from ∼16 ka); (ii) the Bølling–Allerød warming phase (∼14.7 to 12.9 ka); and (iii) the Younger Dryas cold phase (∼12.9 to 11.7 ka). This three-step sequence coincides with rapid variations in the Atlantic Meridional Oceanic Circulation (AMOC) (McManus et al., 2004), with evidence for a weak meridional overturning in the North Atlantic during the cold period encompassing Heinrich Stadial 1 and the Younger Dryas.
Our understanding of the mechanisms at play during these North Atlantic cold phases remains limited. First, recent studies challenge the earlier attribution of the AMOC slowdown during Heinrich Stadial 1 to the impact of the iceberg rafted debris (IRD) from the Laurentide ice sheet through Hudson Strait (Álvarez-Solas et al., 2011). In particular, meltwater releases from the European ice sheet occurring as early as 19 or 20 ka may have played an important role in this AMOC slowdown (Toucanne et al., 2010; Stanford et al., 2011; Hodell et al., 2017).
Second, major global reorganizations of the hydrological cycle have been demonstrated during Heinrich Stadial 1. They can be separated into two phases. In North America, a first time interval characterized by low lake levels (referred to as the “big dry”, 17.5 to 16.1 ka) was followed by a second time interval with high lake levels (referred to as the “big wet”, 16.1 to 14.7 ka) (Broecker et al., 2012), both apparently occurring during a stable cold phase in Greenland temperature. The second phase of Heinrich Stadial 1 is also associated with a weak East Asian monsoon interval (Zhang et al., 2014) understood to reflect a southward shift of the Intertropical Convergence Zone (ITCZ). While there is growing evidence for large-scale reorganizations of climate and low-latitude to midlatitude atmospheric water cycle within Heinrich Stadial 1, the exact sequence of events is not known with sufficient accuracy to understand the links between changes in North Atlantic climate, AMOC, and the lower-latitude water cycle.
Linking changes in the high latitudes of the North Atlantic and the middle to low latitudes requires precise absolute chronologies such as those obtained from annual layer counting of Greenland ice (e.g., Andersen et al., 2006) or U ∕ Th dating of speleothems (e.g., Zhang et al., 2014). Unfortunately, absolute dating uncertainties increase above 100 years during the last deglaciation, precluding a direct comparison of proxy records at the centennial scale. In this study, we circumvent this difficulty by using proxy records measured on Greenland ice cores that represent both Greenland temperature and midlatitude moisture source conditions.
Here, we present new water isotope records (δ18O, d-excess = δD − 8×δ18O, 17O-excess = ln()) from the NGRIP ice core (NGRIP community members, 2004) reported on the annual-layer-counted Greenland Ice Core Chronology 2005 (hereafter GICC05, Rasmussen et al., 2006; Svensson et al., 2008) and associated with relatively small absolute uncertainties over the last deglaciation (maximum counting error of 100–200 years). Other Greenland and Antarctic ice cores have been aligned on the GICC05 chronology, with a maximum relative dating uncertainty of 400 years over the last deglaciation (Rasmussen et al., 2008; Bazin et al., 2013; Veres et al., 2013).
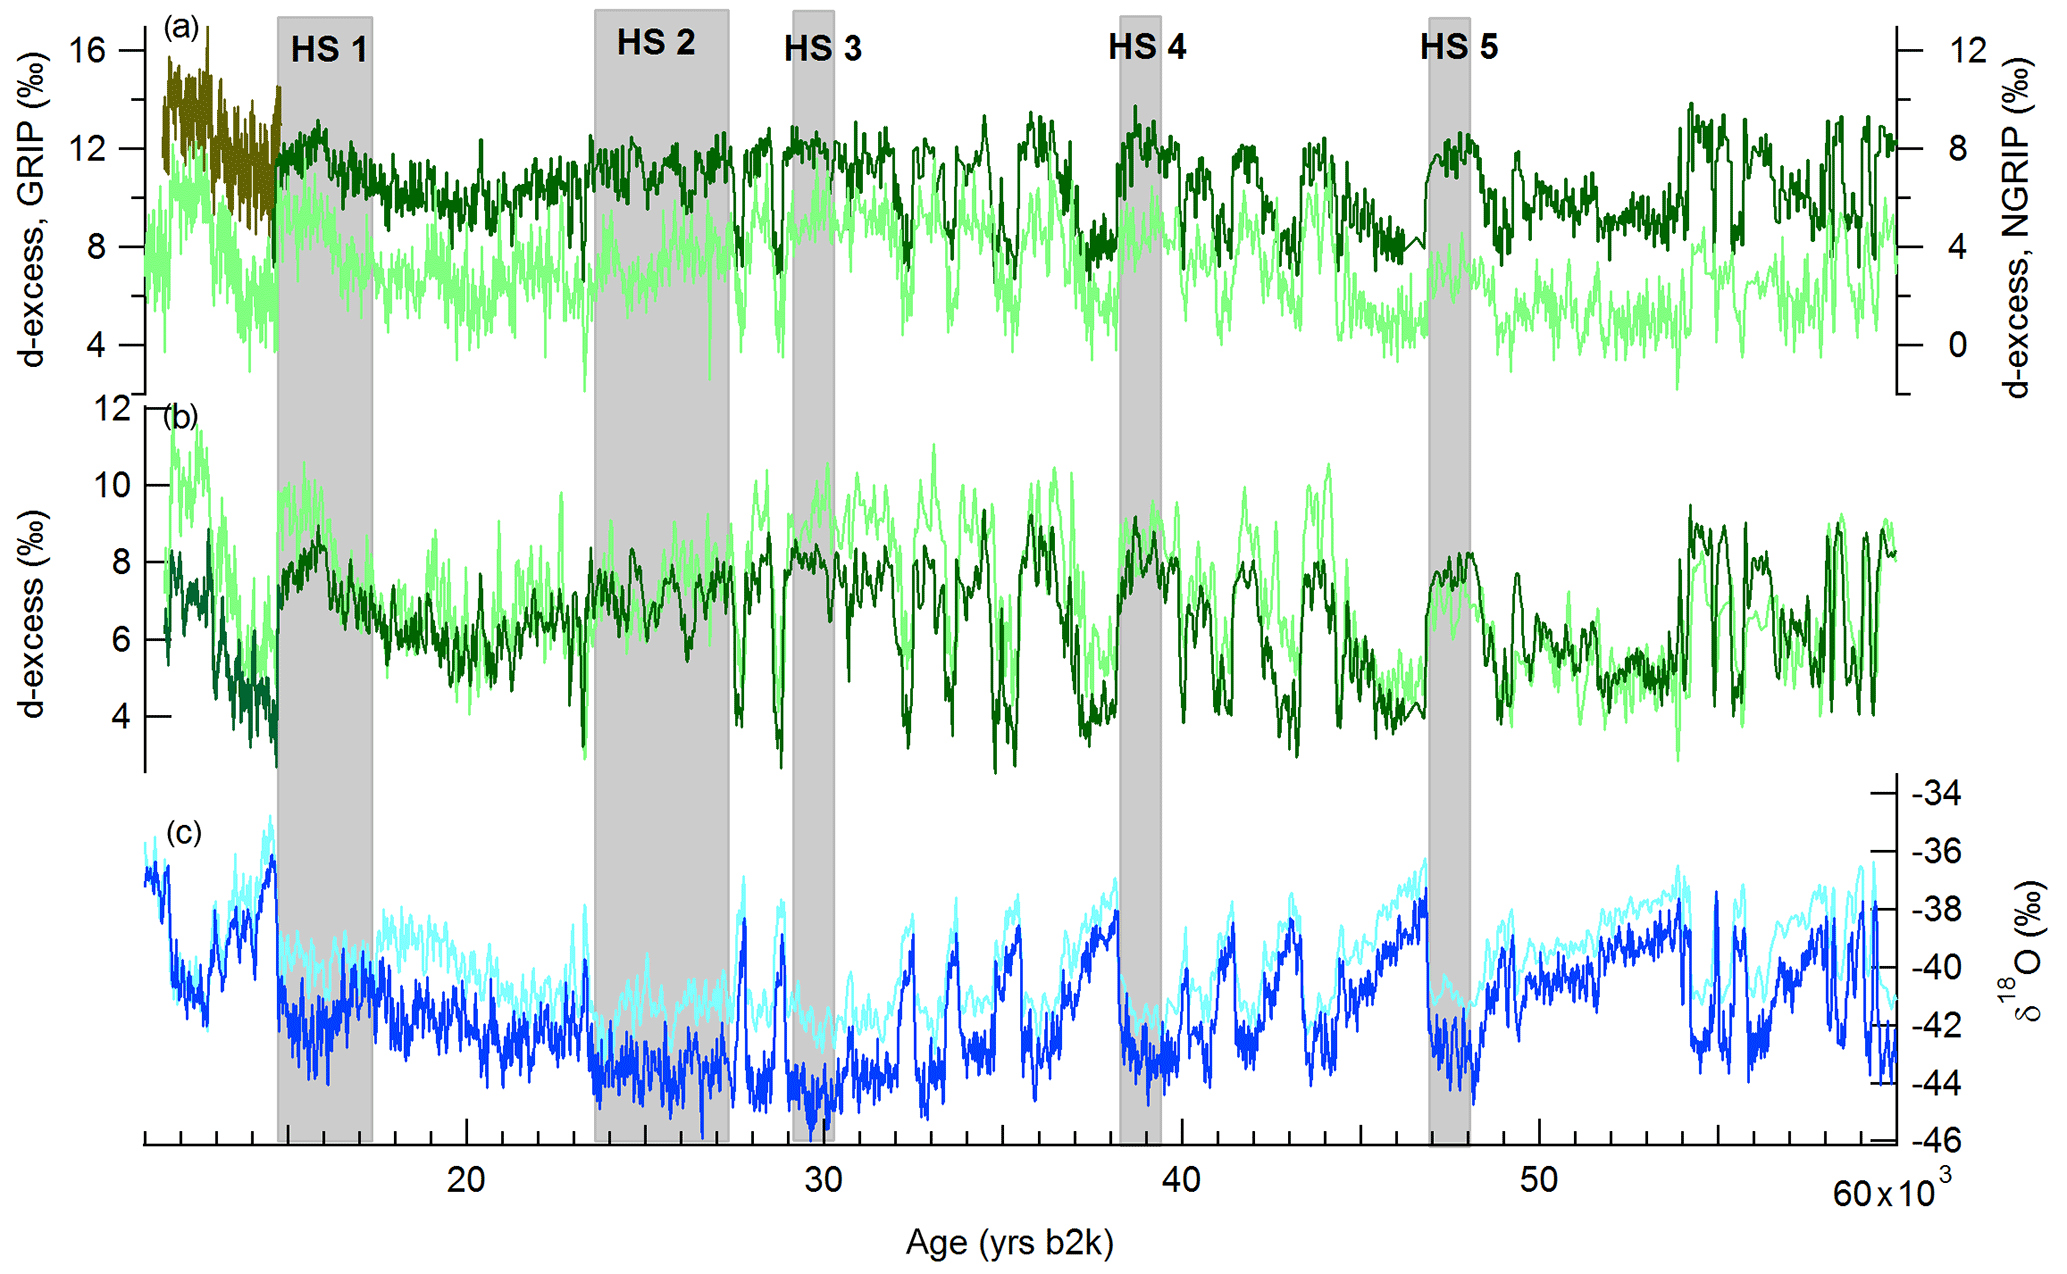
Figure 1Water stable isotope records (δ18O and d-excess, in ‰) from GRIP and NGRIP ice cores reported on the GICC05 chronology (in thousands of years before year 2000 CE). (a) D-excess from the NGRIP ice core (khaki: data obtained at INSTAAR SIL, Steffensen et al., 2008; dark green: data obtained at LSCE, this study); d-excess from the GRIP ice core (light green, Masson-Delmotte et al., 2005); (b) d-excess from the NGRIP ice core after correction of the shift between the INSTAAR SIL and LSCE (dark green) datasets, and d-excess from the GRIP ice core (light green); C-δ18O from the NGRIP ice core (dark blue) datasets, δ18O from the GRIP ice core (light blue). Grey intervals display Heinrich Stadials (HS).
The new NGRIP δ18O and δD dataset was obtained at Laboratoire des Sciences du Climat et de l'Environnement (LSCE) using a Picarro laser cavity ring-down spectroscopy (CRDS) analyzer. The accuracy for δ18O and δD measurements displayed here is about 0.1 ‰ and 1 ‰, respectively. This new dataset completes the NGRIP high-resolution isotopic dataset published over the time period 11.5 to 14.7 ka with δ18O and δD measured respectively at the University of Copenhagen and at the Institute of Arctic and Alpine Research (INSTAAR) Stable Isotope Lab (SIL) (University of Colorado). δ18O analyses were performed at the Niels Bohr Institute (University of Copenhagen) using a CO2 equilibration technique (Epstein et al., 1953) with an analytical precision of 0.07 ‰. δD measurements at INSTAAR were made via an automated uranium reduction system coupled to a VG SIRA II dual-inlet mass spectrometer (Vaughn et al., 1998). Analytical precision for δD is ±0.5 ‰ or better. Both time series show similar δ18O values, in agreement with the reference δ18O series for NGRIP over the last climatic cycle (NGRIP community members, 2004) within error bars. However, while both LSCE and INSTAAR SIL d-excess time series display the same 3.5 ‰ decrease over the onset of Bølling–Allerød, the mean d-excess level differs by 2.5 ‰ between the two records. Despite several home standard intercalibrations between the two laboratories, this difference remains unexplained and prevents any further discussion on the absolute NGRIP d-excess levels. The new and published NGRIP d-excess datasets are combined after a shift of the INSTAAR SIL d-excess series by −2.5 ‰.
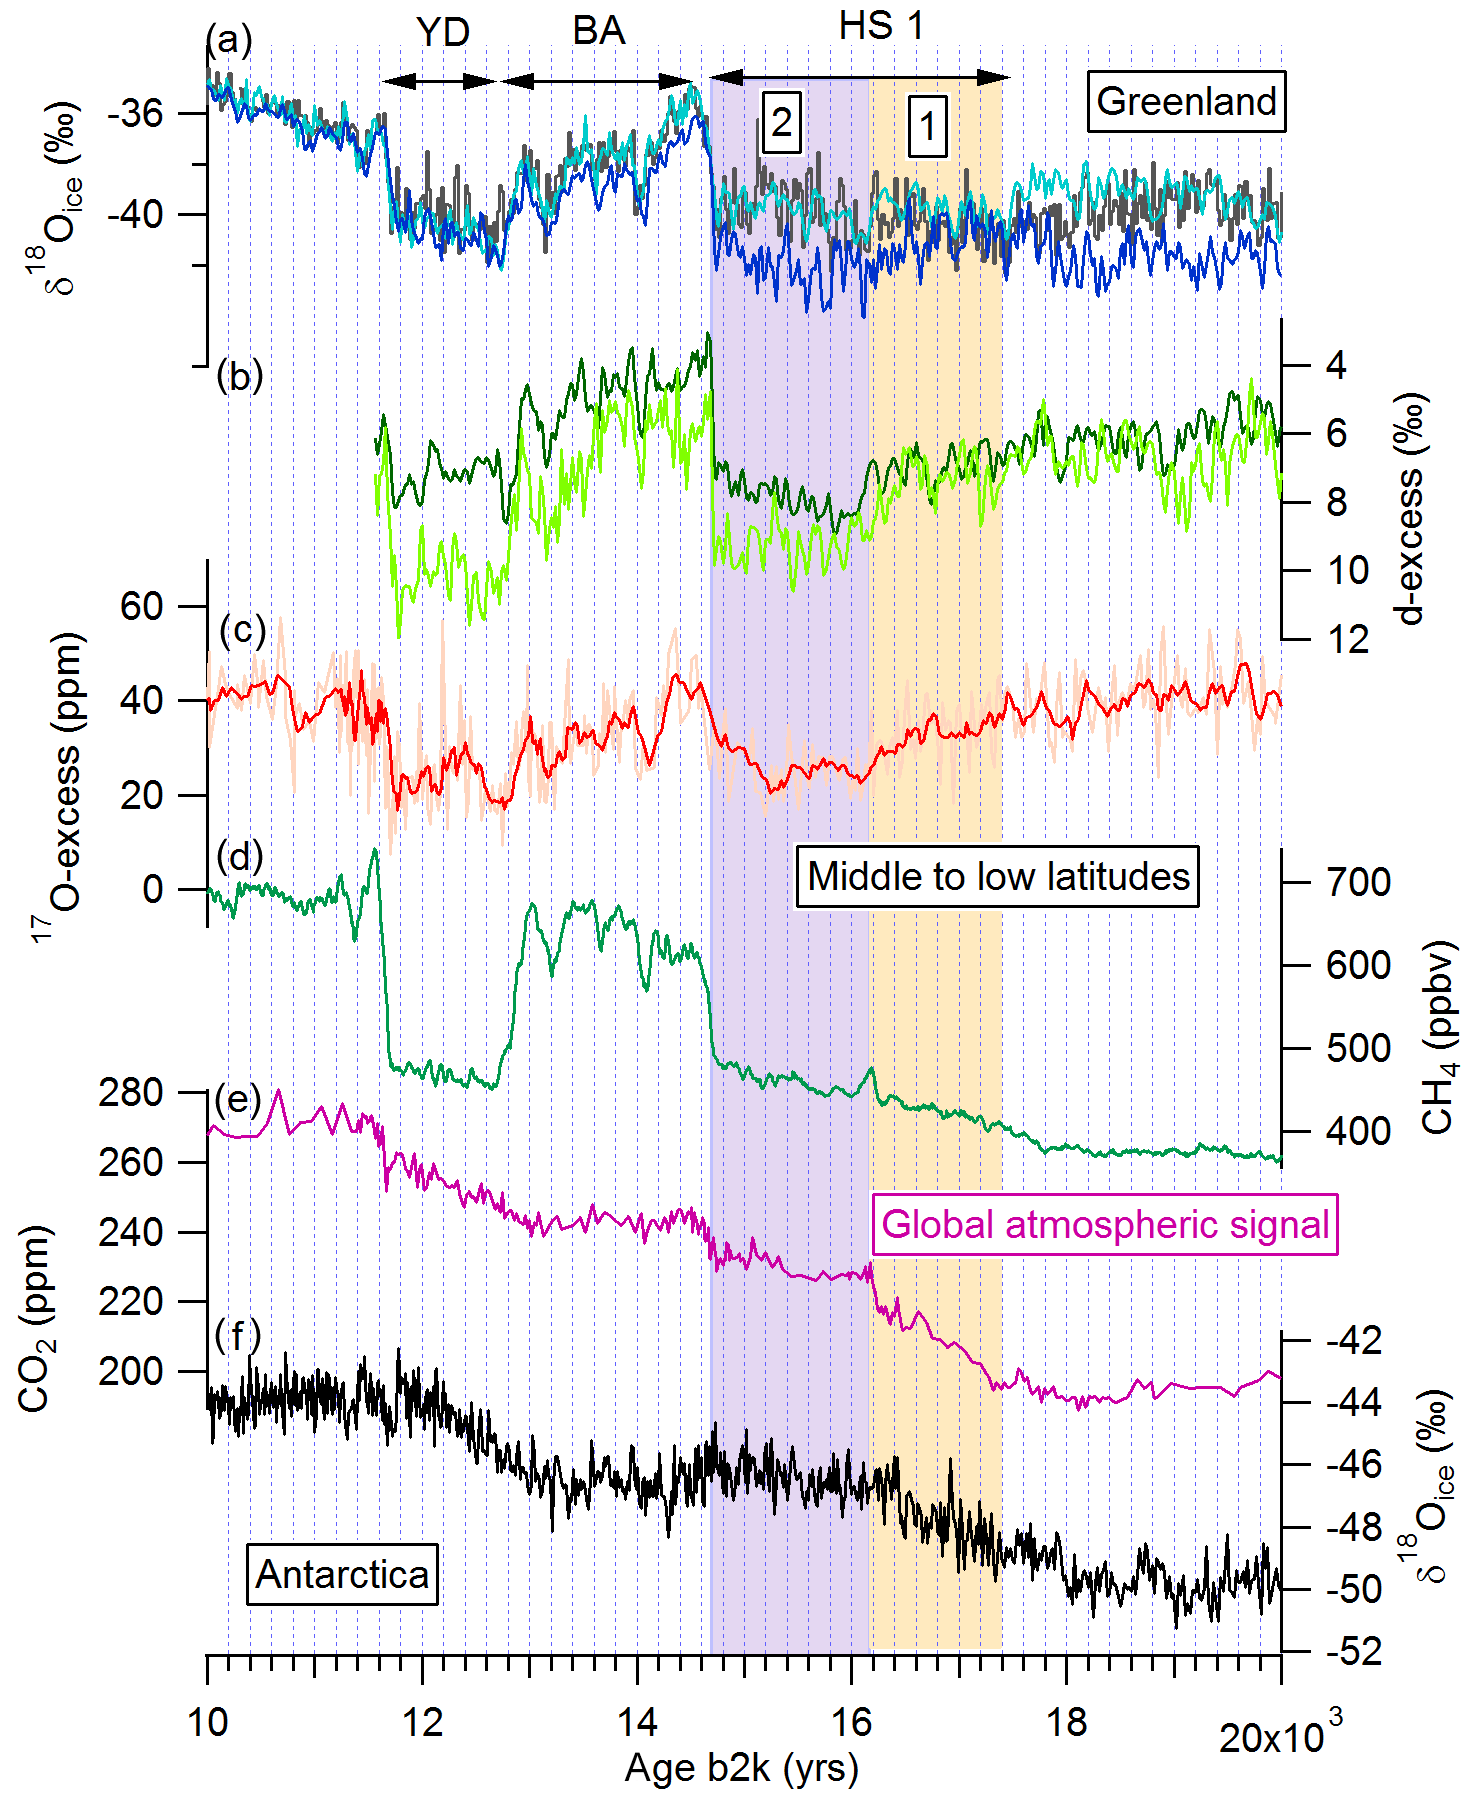
Figure 2A synthesis of ice core records over the last deglaciation displayed on the respective GICC05 and AICC2012 timescales with an identification of two phases (1, orange box; 2, purple box) within Heinrich Stadial 1 (HS1) as discussed in the text: we locate the transition between phases 1 and 2 at the timing of the sharp increase in CO2 and CH4 concentrations, both being global atmospheric composition signals. The Younger Dryas (YD) and Bølling–Allerød (BA) periods are also indicated. (a) GRIP, NGRIP, and GISP2 δ18O (light blue, dark blue, and black, respectively; Grootes et al., 1993; NGRIP community members, 2004) interpolated at a 20-year resolution; (b) GRIP and NGRIP d-excess (light and dark green, respectively; Jouzel et al., 2005, this study) interpolated at a 20-year resolution; (c) NGRIP 17O-excess (orange curve shows the original series and the red curve the 5-year running average; this study); (d) WAIS Divide CH4 (Rhodes et al., 2015); (e) WAIS Divide CO2 (Marcott et al., 2013); (f) EPICA Dronning Maud Land (EDML) δ18Oice (EPICA community members, 2006).
In order to perform 17O-excess measurements on water samples at LSCE, we follow the method described in details in Barkan and Luz (2005). In short, for each sample, 2 µL of water is injected into a helium flow purified by passing through a trap immersed in liquid nitrogen. Water vapor then reacts with CoF3 (producer Sigma-Aldrich) in a nickel tube heated at 370 ∘C to produce oxygen and hydrofluoric acid, which is trapped in liquid nitrogen at the outlet of the nickel tube. Oxygen is first trapped in a molecular sieve tube immersed in liquid nitrogen and then separated from helium and purified through two cycles of warming (+30 ∘C) and cooling (−196 ∘C) of the tube with molecular sieves. The oxygen is finally trapped in a manifold immersed in liquid helium. The produced oxygen is injected into the mass spectrometer (MAT 253) and analysed by dual inlet against a reference O2 gas (two runs of 20 measurements).
Every day, at least one home standard is run with the batch of samples to check the stability of the fluorination line and mass spectrometer. In addition, a series of three water home standards, whose δ18O and δ17O values are calibrated on the SMOW–SLAP scale following Schoenemann et al. (2013), is run at least every month. For this study, the SMOW–SLAP-calibrated home standards have δ18O values of −18.64 ‰, −33.56 ‰, and −54.05 ‰, respectively, hence bracketing the δ18O values of the measured samples. The comparison of the measured and SMOW–SLAP-calibrated δ18O and δ17O values then enables the calibration of the δ18O and 17O-excess values of the NGRIP samples following the method described in Schoenemann et al. (2013) and Landais et al. (2014). The resulting mean uncertainty is 5 ppm (1σ) for the 17O-excess measurements of this study. Note that the use of the MAT 253 mass spectrometer gave more stable results that a Delta V+ instrument used for previous studies at LSCE (e.g., Landais et al., 2012).
Our 1518 new measurements of δ18O and d-excess on the NGRIP ice core cover the time period 14.5 to 60 ka (Fig. 1) and we present 435 duplicate measurements of 17O-excess over the time period ranging from 9.6 to 20 ka (Fig. 2). δ18O is a qualitative proxy for local surface temperature. Comparisons between ice core δ18O data and paleotemperature estimates from borehole temperature profile inversion and abrupt temperature changes inferred from isotopic measurements on trapped air showed that the δ18O–temperature relationship at NGRIP varies from 0.3 ‰ to 0.5 ‰ ∘C−1 during glacial–interglacial periods (Buizert et al., 2014; Dahl-Jensen et al., 1998; Kindler et al., 2014).
The second-order parameter d-excess (Dansgaard, 1964) is used in Greenland ice cores to track past changes in evaporation conditions or shifts in moisture sources (Johnsen et al., 1989; Masson-Delmotte et al., 2005a). Evaporation conditions affect the initial vapor d-excess through the impact of surface humidity and sea surface temperature on kinetic fractionation (Jouzel et al., 1982). Recent vapor monitoring and modeling studies show that the d-excess signal of the moisture source can be preserved in polar vapor and precipitation after transportation towards polar regions (Bonne et al., 2015; Pfahl and Sodemann, 2014). This signal, however, can be altered during distillation due to the sensitivity of equilibrium fractionation coefficients to temperature, leading to alternative definitions using logarithm formulations for Antarctic ice cores (Uemura et al., 2012; Markle et al., 2016). Finally, changes in δ18Osea water also influence δ18O and d-excess in polar precipitation. Summarizing, d-excess in Greenland ice cores is a complex tracer: interpreting its past variations in terms of changes in evaporation conditions (sea surface temperature or humidity) requires deconvolution of the effects of glacial–interglacial changes in δ18Osea water and condensation temperature.
17O-excess provides complementary information to d-excess (Landais et al., 2008, 2012). At evaporation, d-excess and 17O-excess are both primarily influenced by the balance between kinetic and equilibrium fractionation, itself driven by relative humidity at the sea surface. During transport, while d-excess is influenced by distillation effects during atmospheric cooling, 17O-excess is largely insensitive to this effect, except at very low temperatures in Antarctica (Winkler et al., 2012). Conversely, 17O-excess is affected by recycling or mixing of air masses along the transport path from low to high latitudes (Risi et al., 2010) and by the range over which supersaturated conditions occur, itself affected, for instance, by changes in sea ice extent or temperature along the transport path (Schoenemann et al., 2014). Because of its logarithmic definition, 17O-excess is not sensitive to changes in δ18Osea water given that the 17O-excess of global seawater remains constant with time. As a consequence, a change in seawater isotopic composition will only be transmitted to the 17O-excess of the precipitation if the 17O-excess of the evaporated seawater is modified.
As previously reported for the central Greenland GRIP ice core (Masson-Delmotte et al., 2005b; Jouzel et al., 2005), the NGRIP δ18O and d-excess records exhibit a systematic anticorrelation during the abrupt Dansgaard–Oeschger (DO) events of the last glacial period and last deglaciation (Bølling–Allerød and Younger Dryas), with d-excess being higher during cool Greenland stadials and lower during warm Greenland interstadials.
The origin of moisture may be different at GRIP and NGRIP. While both sites are expected to receive most of their moisture from the North Atlantic and North America (Werner et al., 2001; Landais et al., 2012; Langen and Vinther, 2009) with modulation partly linked to sea ice extent (Rhines et al., 2014), the northwestern NGRIP site may also receive moisture from the North Pacific (Langen and Vinther, 2009). Nevertheless, the two sites depict similar amplitudes of d-excess variations across DO events (Fig. 1). We note that this contrasts with a slightly lower amplitude (typically by 1 ‰) of abrupt δ18O changes at NGRIP compared to GRIP.
The fact that d-excess increases (by 3.5±1 ‰) when δ18O decreases (by 4±1 ‰) during Greenland stadials relative to interstadials may at least partly reflect the influence of local temperature changes on d-excess, challenging a simple interpretation in terms of changes in source conditions. We note one exception: the Heinrich Stadial 1 cold phase preceding the onset of the Bølling–Allerød at 14.7 ka. During the time interval 17.5 to 14.7 ka, the δ18O values measured in the three Greenland ice cores NGRIP, GRIP, and GISP2 remain almost stable (Fig. 2). Over this period, δ18O variations are smaller than 1 ‰, i.e., less than one-fourth of the average amplitude in δ18O changes across DO events, suggesting no large temperature change in Greenland during this period. The link between flat δ18O and minimal temperature variability can be challenged since a mean temperature signal can be masked by a change in seasonality of moisture source origin on the δ18O record (Boyle et al., 1994; Krinner et al., 1997). However, our assumption of stable temperature is supported by constant δ15N of N2 values in the GISP2 and NGRIP ice cores (Buizert et al., 2014), δ15N of N2 being an alternative paleothermometry tool in ice cores that is not affected by processes within the water cycle (Severinghaus and Brook, 1999). In contrast to this almost stable δ18O signal, d-excess depicts an average 2.2 ‰ increase at 16.1 ka (more than 60 % of the average amplitude during DO events) with a larger amplitude at GRIP (2.7 ‰ ) than at NGRIP (1.7 ‰) (Fig. 2). In this case, the increase in d-excess cannot be explained by any Greenland temperature change and therefore demonstrates a decoupling between cold and stable Greenland temperatures and changing climatic conditions at lower latitudes during Heinrich Stadial 1 (see also Supplement).
While the 17O-excess level is similar at the Last Glacial Maximum (i.e., before 19 ka on Fig. 2) and the early Holocene (40 ppm), it also shows significant variations during the last deglaciation. Most of these variations covary with those of δ18O such as the four main oscillations during the Bølling–Allerød and the onset and end of the Younger Dryas. They can be interpreted as parallel variations in the Greenland temperature and lower-latitude climate with a possible contribution of local temperature through kinetic effects. Again, a major difference occurs during Heinrich Stadial 1. While the δ18O record is relatively stable, the 17O-excess profile exhibits a decreasing trend (strongest between 17.5 and 16.1 ka) before a minimum level is reached between 16.1 and 14.7 ka. We therefore observe a clear and synchronous signal in both d-excess and 17O-excess dated around 16.2 ka from statistical analysis (cf. Sect. 1 in Supplement).
The 17O-excess and d-excess transitions at 16.2 ka do not have any clear counterpart in δ18O (cf. Sect. 2 in Supplement) and no temperature variation at that time was recorded in the δ15N of N2 record. We interpret these patterns as illustrating a reorganization of climatic conditions and/or water cycle at latitudes south of Greenland. A similar shift in 17O-excess has already been observed during Heinrich Stadial 4 in the NEEM ice core, while the δ18O record exhibits a constant low level (Guillevic et al., 2014). This pattern was also attributed to a change in the water cycle and/or climate at lower latitudes.
The Greenland water stable isotope records demonstrate a change in the water cycle and/or climate at lower latitudes at 16.2 ka when Greenland conditions were relatively stable and cold. This change at low latitudes is confirmed by the high-resolution atmospheric CH4 concentration record from the WAIS Divide ice core (Rhodes et al., 2015) (Fig. 2). At 16.2 ka, the CH4 record indeed exhibits a 30 ppbv peak hypothesized to reflect more CH4 production in Southern Hemisphere wetlands driven by wetter conditions due to a southward shift of the tropical rain belts associated with the ITCZ (Rhodes et al., 2015). The parallel increase in atmospheric CO2 concentration by 10 ppm in ∼100 years (Marcott et al., 2013) is understood to result from increased terrestrial carbon fluxes or enhanced air–sea gas exchange in the Southern Ocean (Bauska et al., 2014). We also highlight an unusual characteristic of the bipolar seesaw pattern in Antarctic ice core δ18O records at 16.2 ka. As observed during all Greenland stadials of the last glacial period, Antarctic δ18O also increases during Heinrich Stadial 1 (e.g., EPICA community members, 2006) through the warming phase of Antarctic Isotopic Maximum 1. The EPICA Dronning Maud Land (EDML) ice core, drilled in the Atlantic sector of Antarctica, shows an associated two-step δ18O increase. The first step, marked by a strong increasing trend, is followed by a change in slope at 16.2 ka. The second step is characterized by a slower increasing trend from 16.2 to 14.7 ka (EPICA community members, 2006; Stenni et al., 2011) (Fig. 2). The EDML δ18O variations are expected to be closely connected to changes in AMOC due to the position of the ice core site on the Atlantic sector of the East Antarctic plateau and a link between the EDML δ18O record and the low-latitude signal over Heinrich Stadial 1 has already been suggested by Zhang et al. (2016). For other Antarctic sites, the change in slope around 16.2 ka is less clear, probably due to the damping effect of the Southern Ocean or because other climatic effects linked to atmospheric teleconnections with the tropics affect the Pacific and Indian sectors of Antarctica (Stenni et al., 2011; WAIS Divide members, 2013; Buiron et al., 2012). A change in the teleconnections between West Antarctic climate and tropical regions is also observed around 16.2 ka (Jones et al., 2018). Summarizing, our synthesis of ice core records clearly demonstrates a climate shift at 16.2 ka, identified in proxy records sensitive to shifts in tropical hydrology (CH4), midlatitude hydrological cycle changes in the Atlantic basin (Greenland second order isotopic tracers), and in Antarctic climate dynamics in the Atlantic basin. This suggests some reorganization of water cycle in the Atlantic region (possibly involving AMOC) related to surface shifts in the ITCZ at 16.2 ka. This does not appear to affect the high latitudes of the North Atlantic as Greenland temperatures stay uniformly cold. Uniformly cold conditions in Greenland are generally observed during Heinrich Stadials of the last glacial period with temperature and δ18O levels that are not significantly lower than temperature levels observed during Greenland stadials (Kindler et al., 2014; Guillevic et al., 2014). Because Greenland is surrounded by large sea ice during Greenland stadials and Heinrich Stadials (Hoff et al., 2016), an explanation may be that central Greenland temperatures are saturated during cold periods so that AMOC modifications occurring south of the sea ice edge are not significantly influencing Greenland temperatures. During Heinrich 1, occurring during the last deglaciation, the situation may be more complicated because of the CO2 concentration and insolation increases. In this case, the occurrence of Heinrich Stadial 1 may counteract the increase in Greenland temperature records induced by CO2 and insolation forcing through winter cooling driven by AMOC weakening, as suggested by Buizert et al. (2018).
At low latitudes, an ITCZ shift at 16.2 ka is clearly expressed through a weak monsoon interval in East Asian speleothem records and through a change in hydrology in the low-latitude Pacific region, Cariaco Basin, and Brazil (Partin et al., 2007; Deplazes et al., 2013; Russell et al., 2014; Strikis et al., 2015). Since we have ruled out a local temperature signal at 16.2 ka in Greenland, the origin of the Greenland d-excess and 17O-excess changes around 16.2 ka is also linked to changes in the climate of the source evaporative regions. When evaporation conditions change, they affect the proportion of kinetic versus equilibrium fractionation and cause similar trends in both d-excess and 17O-excess. Both of them indeed increase when kinetic fractionation is more important, i.e., when relative humidity decreases or when a change in sea ice modifies the evaporative conditions (Klein et al., 2015; Kopec et al., 2016). However, d-excess in the atmospheric vapor is affected by distillation toward higher latitudes and strongly depends on the source–site temperature gradient, while 17O-excess better preserves the initial fingerprint of the relative humidity of the evaporative region.
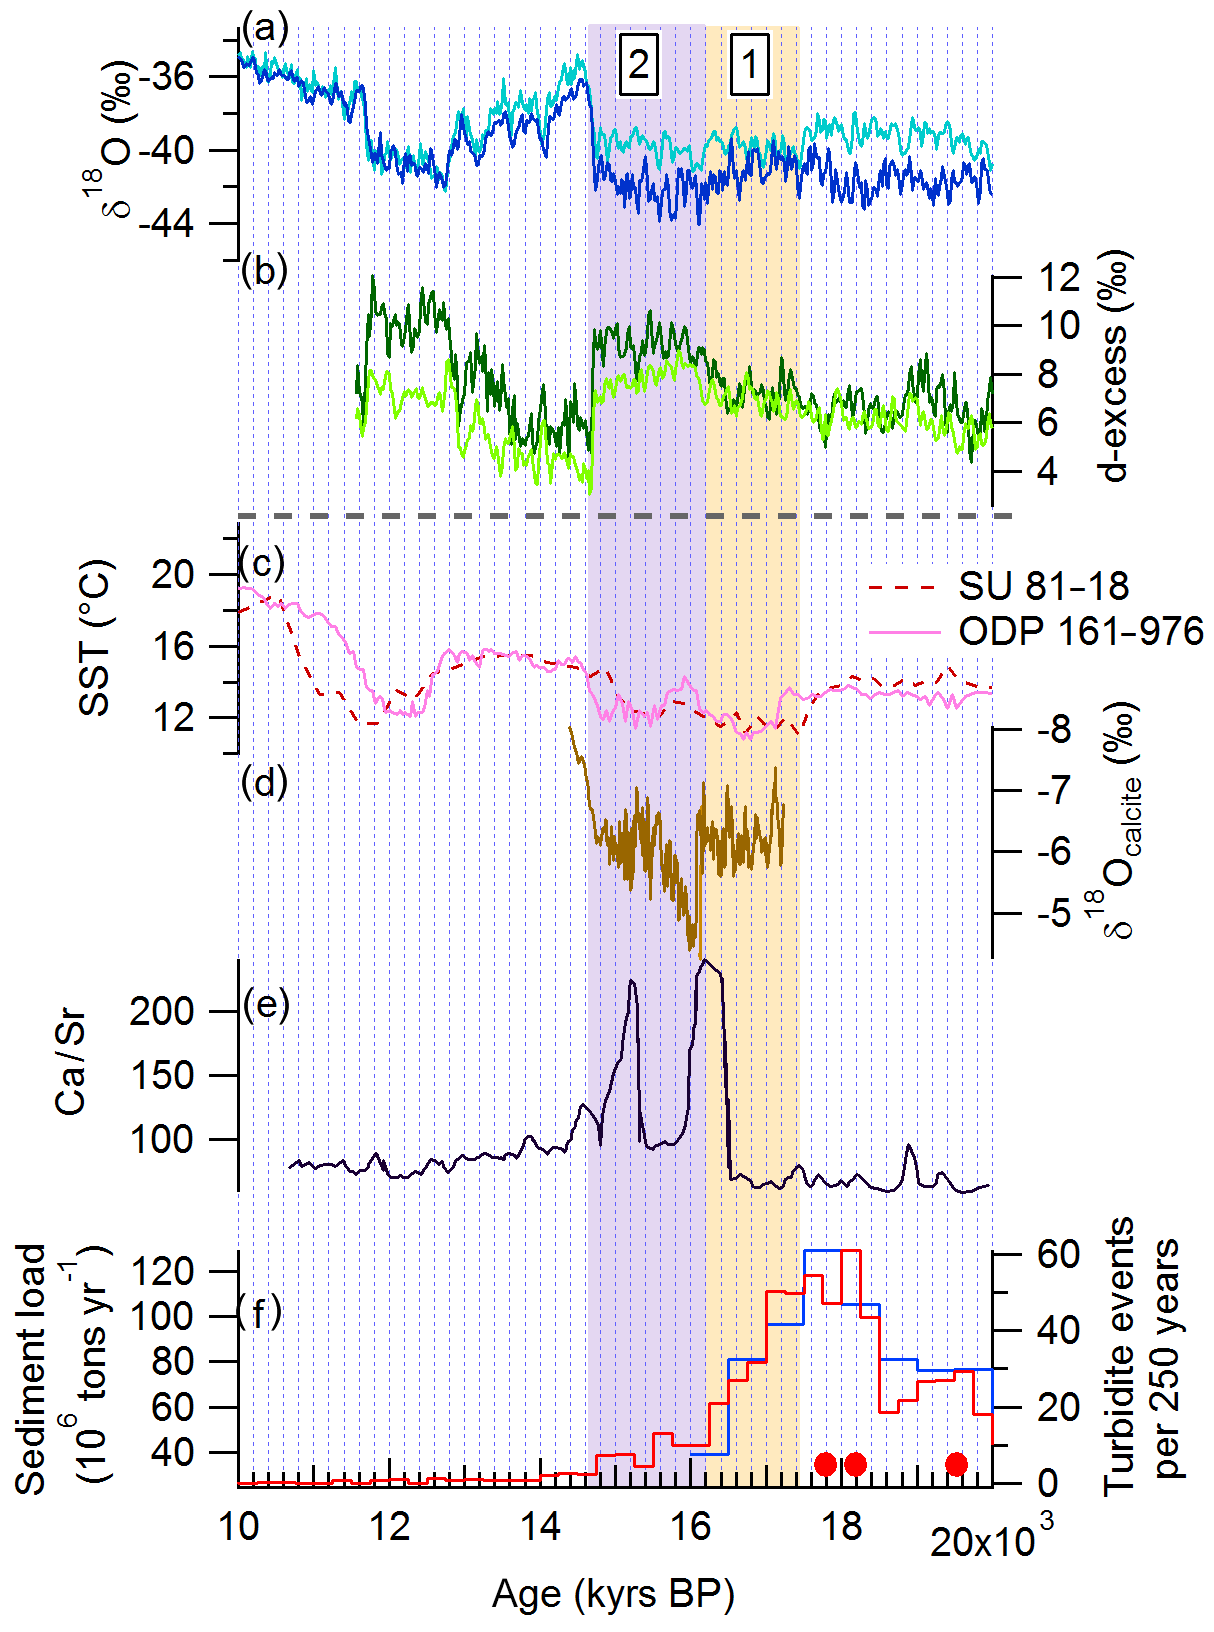
Figure 3The sequence of phase 1 and phase 2 of Heinrich Stadial 1 identified in Greenland records and in proxy records of North Atlantic SST, IRD events, and changes in East Asian hydroclimate. (a) NGRIP (dark blue) and GRIP (light blue) δ18O records; (b) NGRIP (dark green) and GRIP (light green) d-excess records; (c) sea surface temperature (SST) for North Atlantic cores SU 81-18 (Bard et al., 2000) and ODP 161-976 (Martrat et al., 2014); (d) calcite δ18O of Hulu Cave (China, Zhang et al., 2014); (e) Ca ∕ Sr from site U1308 in the IRD belt (Hodell et al., 2019) as a signature from strong iceberg discharges from the Laurentide ice sheet; (f) indications for Channel River sediment load (blue, sediment load; red, turbidite frequency) (Toucanne et al., 2010, 2015) as a signature for meltwater input from the European side. The three red circles indicate plumite layers resulting from outburst floods on the eastern Canadian margin (Leng et al., 2018), i.e., meltwater arrival from the North America side in the absence of strong iceberg discharge. The dashed horizontal line separates the ice core records reported on the GICC05 timescale from non-ice-core records displayed on their own timescales.
As a result, the opposing trends observed in d-excess and 17O-excess at 16.2 ka can most probably be explained by an increase in both the relative humidity and the sea surface temperature of the evaporative source regions for central and northern Greenland. Despite known limitations (Winkler et al., 2012; Schoenemann and Steig, 2016), the classical approach for inferring changes in source relative humidity and surface temperature from d-excess and 17O-excess in Greenland (Masson-Delmotte et al., 2005a; Landais et al., 2012) suggests respective increases of the order of 3 ∘C and 8 % for temperature and relative humidity of the source evaporative regions, respectively. The larger d-excess increase at the transition between phase 1 and phase 2 of Heinrich Stadial 1 observed at GRIP compared to NGRIP is compatible with a larger proportion of GRIP moisture provided by the midlatitude North Atlantic for this site. A larger increase in the sea surface temperature of the source of moisture for GRIP compared to NGRIP would also reduce the source–site temperature gradient and is fully compatible with the 2 ‰ less depleted level of δ18O at GRIP, compared to NGRIP, during phase 2. The increases in both temperature and relative humidity of the Greenland source regions suggest a more intense evaporative flux from lower latitudes starting at 16.2 ka. Such features could be explained either by a local climate signal of evaporative regions or by a southward shift of evaporative source regions toward warmer and more humid locations. The signal of source temperature increase is in line with earlier interpretations of Greenland d-excess changes (Steffensen et al., 2018; Masson-Delmotte et al., 2005b). The signal of source humidity increase may at least partly be explained by wetter conditions in the continental North American evaporative source regions, which are known to partly affect Greenland moisture today in addition to the main source in the northern Atlantic (Werner et al., 2001; Langen and Vinther, 2009). This relative humidity signal reconstructed from Greenland 17O-excess at the transition between phase 1 and phase 2 of Heinrich Stadial 1 coincides with the onset of the “big wet” period in North American records (Broecker and Putnam, 2012). This transition to a “big wet” period can be explained by a southward shift of the storm tracks and polar jet stream over North America during this period (Asmerom et al., 2010).
We now explore paleoceanographic records to search for a fingerprint of climate and/or AMOC reorganization at 16.2 ka in the North Atlantic region and possible implications for our ice core records. Such a comparison of ice core and marine sediment records appears insightful despite existing limitations attached to relative chronologies. First, high-resolution proxy records of surface sea temperature in the East Atlantic, near Europe, depict a clear warming in the middle of Heinrich Stadial 1 (Bard et al., 2000; Matrat et al., 2014, Fig. 3). This signal is coherent with our interpretation of the Greenland d-excess increase at 16.2 ka. In the deep western Atlantic, no specific feature emerges between phase 1 and phase 2 of Heinrich Stadial 1 from the multi-centennial resolution record of Pa ∕ Th, a proxy for AMOC strength (McManus et al., 2004).
Heinrich Stadial 1 is associated with at least two major iceberg rafted debris (IRD) discharges first identified near the Iberian margin (Bard et al., 2000). They may reflect the impact of changes in ocean conditions on ice shelf and ice sheet stabilities (Alvarez-Solas et al., 2011). Alternatively, the iceberg discharges themselves may have affected the AMOC, which is known to have major impacts on patterns of sea surface temperature, sea ice, atmospheric circulation, and climate over surrounding continents. The first IRD phase originated from ice sheet discharges from northern Europe and Iceland, causing strong reorganizations in deep circulation of the northeast Atlantic (Stanford et al., 2011; Grousset et al., 2001; Peck et al., 2006), while the second IRD phase is caused by discharges from the Laurentide ice sheet. Recent studies (e.g., Hodell et al., 2017; Toucanne et al., 2015) suggest that all IRD phases occur after 16.2 ka, during Heinrich Stadial 1 phase 2. Before that, Heinrich Stadial phase 1 is associated with a strong increase in sediment fluxes due to meltwater arrival through terrestrial-terminating ice streams originating from both European and American sides of the North Atlantic as a response to the beginning of the deglaciation (Toucanne et al., 2015; Ullman et al., 2015; Leng et al., 2018) (Fig. 3). During the first slowdown of AMOC during phase 1 of Heinrich Stadial 1, the associated warming of subsurface water would hence enable the destabilization of marine ice shelves occurring during phase 2 (Alvarez-Solas et al., 2011; Marcott et al., 2011). This second phase of Heinrich Stadial 1 is also associated with extensive sea ice production, south of Greenland (Hillaire-Marcel and de Vernal, 2008). The increase in North Atlantic sea ice extent and major iceberg discharges during the second phase of Heinrich Stadial 1 are coherent with a southward shift of the evaporative region, providing moisture to Greenland supported by d-excess data, and a southward shift of tropical rain belts (Chiang and Bitz, 2005), affecting Southern Hemisphere CH4 sources (Rhodes et al., 2015).
Combined measurements of d-excess and 17O-excess along the NGRIP ice core demonstrate a decoupling between a cold and stable Greenland climate and changes in hydroclimate at lower latitudes during the Heinrich Stadial 1, also referred to as the “mystery interval” (Denton et al., 2006). These new measurements hence confirm the previous studies of Zhang et al. (2014, 2016) and Rhodes et al. (2015). While Greenland temperature remains mostly stable from 20 to 14.7 ka, a large-scale climatic reorganization takes place at 16.2 ka, associated with warmer and wetter conditions at the location of Greenland moisture sources. Based on a coherent temporal framework linking the different ice core records, we show that this event coincides with changes in the characteristics of the bipolar seesaw pattern, as observed in the Atlantic sector of Antarctica, and has a fingerprint in global atmospheric composition through sharp changes in atmospheric CO2 and CH4 concentrations.
Based on these new ice core records and the comparison with marine and terrestrial records, we propose the following sequence of events during the last deglaciation. First, the initiation of Heinrich Stadial 1 occurs at 17.5 ka or earlier, with meltwater arrival from the terrestrial-terminating ice streams synchronous with a decrease in the North Atlantic sea surface temperature offshore of Europe, a first AMOC slowdown, drier conditions in North America, and an increase in Antarctic temperature as well as in atmospheric CO2 and CH4 concentrations. No fingerprint of this first phase of Heinrich Stadial 1 is identified in Greenland water stable isotope records; δ18O (and thus local temperature), 17O-excess, and d-excess remain stable. A possible explanation for such stability is that the high-latitude warming induced by the increase in the summer insolation at high latitudes over the beginning of the deglaciation is counterbalanced in Greenland by regional changes in, e.g., increased albedo due to sea ice extent or reduced transport of heat by the atmospheric circulation towards central Greenland, which both can result from a reduced AMOC strength. The global event occurring at 16.2 ka marks the onset of the second phase of Heinrich Stadial 1. It is associated with (i) strong iceberg discharges due to dynamical instability of the Laurentide ice sheet, probably induced by the accumulation of subsurface ocean heat due to a slowdown of AMOC during phase 1, (ii) a widespread reorganization of the atmospheric water cycle in the Atlantic region, with significant changes in d-excess and 17O-excess in Greenland, (iii) the initiation of a weak monsoon interval in East Asia, and (iv) the transition from a “big dry” episode to a “big wet” episode in North America. We note that this sequence of events within Heinrich Stadial 1 is invisible in all available Greenland temperature proxy records, which only display an abrupt warming at the onset of the Bølling–Allerød (14.7 ka).
Attached to a bipolar synchronized chronological framework, our new ice core data provide a unique benchmark to test the ability of Earth system models (ESMs) to correctly resolve the mechanisms occurring at sub-millennial scale during the last deglaciation. In particular, our proposed sequence of events is useful to evaluate ESM capabilities in reproducing the relationships between meltwater fluxes, the state of the North Atlantic ocean circulation, the Laurentide ice sheet instability, changes at the moisture sources of Greenland ice cores, the response of hydroclimate at low and high latitudes, and the net quantitative effects on global methane and carbon budgets.
The new datasets are given in the Supplement below.
The supplement related to this article is available online at: https://doi.org/10.5194/cp-14-1405-2018-supplement.
AL, EC and VMD designed the study. BM, FP and AL performed the measurements. AL, EC, ST, RR and TP worked on interpretation of the results. AL wrote the first draft and all authors contributed to the writing of the final manuscript.
The authors declare that they have no conflict of interest.
The research leading to these results has received funding from the European
Research Council under the European Union's Seventh Framework Programme
(FP7, 2007–2013) RC agreement number 306045. Emilie Capron is funded by the
European Union's Seventh Framework Programme for research and innovation
under Marie Skłodowska-Curie grant agreement no. 600207.
Rachael H. Rhodes received funding from a
European Commission Horizon 2020 Marie Skłodowska-Curie Individual Fellowship
(no. 658120, SEADOG). We thank Myriam Guillevic and Jean Jouzel for very
useful discussions as well as Christo Buizert and an anonymous reviewer for
very useful comments.
Edited by: Elizabeth
Thomas
Reviewed by: Christo Buizert and one anonymous referee
Álvarez-Solas, J., Montoya, M., Ritz, C., Ramstein, G., Charbit, S., Dumas, C., Nisancioglu, K., Dokken, T., and Ganopolski, A.: Heinrich event 1: an example of dynamical ice-sheet reaction to oceanic changes, Clim. Past, 7, 1297–1306, https://doi.org/10.5194/cp-7-1297-2011, 2011.
Andersen, K. K., Svensson, A., Johnsen, S. J., Rasmussen, S. O., Bigler, M., Roethlisberger, R., Ruth, U., Siggaard-Andersen, M. L., Steffensen, J. P., Dahl-Jensen, D., Vinther, B. M., and Clausen, H. B., The Greenland Ice Core Chronology 2005, 15-42 ka. Part 1: constructing the time scale, Quaternary Sci. Rev., 25, 3246–3257, 2006
Asmerom, Y., Polyak, V. J., and Burns, S. J.: Variable winter moisture in the southwestern United States linked to rapid glacial climate shifts, Nat. Geosci., 3, 114–117, 2010.
Bard, E., Rostek, F., Turon, J. L., and Gendreau, S.: Hydrological Impact of Heinrich Events in the Subtropical Northeast Atlantic, Science, 289, 1321–1324, 2000
Barkan, E. and Luz, B.: High precision measurements of 17O∕16O and 18O∕16O ratios in H2O, Rapid Commun., 19, 3737–3742, 2005.
Bauska, T. K., Baggenstos, D., Brook, E. J., Mix, A. C., Marcott, S. A., and Petrenko, V.: Carbon isotopes characterize rapid changes in atmospheric carbon dioxide during the last deglaciation, P. Natl. Acad. Sci. USA, 113, 3465–3470, 2016.
Bazin, L., Landais, A., Lemieux-Dudon, B., Toyé Mahamadou Kele, H., Veres, D., Parrenin, F., Martinerie, P., Ritz, C., Capron, E., Lipenkov, V., Loutre, M.-F., Raynaud, D., Vinther, B., Svensson, A., Rasmussen, S. O., Severi, M., Blunier, T., Leuenberger, M., Fischer, H., Masson-Delmotte, V., Chappellaz, J., and Wolff, E.: An optimized multi-proxy, multi-site Antarctic ice and gas orbital chronology (AICC2012): 120–800 ka, Clim. Past, 9, 1715–1731, https://doi.org/10.5194/cp-9-1715-2013, 2013.
Bonne, J.-L., Steen-Larsen, H. C., Risi, C., Werner, M., Sodemann, H., Lacour, J.-L., Fettweis, X., Cesana, G., Delmotte, M., Cattani, O., Vallelonga, P., Kjaer, H. A., Clerbaux, C., Sveinbjornsdottir, A. E., and Masson-Delmotte, V.: The summer 2012 Greenland heat wave: In situ and remote sensing observations of water vapor isotopic composition during an atmospheric river event, J. Geophys. Res.-Atmos., 120, 2970–2989, 2015.
Boyle, E. A.: Cool tropical temperatures shift the global δ18O-T relationship: An explanation for the ice core δ18O-borehole thermometry conflict?, Geophys. Res. Lett., 24, 273–276, 1994.
Broecker, W. and Putnam, A. E.: How did the hydrologic cycle respond to the two-phase mystery interval?, Quaternary Sci. Rev., 57, 17–25, 2012.
Buiron, D., Stenni, B., Chappellaz, J., Landais, A., Baumgartner, M., Bonazza, M., Capron, E., Frezzotti, M., Kageyama, M., Lemieux-Dudon, B., Masson-Delmotte, V., Parrenin, F., Schilt, A., Selmo, E., Severi, M., Swingedouw, D., and Udisti, R.: Regional imprints of millennial variability during the MIS 3 period around Antarctica, Quaternary Sci. Rev., 48, 99–112, 2012.
Buizert, C., Gkinis, V., Severinghaus, J. P., He, F., Lecavalier, B. S., Kindler, P., Leuenberger, M., Carlson, A. E., Vinther, B., Masson-Delmotte, V., White, J. W. C., Liu, Z., Otto-Bliesner, B., and Brook, E. J.: Greenland temperature response to climate forcing during the last deglaciation, Science, 345, 1177–1180, 2014.
Buizert, C., Keisling, B. A., Box, J. E., He, F., Carlson, A. E., Sinclair, G., and DeConto, R. M.: Greenland-Wide Seasonal Temperatures During the Last Deglaciation, Geophys. Res. Lett., 45, 1905–1914, 2018.
Chiang, J. C. H. and Bitz, C. M.: Influence of high latitude ice cover on the marine Intertropical Convergence Zone, Clim. Dynam., 25, 477–496, 2005.
Clark, P. U., Shakun, J. D., Baker, P. A., Bartlein, P. J., Brewer, S., Brook, E., Carlson, A. E., Cheng, H., Kaufman, D. S., Liu, Z., Marchitto, T. M., Mix, A. C., Morrill, C., Otto-bliesner, B. L., Pahnke, K., Russell, J. M., Whitlock, C., Adkins, J. F., Blois, J. L., Clark, J., Colman, S. M., Curry, W. B., Flower, B. P., He, F., Johnson, T. C., Lynch-Stieglitz, J., Markgraf, V., Mcmanus, J., Mitrovica, J. X., Moreno, P. I., and Williams, J. W.: Global climate evolution during the last deglaciation, P. Natl. Acad. Sci. USA, 109, E1134–E1142, 2012.
Dahl-Jensen, D., Mosegaard, K., Gundestrup, N., Clow, G. D., Johnsen, S. J., Hansen, A. W., and Balling, N.: Past Temperatures Directly from the Greenland Ice Sheet, Science, 282, 268–271, 1998.
Dansgaard, W.: Stable isotopes in precipitation, Tellus, 16, 436–468, 1964.
Denton, G. H., Broecker, W. S., and Alley, R. B.: The mystery interval 17.5 to 14.5 kyrs ago, PAGES news, 14, 14–16, 2006.
Denton, G. H., Anderson, R. F., Toggweiler, J. R., Edwards, R. L.,Schaefer, J. M., and Putnam, A. E.: The Last Glacial Termination, Science, 328, 1652–1656, 2010.
Deplazes, G., Luckge, A., Peterson, L. C., Timmermann, A., Hamann, Y., Hughen, K. A., Rohl, U., Laj, C., Cane, M. A., Sigman, D. M., and Haug, G. H.: Links between tropical rainfall and North Atlantic climate during the last glacial period, Nat. Geosci., 6, 213–217, 2013.
Epica community members: One-to-one coupling of glacial climate variability in Greenland and Antarctica, Nature, 444, 195–198, 2006.
Epstein, S., Buchsbaum, R., Lowenstam, H. A., and Urey, H.: Revised carbonate-water isotopic temperature scale, GSA bulletin, 64, 1315–1325, 1953.
Grootes, P. M., Stuiver, M., White, J. W. C., Johnsen, S., and Jouzel, J.: Comparison of oxygen isotope records from the GISP2 and GRIP Greenland ice cores, Nature, 366, 552–554, 1993.
Grousset, F.: Les changements abrupts du climat depuis 60 000 ans/Abrupt climatic changes over the last 60,000 years, Quaternaire, 12, 203–211, 2001.
Guillevic, M., Bazin, L., Landais, A., Stowasser, C., Masson-Delmotte, V., Blunier, T., Eynaud, F., Falourd, S., Michel, E., Minster, B., Popp, T., Prié, F., and Vinther, B. M.: Evidence for a three-phase sequence during Heinrich Stadial 4 using a multiproxy approach based on Greenland ice core records, Clim. Past, 10, 2115–2133, https://doi.org/10.5194/cp-10-2115-2014, 2014.
Hillaire-Marcel, C. and De Vernal, A.: Stable isotope clue to episodic sea ice formation in the glacial North Atlantic, Earth Plan. Sc. Let., 268, 143–150, 2008.
Hoff, U., Rasmussen, T. L., Stein, R., Ezat, M. M., and Fahl, K.: Sea ice and millennial-scale climate variability in the Nordic seas 90-kyr ago to present, Nat. Commun., 7, 12247, https://doi.org/10.1038/ncomms12247, 2016.
Hodell, D. A., Nicholl, J. A., Bontognali, T. R. R., Danino, S., Dorador, J., Dowdeswell, J. A., Einsle, J., Kuhlmann, H., Martrat, B., Mleneck-vautravers, M. J., Rodríguez-tovar, F. J., and Röhl, U.: Anatomy of Heinrich Layer 1 and its role in the last deglaciation, Paleoceanogr. Paleocl., 32, https://doi.org/10.1002/2016PA003028, 2017.
Johnsen, S. J., Dansgaard, W., and White, J. W. C.: The origin of Arctic precipitation under present and glacial conditions, Tellus B, 41, 452–468, 1989.
Jones, T. R., Roberts, W. H. G., Steig, E. J., Cuffey, K. M., Markle, B. R., and White, J. W. C.: Southern Hemisphere climate variability forced by Northern Hemisphere ice-sheet topography, Nature, 554, 351–355, 2018.
Jouzel, J., Merlivat, L., and Lorius, C.: Deuterium excess in an East Antarctic ice core suggests higher relative humidity at the oceanic surface during the last glacial maximum, Nature, 299, 688–691, 1982.
Jouzel, J., Masson-Delmotte, V., Stiévenard, M., and Landais, A.: Rapid deuterium-excess changes in Greenland ice cores?: a link between the ocean and the atmosphere, C. R. Geosci., 337, 957–969, 2005.
Kindler, P., Guillevic, M., Baumgartner, M., Schwander, J., Landais, A., and Leuenberger, M.: Temperature reconstruction from 10 to 120 kyr b2k from the NGRIP ice core, Clim. Past, 10, 887–902, https://doi.org/10.5194/cp-10-887-2014, 2014.
Klein, E. S., Cherry, J. E., Young, J., Noone, D., Leffler, A. J., and Welker, J. M.: Arctic cyclone water vapor isotopes support past sea ice retreat recorded in Greenland ice, Sci. Rep., 5, 10295–10300, 2015.
Kopec, B. G., Feng, X., Michel, F. A., and Posmentier, E. S.: Influence of sea ice on Arctic precipitation, P. Natl. Acad. Sci. USA, 113, 46–51, 2016.
Krinner, G., Genthon, C., and Jouzel, J.: GCM analysis of local influences on ice core δ signals, Geophys. Res. Lett., 24, 2825–2828, 1997.
Landais, A., Barkan, E., and Luz, B.: Record of δ18O and 17O-excess in ice from Vostok Antarctica during the last 150,000 years, Geophys. Res. Lett., 35, L02709, https://doi.org/10.1029/2007GL032096, 2008.
Landais, A., Steen-Larsen, H. C., Guillevic, M., Masson-Delmotte, V., Vinther and B., and Winkler, R.: Triple isotopic composition of oxygen in surface snow and water vapor at NEEM (Greenland), Geochim. Cosmochim. Ac., 77, 304–316, 2012.
Landais, A., Winkler, R., and Prié, F.: Triple Isotopic Composition of Oxygen in Water from Ice Cores, application note 30287, Thermo, 2014.
Langen, P. L. and Vinther, B. M.: Response in atmospheric circulation and sources of Greenland precipitation to glacial boundary conditions, Clim. Dynam., 32, 1035–1054, 2009.
Leng, W., von Dobeneck, T., Bergmann, F., Just, J., Mulitza, S., Chiessi, C., St-Onge, G., and Piper, D.: Sedimentary and rock magnetic signatures and event scenarios of deglacial outburst floods from the Laurentian Channel Ice Stream, Quaternary Sci. Rev., 186, 27–46, https://doi.org/10.1016/j.quascirev.2018.01.016, 2018.
Marcott, S. A., Clark, P. U., Padman, L., Klinkhammer, G. P., Springer, S. R., Liu, Z., Otto-Bliesner, B. L., Carlson, A. E., Ungerer, A., Padman, J., He, F., Cheng, J., and Schmittner, A.: Ice-shelf collapse from subsurface warming as a trigger for Heinrich events, P. Natl. Acad. Sci. USA, 108, 13415–13419, https://doi.org/10.1073/pnas.1104772108, 2011.
Marcott, S. A, Bauska, T. K., Buizert, C., Steig, E. J., Rosen, J. L., Cuffey, K. M., Fudge, T. J., Severinghaus, J. P., Ahn, J., Kalk, M. L., McConnell, J. R., Sowers, T., Taylor, K. C., White, J. W. C., and Brook, E. J.: Centennial-scale changes in the global carbon cycle during the last deglaciation, Nature, 514, 616–619, 2013.
Markle, B. R., Steig, E. J., Buizert, C., Schoenemann, S. W., Bitz, C. M., Fudge, T. J., Pedro, J. B., Ding, Q., Jones, T. R., White, J. W. C., and Sowers, T.: Global atmospheric teleconnections during Dansgaard–Oeschger events, Nat. Geosci., 10, 36–40, 2016.
Martrat, B., Jimenez-Amat, P., Zahn, R., and Grimalt, J. O.: Similarities and dissimilarities between the last two deglaciations and interglaciations in the North Atlantic region, Quateranry Sci. Rev., 99, 122–134, 2014.
Masson-Delmotte, V., Landais, A., Stievenard, M., Cattani, O., Falourd, S., Jouzel, J., Johnsen, S. J. Dahl-Jensen, D., Sveinsbjornsdottir, A., White, J. W. C., Popp, T., and Fischer, H.: Holocene climatic changes in Greenland: Different deuterium excess signals at Greenland Ice Core Project (GRIP) and NorthGRIP, J. Geophys. Res.-Atmos., 110, 1–13, 2005a.
Masson-Delmotte, V., Jouzel, J., Landais, A., Stievenard, M., Johnsen, S.J., White, J. W. C., Werner, M., Sveinbjornsdottir, A., and Fuhrer, K.: GRIP deuterium excess reveals rapid and orbital-scale changes in Greenland moisture origin, Science, 309, 118–121, 2005b.
McManus, J. F., Francois, R., Gherardi, J.-M., Keigwin, L. D., and Brown-Leger, S.: Collapse and rapid resumption of Atlantic meridional circulation linked to deglacial climate changes, Nature, 428, 834–837, 2004.
NGRIP community members: High-resolution climate record of Northern Hemisphere climate extending into the last interglacial period, Nature, 431, 147–151, 2004.
Partin, J. W., Cobb, K. M., Adkins, J. F., Clark, B., and Fernandez, D. P.: Millennial scale trends in west Pacific warm pool hydrology since the Last Glacial Maximum, Nature, 449, 452–455, 2007.
Peck, V. L., Hall, I. R., Zahn, R., Elderfield, H., and Grousset, F.: High resolution evidence for linkages between NW European ice sheet instability and Atlantic Meridional Overturning Circulation, Earth Plan. Sc. Let., 243, 476–488, 2006.
Pfahl, S. and Sodemann, H.: What controls deuterium excess in global precipitation?, Clim. Past, 10, 771–781, https://doi.org/10.5194/cp-10-771-2014, 2014.
Rasmussen, S. O., Andersen, K. K., Svensson, A. M., Steffensen, J. P., Vinther, B. M., Clausen, H. B., Siggaard-Andersen, M. L., Johnsen, S. J., Larsen, L. B., Dahl-Jensen, D., Bigler, M., Roethlisberger, R., Fischer, H., Goto-Azuma, K., Hansson, M. E., and Ruth, U.: A new Greenland ice core chronology for the last glacial termination, J. Geophys. Res.-Atmos., 111, 1–16, 2006.
Rasmussen, S. O., Seierstad, I. K., Andersen, K. K., Bigler, M., and Johnsen, S. J.: Synchronization of the NGRIP , GRIP , and GISP2 ice cores across MIS 2 and palaeoclimatic implications, Quaternary Sci. Res., 27, 18–28, 2008.
Rhines, A. and Huybers, P. J.: Sea ice and dynamical controls on preindustrial and last glacial maximum accumulation in central Greenland, J. Climate, 27, 8902–8917, 2014.
Rhodes, R. H., Brook, E. J., Chiang, J. C. H., Blunier, T., Maselli, O. J., McConnell, J., Romanini, D., and Severinghaus, J. P.: Enhanced tropical methane production in response to iceberg discharge in the North Atlantic, Science, 348, 1016–1019, 2015.
Risi, C., Landais, A., Bony, S., Jouzel, J., Masson-Delmotte, V., and Vimeux, F.: Understanding the 17O excess glacial-interglacial variations in Vostok precipitation, J. Geophys. Res.-Atmos., 115, D10112, https://doi.org/10.1029/2008JD011535, 2010.
Russell, J., Vogel, H., Konecky, B.L., Bijaksana, S., Huang, Y., Melles, M., Wattrus, N., Costa, K., and King, J.W.: Glacial forcing of central Indonesian hydroclimate since 60,000 y BP, P. Natl Acad. Sci. USA, 111, 5100–5105, 2014.
Schoenemann, S. W., Schauer, S., and Steig, E. J.: Measurement of SLAP2 and GISP-δ17O and proposed VSMOW-SLAP normalization for δ17O and 17Oexcess, Rapid Commun. Mass Sp., 27, 582–590, 2013.
Schoenemann, S. W., Steig, E. J., Ding, Q., Markle, B. R., and Schauer, A. J.: Triple water-isotopologue record from WAIS Divide, Antarctica: Controls on glacial-interglacial changes in 17O-excess of precipitation, J. Geophys. Res.-Atmos., 119, 8741–8763, 2014.
Schoenemann, S. W. and Steig, E. J.: Seasonal and spatial variations of 17O-excess and d-excess in Antarctic precipitation: Insights from an intermediate complexity isotope model, J. Geophys. Res.-Atmos., 121, 11211–215247, 2016.
Severinghaus, J. P. and Brook, E.: Abrupt climate change at the end of the last glacial period inferred from trapped air in polar ice, Science, 286, 930–934, 1999.
Stanford, D., Rohling, E. J., Bacon, S., Roberts, A. P., Grousset, F. E., and Bolshaw, M.: A new concept for the paleoceanographic evolution of Heinrich event 1 in the North Atlantic, Quaternary Sci. Rev., 30, 1047–1066, 2011.
Steffensen, J. P., Andersen, K. K., Bigler, M., Clausen, H. B., Dahl-Jensen, D., Fischer, H., Goto-Azuma, K., Hansson, M., Johnsen, S. J., Jouzel, J., Masson-Delmotte, V., Popp, T., Rasmussen, S. O., Rothlisberger, R., Ruth, U., Stauffer, B., Siggaard-Andersen, M.-L., Sveinbjörnsdóttir, A. E., Svensson, A., and White, J. W. C.: High-Resolution Greenland Ice Core Data Show Abrupt Climate Change Happens in Few Years, Science, 321, 680–684, 2008.
Stenni, B., Buiron, D., Frezzotti, M., Albani, S., Barbante, C., Bard, E., Barnola, J. M., Baroni, M., Baumgartner, M., Bonazza, M., Capron, E., Castellano, E., Chappellaz, J., Delmonte, B., Falourd, S., Genoni, L., Iacumin, P., Jouzel, J., Kipfstuhl, S., Landais, A., Lemieux-Dudon, B., Maggi, V., Masson-Delmotte, V., Mazzola, C., Minster, B., Montagnat, M., Mulvaney, R., Narcisi, B., Oerter, H., Parrenin, F., Petit, J. R., Ritz, C., Scarchilli, C., Schilt, A., Schüpbach, S., Schwander, J., Selmo, E., Severi, M., Stocker, T. F., and Udisti, R.: Expression of the bipolar see-saw in Antarctic climate records during the last deglaciation, Nat. Geosci., 4, 46–49, 2011.
Stríkis, N. M., Chiessi, C. M., Cruz, F. W., Vuille, M., Cheng, H., De Souza Barreto, E. A., Mollenhauer, G., Kasten, S., Karmann, I., Edwards, R. L., Bernal, J. P., and Sales, H. D. R.: Timing and structure of Mega-SACZ events during Heinrich Stadial 1, Geophys. Res. Lett., 42, 5477–5484, 2015.
Svensson, A., Andersen, K. K., Bigler, M., Clausen, H. B., Dahl-Jensen, D., Davies, S. M., Johnsen, S. J., Muscheler, R., Parrenin, F., Rasmussen, S. O., Röthlisberger, R., Seierstad, I., Steffensen, J. P., and Vinther, B. M.: A 60 000 year Greenland stratigraphic ice core chronology, Clim. Past, 4, 47–57, https://doi.org/10.5194/cp-4-47-2008, 2008.
Toucanne, S., Zaragosi, S., Bourillet, J.-F., Marieu, V., Cremer, M., Kageyama, M., Van Vliet-Lanoë, B., Eynaud, F., Turon, J.-L., and Gibbard, P.-L.: The first estimation of Fleuve Manche palaeoriver discharge during the last deglaciation: Evidence for Fennoscandian ice sheet meltwater flow in the English Channel ca 20–18 ka ago, Earth Planet. Sc. Lett., 290, 459–473, 2010.
Toucanne, S., Soulet, G., Freslon, N., Silva Jacinto, R., Dennielou, B., Zaragosi, S., Eynaud, F., Bourillet, J.-F., and Bayon, G.: Millennial-scale fluctuations of the European Ice Sheet at the end of the last glacial, and their potential impact on global climate, Quaternary Sci. Rev., 123, 113–133, 2015.
Uemura, R., Masson-Delmotte, V., Jouzel, J., Landais, A., Motoyama, H., and Stenni, B.: Ranges of moisture-source temperature estimated from Antarctic ice cores stable isotope records over glacial-interglacial cycles, Clim. Past, 8, 1109–1125, https://doi.org/10.5194/cp-8-1109-2012, 2012.
Ullman, D. J., Carlson, A. E., Anslow, F. S., LeGrande, A. N., and Licciardi, J. M.: Laurentide ice-sheet instability during the last deglaciation, Nat. Geosci., 8, 534–537, 2015.
Vaughn, B., H., White, J. W. C., Delmotte, M., Trolier, M., Cattani, O., and Stievenard, M.: An automated system for hydrogen isotope analysis of water, Chemical Geology Including Isotope Geoscience, 152, 309–319, 1998.
Veres, D., Bazin, L., Landais, A., Toyé Mahamadou Kele, H., Lemieux-Dudon, B., Parrenin, F., Martinerie, P., Blayo, E., Blunier, T., Capron, E., Chappellaz, J., Rasmussen, S. O., Severi, M., Svensson, A., Vinther, B., and Wolff, E. W.: The Antarctic ice core chronology (AICC2012): an optimized multi-parameter and multi-site dating approach for the last 120 thousand years, Clim. Past, 9, 1733–1748, https://doi.org/10.5194/cp-9-1733-2013, 2013.
Wais Divide Members: Onset of deglacial warming in West Antarctica driven by local orbital forcing Nature, 500, 440–444, 2013.
Werner, M., Heimann, M., and Hoffmann, G.: Isotopic composition and origin of polar precipitation in present and glacial climate simulations, Tellus B, 53, 53–71, 2001.
Winkler, R., Landais, A., Sodemann, H., Dümbgen, L., Prié, F., Masson-Delmotte, V., Stenni, B., and Jouzel, J.: Deglaciation records of 17O-excess in East Antarctica: reliable reconstruction of oceanic normalized relative humidity from coastal sites, Clim. Past, 8, 1–16, https://doi.org/10.5194/cp-8-1-2012, 2012.
Zhang, W., Wu, J., Wang, Y., Wang, Y., Cheng, H., Kong, X., and Duan, F. A: detailed East Asian monsoon history surrounding the “Mystery Interval” derived from three Chinese speleothem records, Quateranry Res., 82, 154–163, 2014.
Zhang, H., Griffiths, M. L., Huang, J., Cai, Y., Wang, C., Zhang, F., Cheng, H., Ning, Y., Hu, C., and Xie, S.: Antarctic link with East Asian summer monsoon variability during the Heinrich Stadial–Bølling interstadial transition, Earth Planet. Sc. Lett., 453, 243–251, 2016.