the Creative Commons Attribution 4.0 License.
the Creative Commons Attribution 4.0 License.
 | 22 Oct 2018
Reduced carbon cycle resilience across the Palaeocene–Eocene Thermal Maximum
David I. Armstrong McKay
Timothy M. Lenton
Several past episodes of rapid carbon cycle and climate change are hypothesised to be the result of the Earth system reaching a tipping point beyond which an abrupt transition to a new state occurs. At the Palaeocene–Eocene Thermal Maximum (PETM) at ∼56 Ma and at subsequent hyperthermal events, hypothesised tipping points involve the abrupt transfer of carbon from surface reservoirs to the atmosphere. Theory suggests that tipping points in complex dynamical systems should be preceded by critical slowing down of their dynamics, including increasing temporal autocorrelation and variability. However, reliably detecting these indicators in palaeorecords is challenging, with issues of data quality, false positives, and parameter selection potentially affecting reliability. Here we show that in a sufficiently long, high-resolution palaeorecord there is consistent evidence of destabilisation of the carbon cycle in the ∼1.5 Myr prior to the PETM, elevated carbon cycle and climate instability following both the PETM and Eocene Thermal Maximum 2 (ETM2), and different drivers of carbon cycle dynamics preceding the PETM and ETM2 events. Our results indicate a loss of “resilience” (weakened stabilising negative feedbacks and greater sensitivity to small shocks) in the carbon cycle before the PETM and in the carbon–climate system following it. This pre-PETM carbon cycle destabilisation may reflect gradual forcing by the contemporaneous North Atlantic Volcanic Province eruptions, with volcanism-driven warming potentially weakening the organic carbon burial feedback. Our results are consistent with but cannot prove the existence of a tipping point for abrupt carbon release, e.g. from methane hydrate or terrestrial organic carbon reservoirs, whereas we find no support for a tipping point in deep ocean temperature.
- Article
(2301 KB) -
Supplement
(1637 KB) - BibTeX
- EndNote


The Palaeocene–Eocene Thermal Maximum (PETM) at ∼ 56 Ma is considered a potential example of passing a tipping point in the carbon–climate system at which a smooth change in forcing triggered a large response (Lenton, 2013). Palaeorecords across the PETM indicate that an abrupt release of isotopically light carbon (between 2000 and 13 000 Pg C, best estimate ∼3000 Pg C) into the ocean–atmosphere system occurred in under ∼5 kyr, accompanied by global warming of ∼5 ∘C, a 2.5 ‰ to 3.0 ‰ benthic δ13C excursion, and significant ocean acidification (Dickens, 2011; Dickens et al., 1995; Dunkley Jones et al., 2013; Frieling et al., 2017; Kirtland Turner et al., 2017; Littler et al., 2014; McInerney and Wing, 2011; Sluijs et al., 2007b; Zachos et al., 2005, 2008, Zeebe et al., 2009, 2016). It has been hypothesised that gradual warming during the late Palaeocene (Fig. 1) eventually crossed a tipping point, either through an internal process or an external perturbation such as volcanism (Svensen et al., 2004), which triggered the extensive dissociation of a carbon cycle “capacitor” such as methane hydrates in ocean sediments (Dickens, 2011; Dickens et al., 1995; Minshull et al., 2016), permafrost soil carbon (DeConto et al., 2012), or organic carbon from a source such as peat (Cui et al., 2011; Kurtz et al., 2003) that benthic δ13C records and modelling indicate accumulated earlier in the Palaeocene (Dickens, 2011; Komar et al., 2013; Kurtz et al., 2003). This in turn led to a rapid increase in atmospheric CO2 (pCO2) and the subsequent amplification of global warming and carbon release in a positive feedback loop that shifted the Earth system to a warmer state for ∼100 kyr. An alternative hypothesis is that a very large external perturbation of volcanic carbon caused the PETM (Gutjahr et al., 2017) with a smaller role for amplifying feedbacks within the carbon cycle and therefore no significant role for a tipping point.
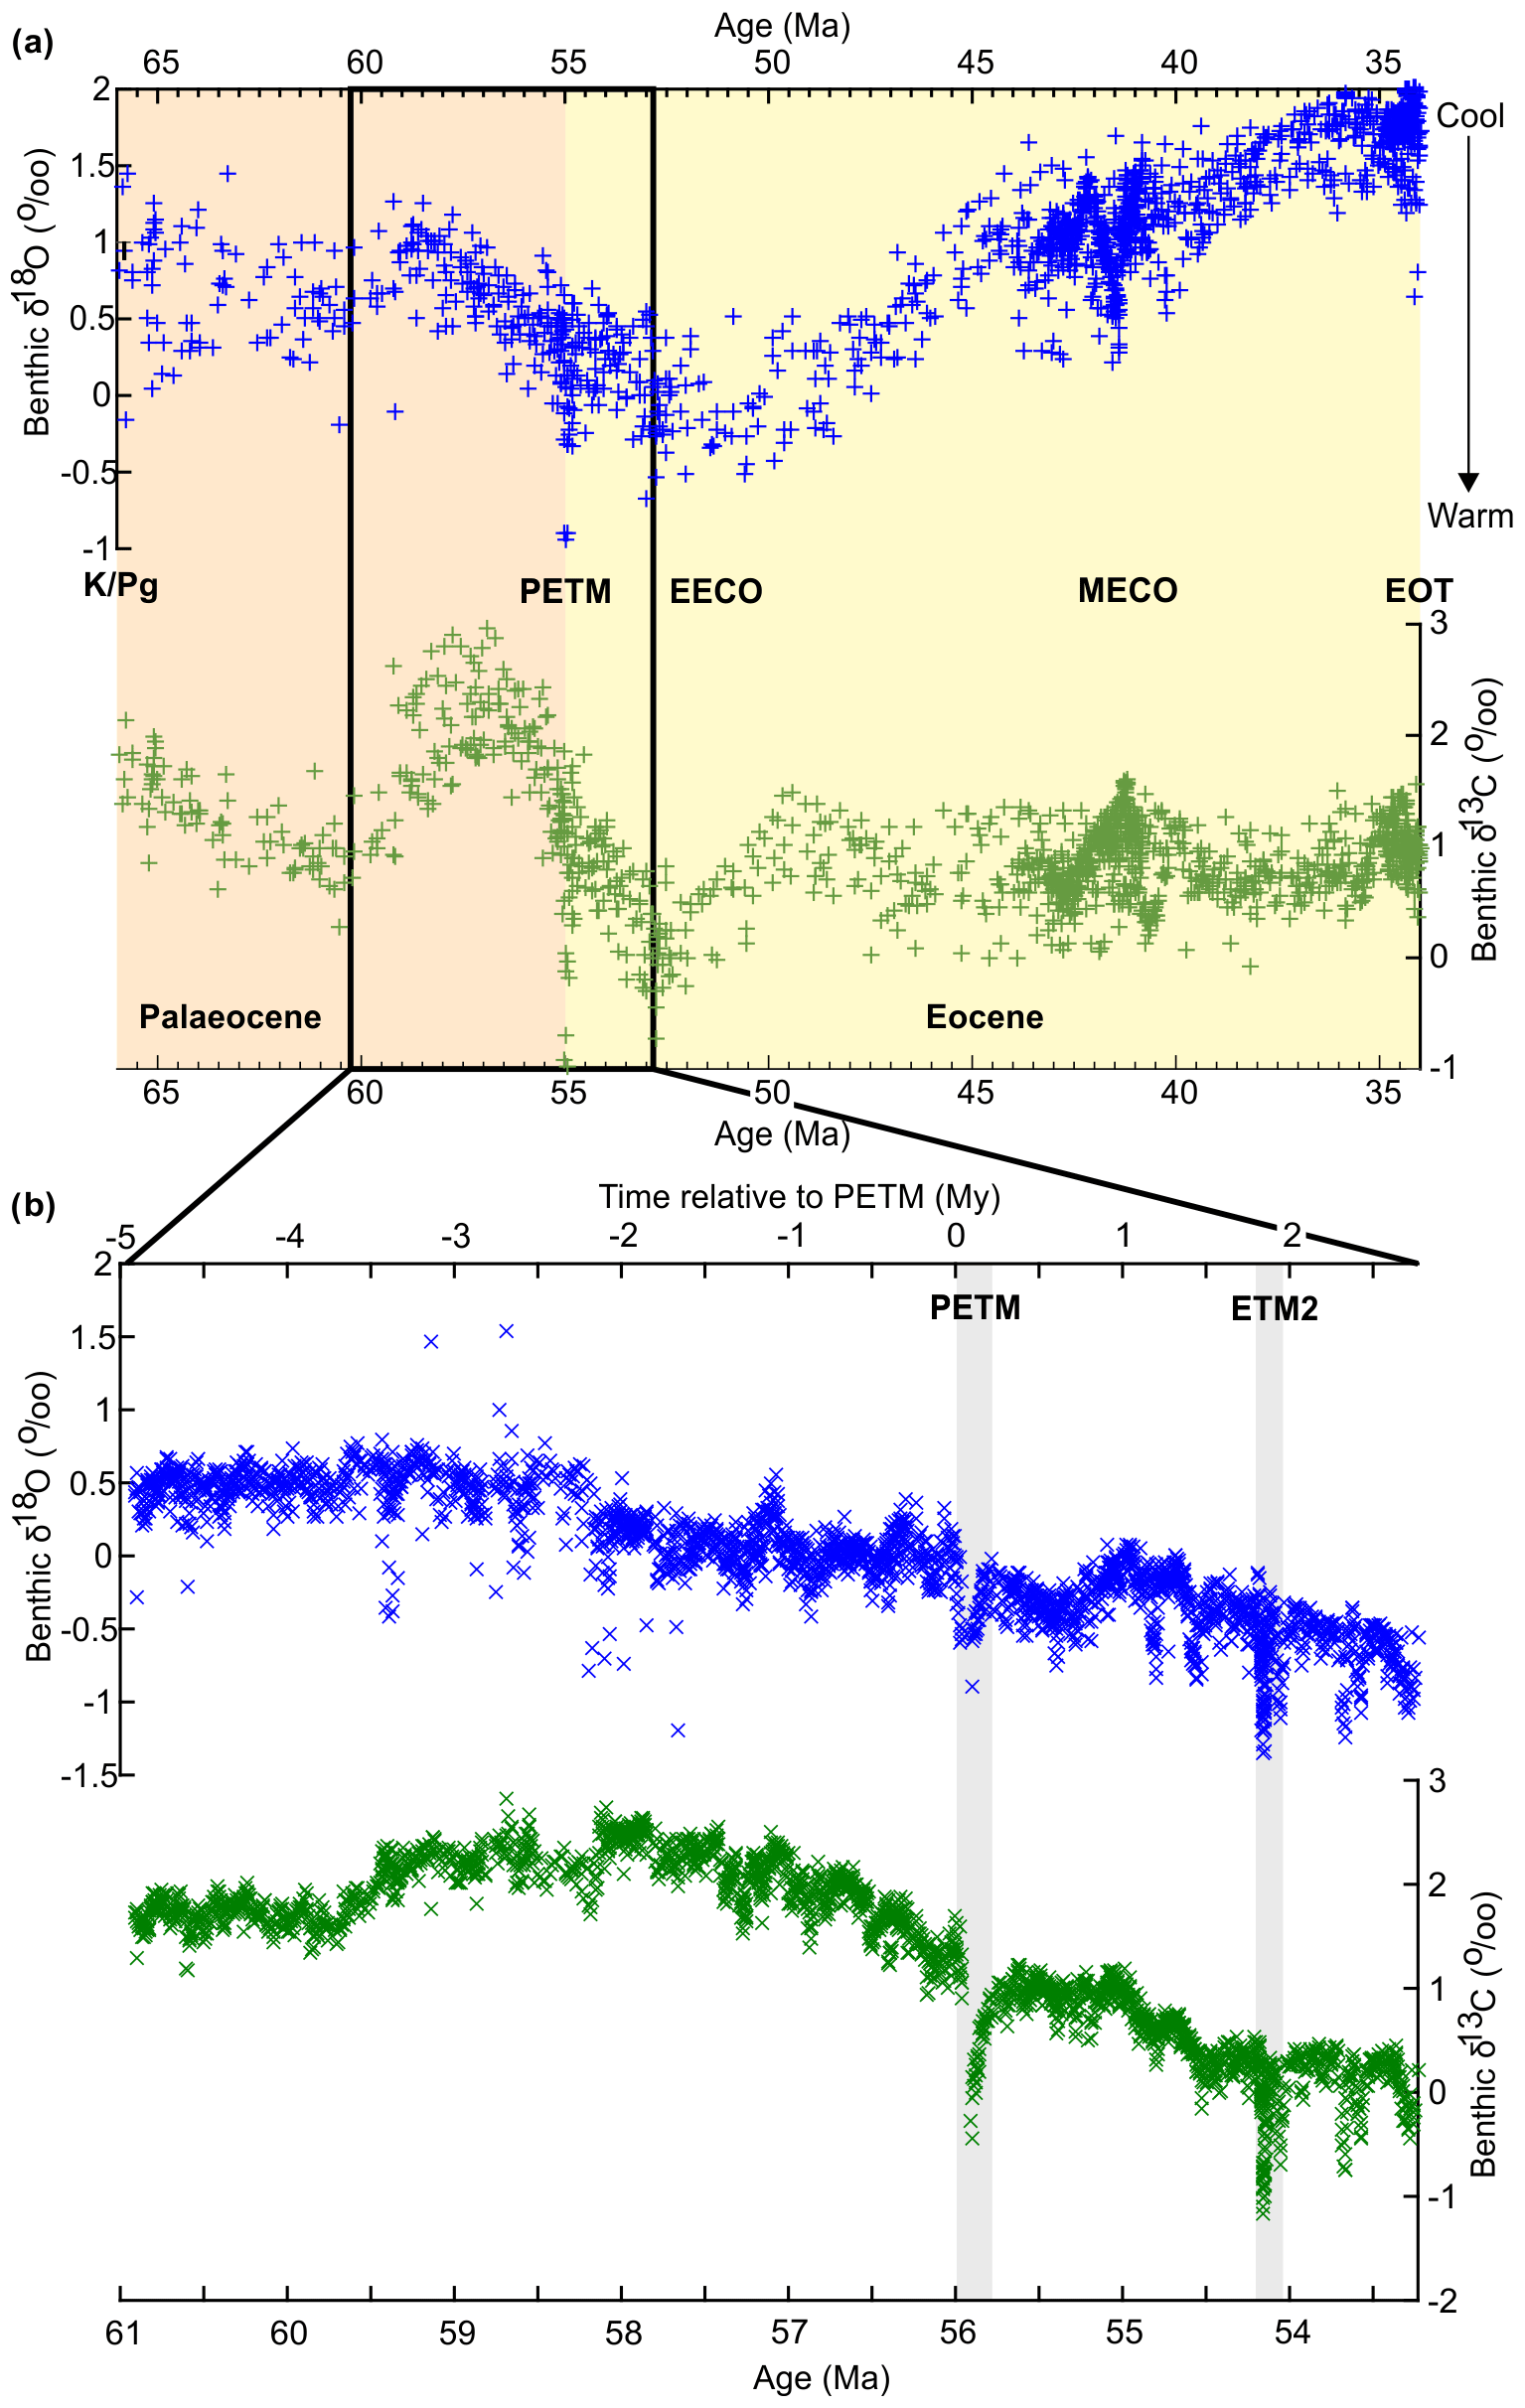
Figure 1Palaeorecords of benthic δ18O (blue) and δ13C (green) across (a) the Palaeocene and Eocene (data from global stack, Zachos et al., 2001, 2008) and (b) the late Palaeocene–early Eocene (LPEE) study interval (data from ODP Site 1262; Littler et al., 2014, with ages adjusted as per Westerhold et al., 2015). Significant climate and carbon cycle events are labelled, including the Cretaceous–Palaeogene boundary (K/Pg), Palaeocene–Eocene Thermal Maximum (PETM), Eocene Thermal Maximum 2 (ETM2), early Eocene climatic optimum (EECO), the mid-Eocene climatic optimum (MECO), and the Eocene–Oligocene transition (EOT), while the black box marks the LPEE interval analysed in this study. The mismatch in PETM date between the two datasets is a result of the updated age model of Westerhold et al. (2015) applied to the record of Littler et al. (2014) but not Zachos et al. (2001, 2008), which we have maintained so as to maintain consistency with published records.
The PETM was followed by the early Eocene climatic optimum (EECO; Fig. 1) containing subsequent hyperthermal events such as Eocene Thermal Maximum 2 (ETM2) at ∼54 Ma and ETM3 at ∼53 Ma, which are potentially paced by orbital eccentricity forcing interacting with long-term warming and discharging methane hydrate deposits to produce threshold responses past repeated tipping points (Archer et al., 2009; Kirtland Turner et al., 2014; Komar et al., 2013; Littler et al., 2014; Lourens et al., 2005; Lunt et al., 2011; Stap et al., 2010; Westerhold et al., 2007; Westerhold and Rohl, 2009). However, the PETM occurred in a different orbital setting to the later events, suggesting that the PETM required an additional external “push”, while the latter hyperthermals were eccentricity-paced tipping points (Littler et al., 2014). This push could have come from the emissions of the contemporaneous North Atlantic Volcanic Province (NAVP) eruptions both before and during the PETM (Frieling et al., 2016; Gutjahr et al., 2017; Storey et al., 2007; Svensen et al., 2004). Methane release from hydrate dissociation may also have been significantly limited or delayed by sediment transport processes, potentially limiting its role as a positive feedback (Minshull et al., 2016).
Many complex systems have been found to include tipping points, thresholds beyond which even small changes in condition can trigger the system to abruptly transition into a new equilibrium state (Dakos et al., 2015; Held and Kleinen, 2004; Lenton, 2013; Lenton et al., 2008; van Nes et al., 2016; Scheffer et al., 2001, 2009). Theory suggests that, prior to reaching such a tipping point, a system will exhibit “critical slowing down” of its dynamics – meaning a slowing recovery rate in response to perturbations – which can be detected as increasing trends in autocorrelation and variability in time series data (Carpenter and Brock, 2006; Dakos et al., 2008, 2012a; Kéfi et al., 2013; Lenton, 2011; Lenton et al., 2012a; Scheffer et al., 2009). Changes in skewness and kurtosis may also occur (although skewness can increase or decrease depending on the nature of the alternative stable state and potential wells), and if internal variability is high, a system can “flicker” between different states before undergoing a more permanent shift between them (Dakos et al., 2012a, 2013; Scheffer et al., 2009; Wang et al., 2012). Previous work has suggested that these indicators, which can be used as “early warning signals” (EWSs) or more generally as metrics of resilience (the capacity of a system to recover from disturbance and return to its reference state; Grimm and Wissel, 1997; Holling, 1973; Scheffer et al., 2001), may be detectable prior to some abrupt climate transitions in the palaeorecord (Dakos et al., 2008; Lenton, 2011), including the Eocene–Oligocene transition and during several Pleistocene climate shifts (Dakos et al., 2008; Lenton, 2011; Lenton et al., 2012a, b). However, autocorrelation and variance can also increase prior to non-catastrophic transitions, with or without bifurcations in phase space (Kéfi et al., 2013), or under some specific circumstances even decrease (Boettiger and Hastings, 2012b; Dakos et al., 2012b; Livina et al., 2012). Hence, here increasing autocorrelation and variance is viewed more broadly as indicating declining resilience of a system (i.e. weakening negative feedbacks and greater sensitivity to small shocks), whether or not a critical transition is imminent. Other potential issues with detecting changing system resilience in palaeorecords include infrequent sampling rate, dating uncertainties, the possibility of producing false positives or negatives, and the extent to which these methods are dependent on subjective parameter choices (Boettiger et al., 2013; Boettiger and Hastings, 2012a; Lenton, 2011) (see Methods for further discussion).
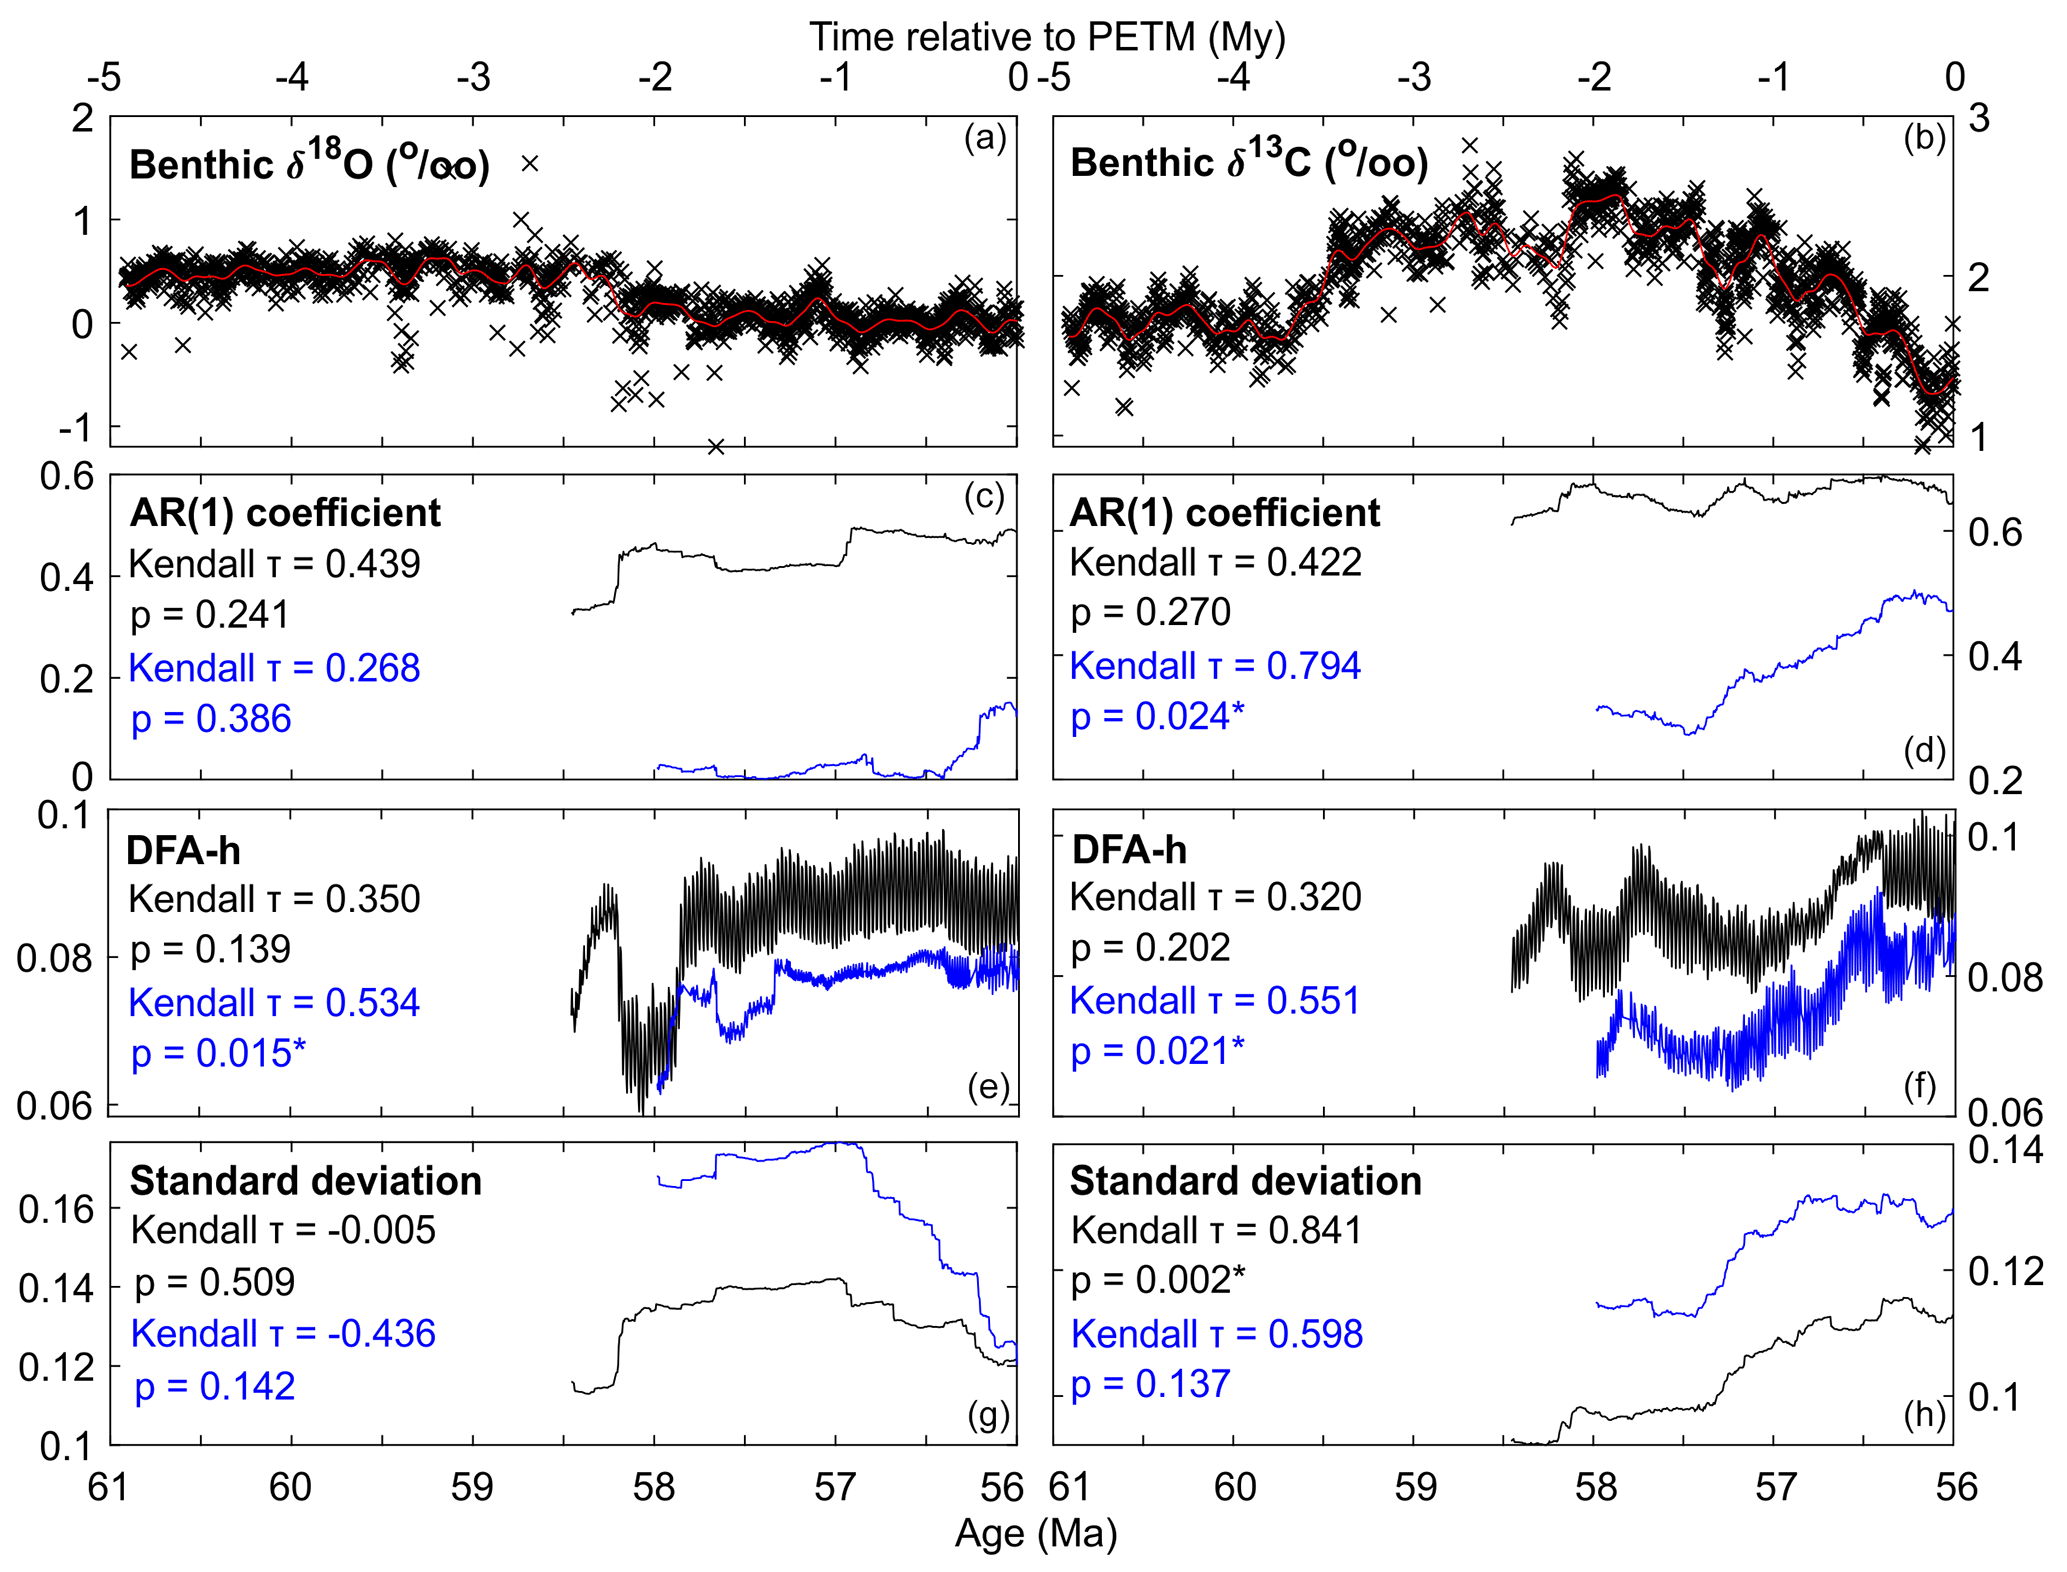
Figure 2Rolling window resilience analysis of benthic δ18O (a), (c), (e), (g) and δ13C (b), (d), (f), (h) in the run-up to the PETM. Panels (a) and (b) illustrate the palaeorecord (black crosses) and the detrending applied to the data (red line), with the panels below illustrating the results of the analysis for (c, d) AR(1) coefficient, (e, f) detrended fluctuation analysis h value, and (g, h) standard deviation calculated in a 50 % rolling window across each time series for both interpolated (black line) and non-interpolated (blue line) data with the Kendall τ rank correlation and bootstrapped p value for each. Results for skewness, kurtosis, and sensitivity analyses for all metrics can be found in the Supplement.
Here we test the hypothesis that the PETM and ETM2 are examples of tipping points being reached in the carbon–climate system following long-term destabilisation (e.g. of a sensitive carbon cycle capacitor rich in isotopically light carbon) by looking for declining resilience preceding them using published methodologies (Dakos et al., 2008, 2012a, Lenton et al., 2012a, b). Whilst a signal of declining resilience cannot prove the existence of a tipping point, its absence would tend to falsify the tipping point hypothesis. Palaeorecords suffer from greater dating uncertainties and a less frequent sampling rate than is possible with modern climate data, making robust time series analysis more challenging. Hence, sufficiently long and high-resolution palaeorecords available across the late Palaeocene and early Eocene were required in order to enable significant results to be obtained. To this end we use the ∼7.7 Myr benthic δ18O and δ13C palaeorecords from ODP Site 1262 in the South Atlantic (Littler et al., 2014) and subdivide the datasets into pre-PETM and post-PETM bins, as well as subdividing the post-PETM bin into pre-ETM2 and post-ETM2 bins, for separate analyses. These isotope records track the long-term global state of high-latitude climate and the carbon cycle, respectively (Zachos et al., 2001, 2008), and are therefore appropriate data choices for detecting the resilience of the global carbon–climate system, which in turn determines the long-term resilience of the whole Earth system as its key slow-timescale components.
A major limitation of the available palaeorecords is that their resolution is of the order of ∼3 kyr, which only allows us to monitor changes in the dynamics of the slowest parts of the carbon cycle and climate system (i.e. > 10 kyr). For the carbon cycle these could include the silicate weathering feedback, which is hypothesised to act as the main long-term negative feedback on atmospheric CO2 and therefore climate change (Berner, 1991; Berner et al., 1983; Kump and Arthur, 1997; Urey, 1952; Walker et al., 1981; Walker and Kasting, 1992), the strength of the biological pump and carbon burial rates in the ocean (Boscolo-Galazzo et al., 2018; Chamberlin, 1898; Derry and France-Lanord, 1996; France-Lanord and Derry, 1997; Hay, 1985; John et al., 2014), and medium-term fluctuations in the storage capacity of carbon reservoirs such as the deep ocean, methane hydrates, permafrost, or soil carbon (Batjes, 1996; Buffett and Archer, 2004; Cui et al., 2011; DeConto et al., 2012; Dickens et al., 1995; Klinger et al., 1996; Tarnocai et al., 2009). For the climate system, slow processes could include substantial reorganisations of ocean circulation (Hofmann and Rahmstorf, 2009; Rahmstorf, 2002; Stocker and Wright, 1991; Stommel, 1961) and the growth or collapse of large ice sheets (although no substantial ice sheets existed at this time) (DeConto et al., 2008; DeConto and Pollard, 2003; Pagani et al., 2011; Pollard and DeConto, 2009). Any shorter-term drivers of instability closer to the event, for example changes in ocean and atmospheric dynamics or precursor warming on millennial timescales (Secord et al., 2010; Sluijs et al., 2007a), will be missed and could thus constitute “missed alarms”. As a result, in this study we focus only on the long-term processes in the global carbon–climate system prior to and across the PETM and ETM2.
We use multiple indicators, including autoregressive coefficient at lag 1 (AR(1)) and detrended fluctuation analysis h value (DFA-h) (Lenton et al., 2012b; Livina and Lenton, 2007) to reveal slowing down, and standard deviation (SD) and non-parametric drift–diffusion–jump (DDJ) model function metrics (Dakos et al., 2012a) to reveal increasing variability. An overall increasing trend in AR(1) or DFA-h would show the slow parts of the climate or carbon systems were recovering more slowly from regular perturbations, while increasing SD or variance as measured by the DDJ model would show each system was being perturbed further from their current state. Together they indicate a system being destabilised and becoming less resilient to being knocked into a new state. Skewness and kurtosis are also measured to provide further context (see the Supplement) as both may change in the presence of more extreme values. Sensitivity analyses are conducted in order to ensure detected signals are robust across different methodologies and parameter choices (see Methods and the Supplement).
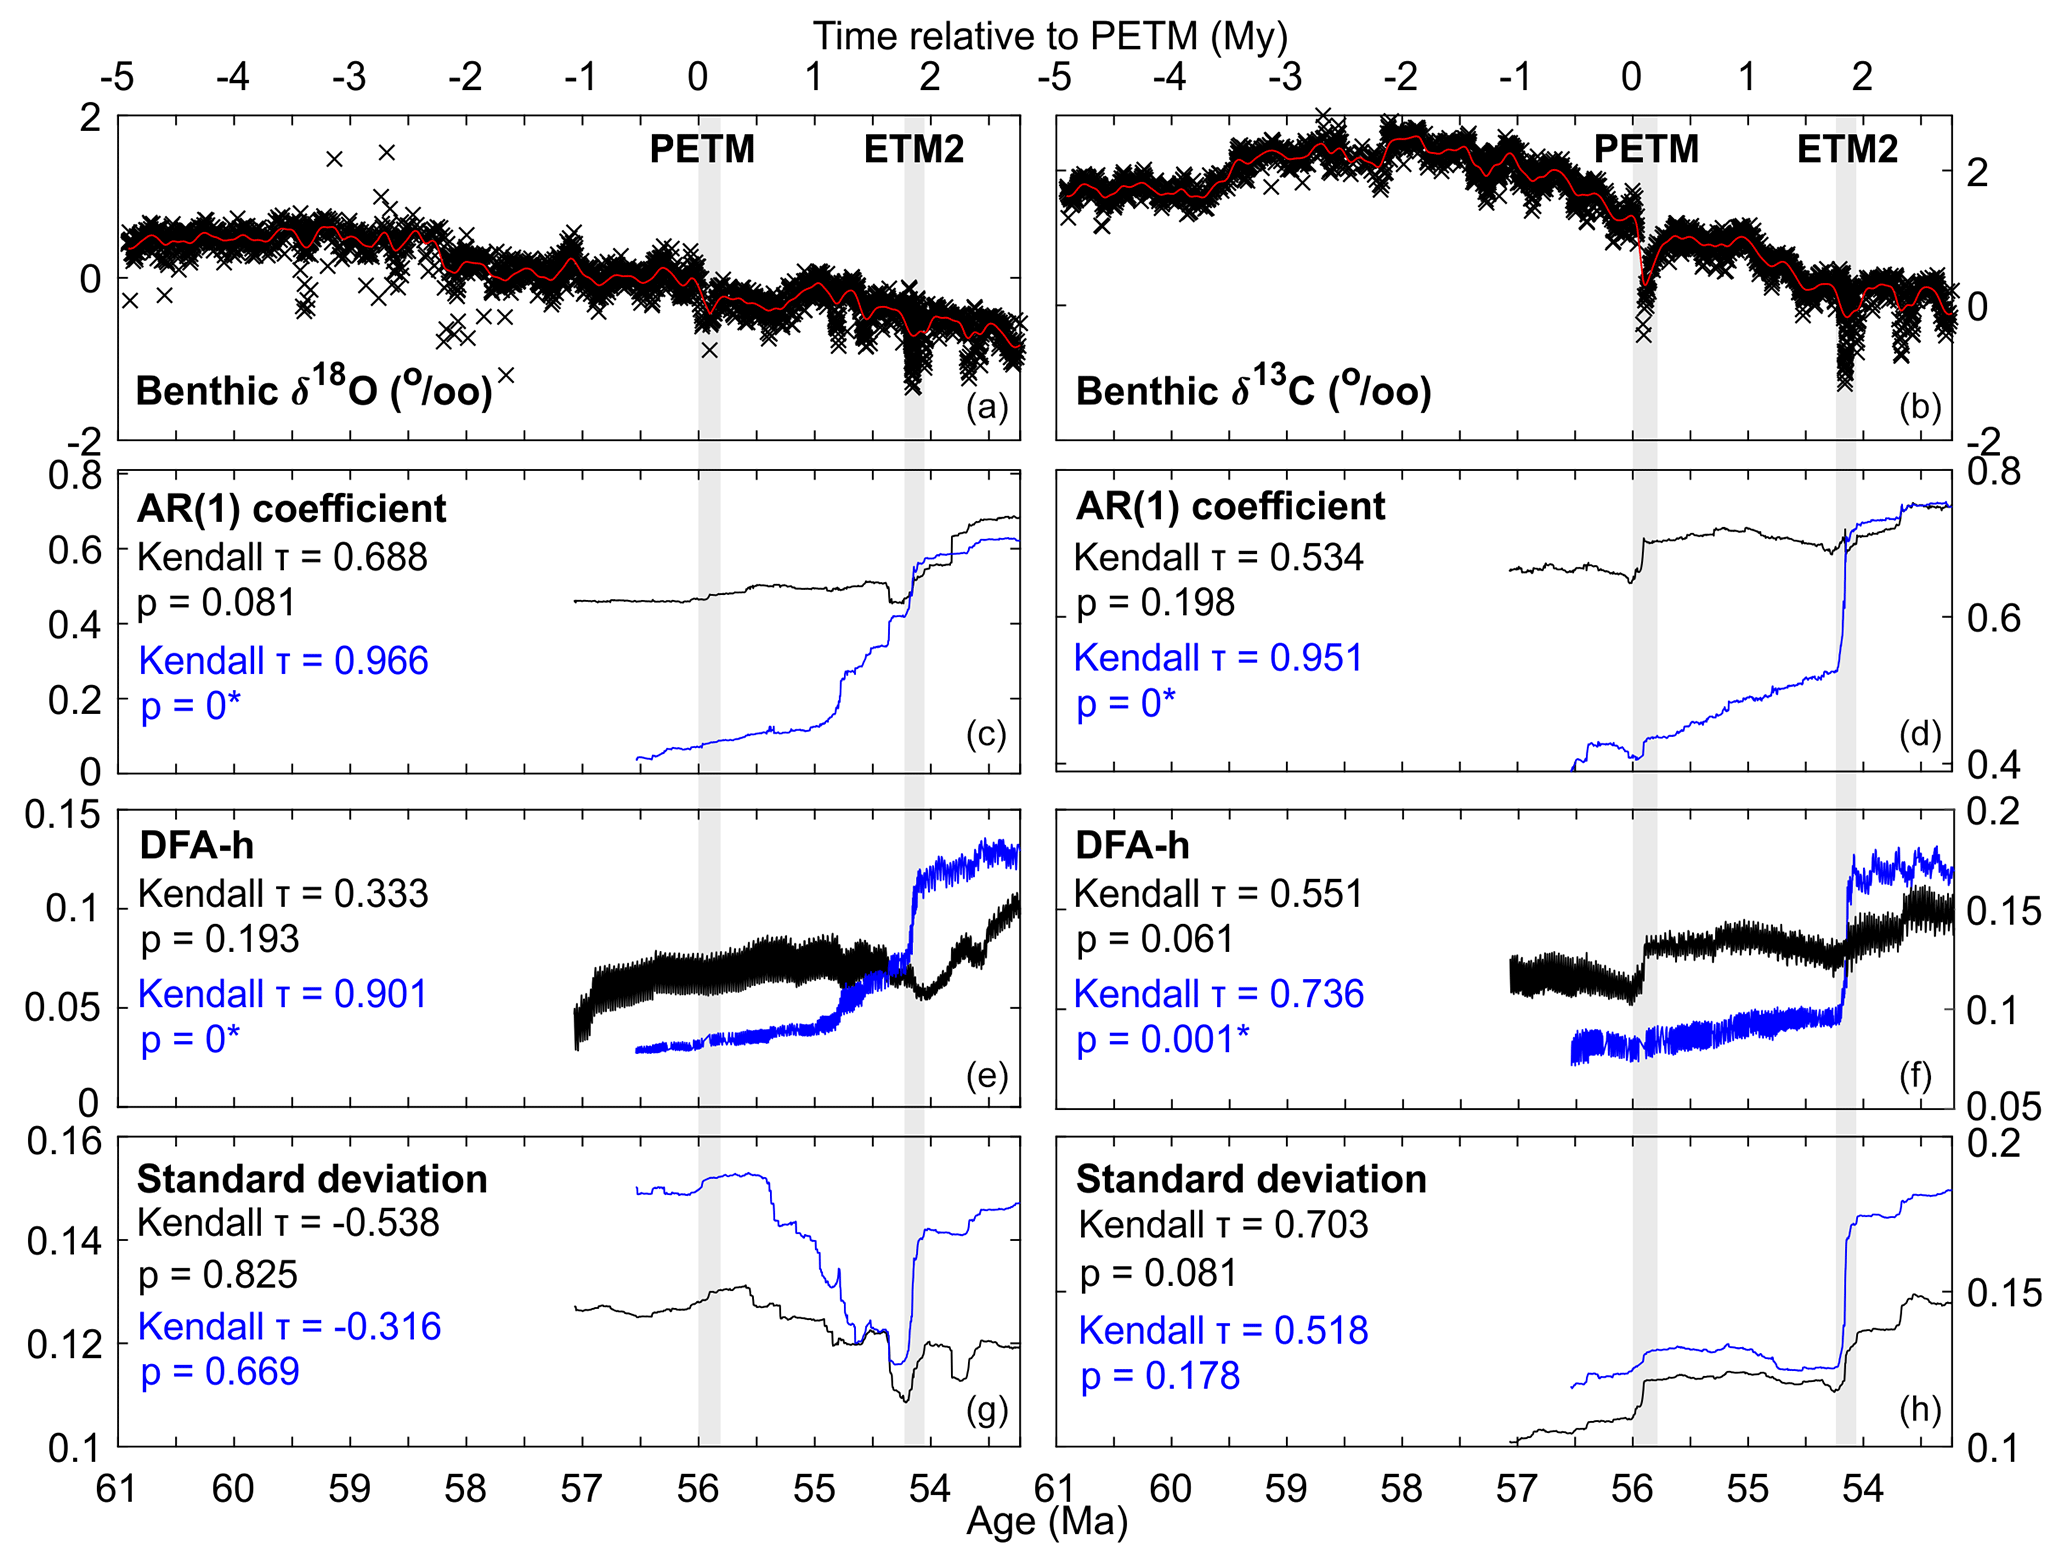
Figure 3Rolling window resilience analysis of benthic δ18O (a), (c), (e), (g) and δ13C (b), (d), (f), (h) across the PETM and ETM2. Panels (a) and (b) illustrate the palaeorecords (black crosses) and the smoothed record used to detrend the data (red line), with the panels below illustrating the results of the analysis for (c, d) AR(1) coefficient, (e, f) detrended fluctuation analysis h value, and (g, h) standard deviation calculated in a 50 % rolling window across each time series for both interpolated (black line) and non-interpolated (blue line) data with the Kendall τ rank correlation and bootstrapped p value for each. The PETM and ETM2 are marked by the grey bars. Results for skewness, kurtosis, and sensitivity analyses for all metrics can be found in the Supplement.
2.1 Rolling window metrics
For the rolling window metrics we follow the methodology first outlined in a climate context by Held and Kleinen (2004) and subsequently used by other studies, including Dakos et al. (2008, 2012a), Lenton et al. (2012a, b), Livina and Lenton (2007), and the Early Warning Signals Toolbox developed based on this work (documented at http://www.early-warning-signals.org (last access: 15 October 2018) and available in as the earlywarnings package in R; R Foundation for Statistical Computing, 2016). After selecting the dataset and for the pre-PETM analysis terminating it just prior to the hypothesised transition to avoid biasing the analysis, the data are first interpolated (using linear interpolation by default with the interp1 function in MATLAB; The MathWorks Inc., 2016) to provide the equidistant data points required for rigorous statistical analysis and assumed by the AR(1) model. However, interpolation itself can introduce statistical artefacts into the analysis as, by definition, the addition of interpolated data points increases self-similarity and thus autocorrelation in the dataset. In palaeorecords this tends to result in an artificial increase in autocorrelation in parts of the dataset with either sparser data points or complete gaps in the data, but in this record there is no marked systematic shift in data time steps (Fig. S5). As a result we also analyse non-interpolated data in order to assess the sensitivity of our results to interpolation. Following this, the data are then detrended by subtracting the smoothed dataset, estimated with a Gaussian kernel smoothing function (using the ksmooth function in R), in order to remove any long-term trends as these are not the focus of the analysis. This makes the dataset stationary – a necessary prerequisite for time series analysis – but this also somewhat reduces the value of lag 1 autocorrelation in the results. Bandwidth is an important consideration in this process and is adjusted heuristically for the datasets in order to best remove long-term trends but leaving short-term fluctuations, in this case giving a Gaussian kernel bandwidth of 0.1. This removes long-term secular trends and orbital cyclicity (> 100 kyr) (Figs. 2, 3a and b), leaving only the short-term noise that reveals the resilience of the underlying longer-term (> 10 kyr) processes.
An autoregressive model of order 1 (AR(1)) is fitted to the data within a rolling window (using the generic_ews function of the earlywarnings package in R). The AR(1) model is of the form , fitted by an ordinary least-squares method with a Gaussian random error and a constant time step. Following previous studies the default window size is set at half the length of the dataset, but as part of our sensitivity testing we also repeat our analyses for window sizes between 25 % and 75 % (Figs. S1–S4). The choice of window length is a trade-off between dataset resolution and the reliability of the estimate of the indicator, with a short window allowing shorter-term changes in indicators to be tracked at the cost of lower estimate reliability and vice versa. On the same rolling window the absolute skewness, kurtosis, and standard deviation of the dataset are also calculated (also using the generic_ews function of the earlywarnings toolbox in R). Detrended fluctuation analysis h value (DFA-h) was also used as an alternative measure to AR(1) for short-term memory and critical slowing down in the dataset bins (performed using the DFA function of the fractal package in R). DFA extracts the fluctuation function over a window s, and if the data are long-term power-law correlated, the fluctuation function F(s) increases as a power law: F(s)∝sh, where h is the DFA fluctuation exponent (Peng et al., 1994) and reaches value 1.5 at a critical transition (Lenton et al., 2012b; Livina and Lenton, 2007).
Finally, the likelihood of there being a real trend in the results is calculated by estimating the non-parametric Kendall rank-correlation statistic (τ), which measures the strength of an indicator's tendency to increase (≫ 0) or decrease (≪0) against the null hypothesis of randomness (∼0) (also using the generic_ews function of the earlywarnings toolbox in R). However, this statistic is most robust when the trend is consistent over a long period, while increasing but oscillating trends or trends only at the very end of the record can produce weak or even negative values despite a clearly visible trend (Dakos et al., 2012a). We calculate a p value for each metric by bootstrapping our detrended datasets to generate 1000 surrogate records (or ARIMA model-generated for AR(1) and DFA-h) with equivalent mean and variance, re-calculating the metric and Kendall τ value for each, and finding the proportion of Kendall τ values equal to or greater than that of the original palaeorecord (Dakos et al., 2008).
2.2 Binned metrics
As well as performing rolling window time series analysis, we also measure AR(1), SD, skewness, and kurtosis on data (detrended but not interpolated) binned into pre- and post-event bins and excluding the events themselves to provide simple before–after comparisons of changes across the events. To this end the datasets (n=2302) were binned into pre-PETM (n=1331), post-PETM (n=921), PETM to ETM2 (n=593), and post-ETM2 (n=240) bins, excluding data points from during each event so as to avoid biasing by extreme or missing data. A p value is calculated for each metric using a permutation test (i.e. by reshuffling and repartitioning the before–after event data into the same-sized bins 1000 times and comparing the metrics' resultant before–after differences with the observed metric before–after difference), except for AR(1) and DFA-h for which we instead use AR(1) model-derived surrogate data to compare against (i.e. by generating 1000 surrogate datasets with the same AR(1) value, mean, and variance as the before-event bin over the length of the after-event bin and comparing this distribution to the observed after-event AR(1) value).
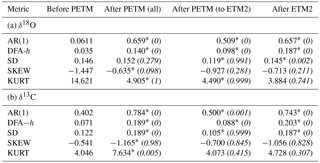
Table 1Values of binned metrics for both benthic δ18O (a) and δ13C (b). Bins are of all data (detrended but not interpolated) before the PETM, all data after the PETM (including data from within ETM2), all data between the PETM and ETM2, and all data after ETM2. The indicators are AR(1) coefficient, detrended fluctuation analysis h value (DFA-h), standard deviation (SD), skewness (SKEW), and kurtosis (KURT). Each value is followed by a p value (in italics within parentheses and preceded by a * if significant) computed using a permutation test, except for AR(1) and DFA-h for which we instead use AR(1) model-derived surrogate data to compare against (see Methods for details).
2.3 Non-parametric drift–diffusion–jump model
A model-based alternative to the time series analysis methods (whether rolling window or bin based) above is to fit a general non-parametric drift–diffusion–jump model to the dataset with as a surrogate for an unknown data-generating process (Carpenter and Brock, 2011; Cox and Ross, 1976; Dakos et al., 2012a; Johannes, 2004). In this model functions are estimated for drift, diffusion, and jump processes using non-parametric regression; drift measures the local rate of change, diffusion measures the standard deviation of the relatively small shocks that occur at each time step, and jumps are large intermittent shocks. The conditional variance of the data is also estimated from the non-parametric regression and represents the variance of the data from their conditional expectation estimated using kernel regression. We use the ddjnonparam_ews function in the earlywarnings package on R, with the default options of a bandwidth of 0.6 and 500 points for computing the kernel. We use raw data for this analysis, with no detrending or interpolation and without log transforming the data first. In interpreting the results we focus on the general long-term trends in the estimated terms as many of the shorter-term fluctuations potentially represent model overfitting.
2.4 Limitations
Despite positive results in some palaeoclimate EWS studies (Lenton, 2011), there are several potential issues with searching for resilience indicators in palaeorecords. Palaeorecords suffer from greater dating uncertainties and a less frequent sampling rate than is possible with modern climate data, making robust time series analysis more challenging. Most indicators also do not reveal exact information about the nature of the transition itself, with increasing slowing down and variability detected prior to both catastrophic and non-catastrophic transitions featuring a bifurcation in phase space and even before non-catastrophic transitions without a bifurcation (Kéfi et al., 2013). Concerns have also been raised over the likelihood of producing false positives (when EWSs appear to indicate an impending transition which never occurs) or false negatives (i.e. a “missed alarm” when EWSs may be entirely absent prior to a known critical transition) and the extent to which these methods are dependent on subjective parameter choices (Boettiger et al., 2013; Lenton, 2011). There is a risk that selecting and analysing known or suspected critical transitions in the palaeoclimate record is particularly liable to false positives, as positive indicators at the transitions could potentially have occurred purely by chance rather than due to systemic instability (Boettiger and Hastings, 2012a). However, it has been argued that EWSs can be reliably detected if both increasing autocorrelation and variance are seen prior to the transition rather than one of these indicators alone (Ditlevsen and Johnsen, 2010). Detecting multiple, consistent, and robust signals from the indicators can be indicative of decreasing system resilience even if a catastrophic transition is not reached or is instead triggered by an external perturbation rather than internal processes (Dakos et al., 2015).
3.1 Rolling window metrics
Rolling window metrics prior to the PETM reveal a sudden increase in AR(1) and SD after ∼58.2 Ma in the interpolated benthic δ18O record associated with a step in the data (and the benthic δ13C record peaking), which despite a temporary drop in DFA-h suggests some degree of destabilisation of the slow climate system prior to the PETM (Figs. 2 and S1). However, the subsequent decline of standard deviation after ∼57 Ma (likely to partially be the result of earlier extreme data points from ∼58.5–59.5 Ma leaving the rolling window) does not support a tipping point involving deep ocean temperature at the PETM, which is also indicated by the non-significant bootstrapped p values for the metrics of both interpolated and non-interpolated data. The non-interpolated DFA-h metric does show a significant increase (p=0.015), which would suggest systemic slowing down, but this does not match the non-interpolated AR(1) metric. Alternatively, these results could represent a “missed alarm” as the shorter-term climate dynamics that might be critical to the dynamics of the tipping point are not sufficiently resolved by the available data.
The benthic δ13C record shows clearer evidence of declining resilience in the slow components of the carbon cycle, with long-term increases in AR(1), DFA-h, and SD in the run-up to the PETM with steps at ∼58.2 and ∼57.3 Ma which are consistent across the sensitivity analyses (absolute skewness also increases, while kurtosis declines up to the PETM; Fig. S1). Bootstrapped p values indicate that the δ13C SD trend is significant (p=0.002) for the interpolated data, while the δ13C AR(1) and DFA-h trends are significant (p=0.024 and p=0.021, respectively) for the non-interpolated data. This supports a long-term slowing down in benthic δ13C in the late Palaeocene, which may reflect a gradually forced destabilisation of the global carbon cycle prior to the PETM.
Rolling window analysis across the whole of the late Palaeocene–early Eocene (LPEE) interval suggest but cannot prove systemic changes in carbon cycle and climate (in)stability across both the PETM and ETM2 (Figs. 3 and S2). Between the PETM and ETM2 δ18O AR(1) and DFA-h increase up until ∼200 kyr before ETM2 and SD experiences a small temporary increase followed by a larger decrease. In contrast, all metrics for δ13C experience a rapid jump during the PETM and then remain relatively stable until ETM2. Following ETM2, δ18O AR(1) and DFA-h increase significantly while SD increases slightly, whereas for δ13C all metrics (as well as absolute skewness and kurtosis; Fig. S2) consistently increase. However, the bootstrapped p values indicate that none of these trends are significant for the interpolated data, but that for the non-interpolated data the increases in AR(1) and DFA-h for both δ18O and δ13C are highly significant (p=0 to 0.001). This indicates that there is some evidence for slowing down – but not for increased variability – in both the δ18O and δ13C data and therefore the long-term climate system and carbon cycle across the LPEE interval into the Eocene, but this is dependent on not interpolating the data prior to the analysis. It should also be recognised that the abrupt shifts in δ13C at the PETM and ETM2 are not fully removed by detrending prior to the analysis; hence, they are at least partly responsible for the upward steps in the indicators at the events.
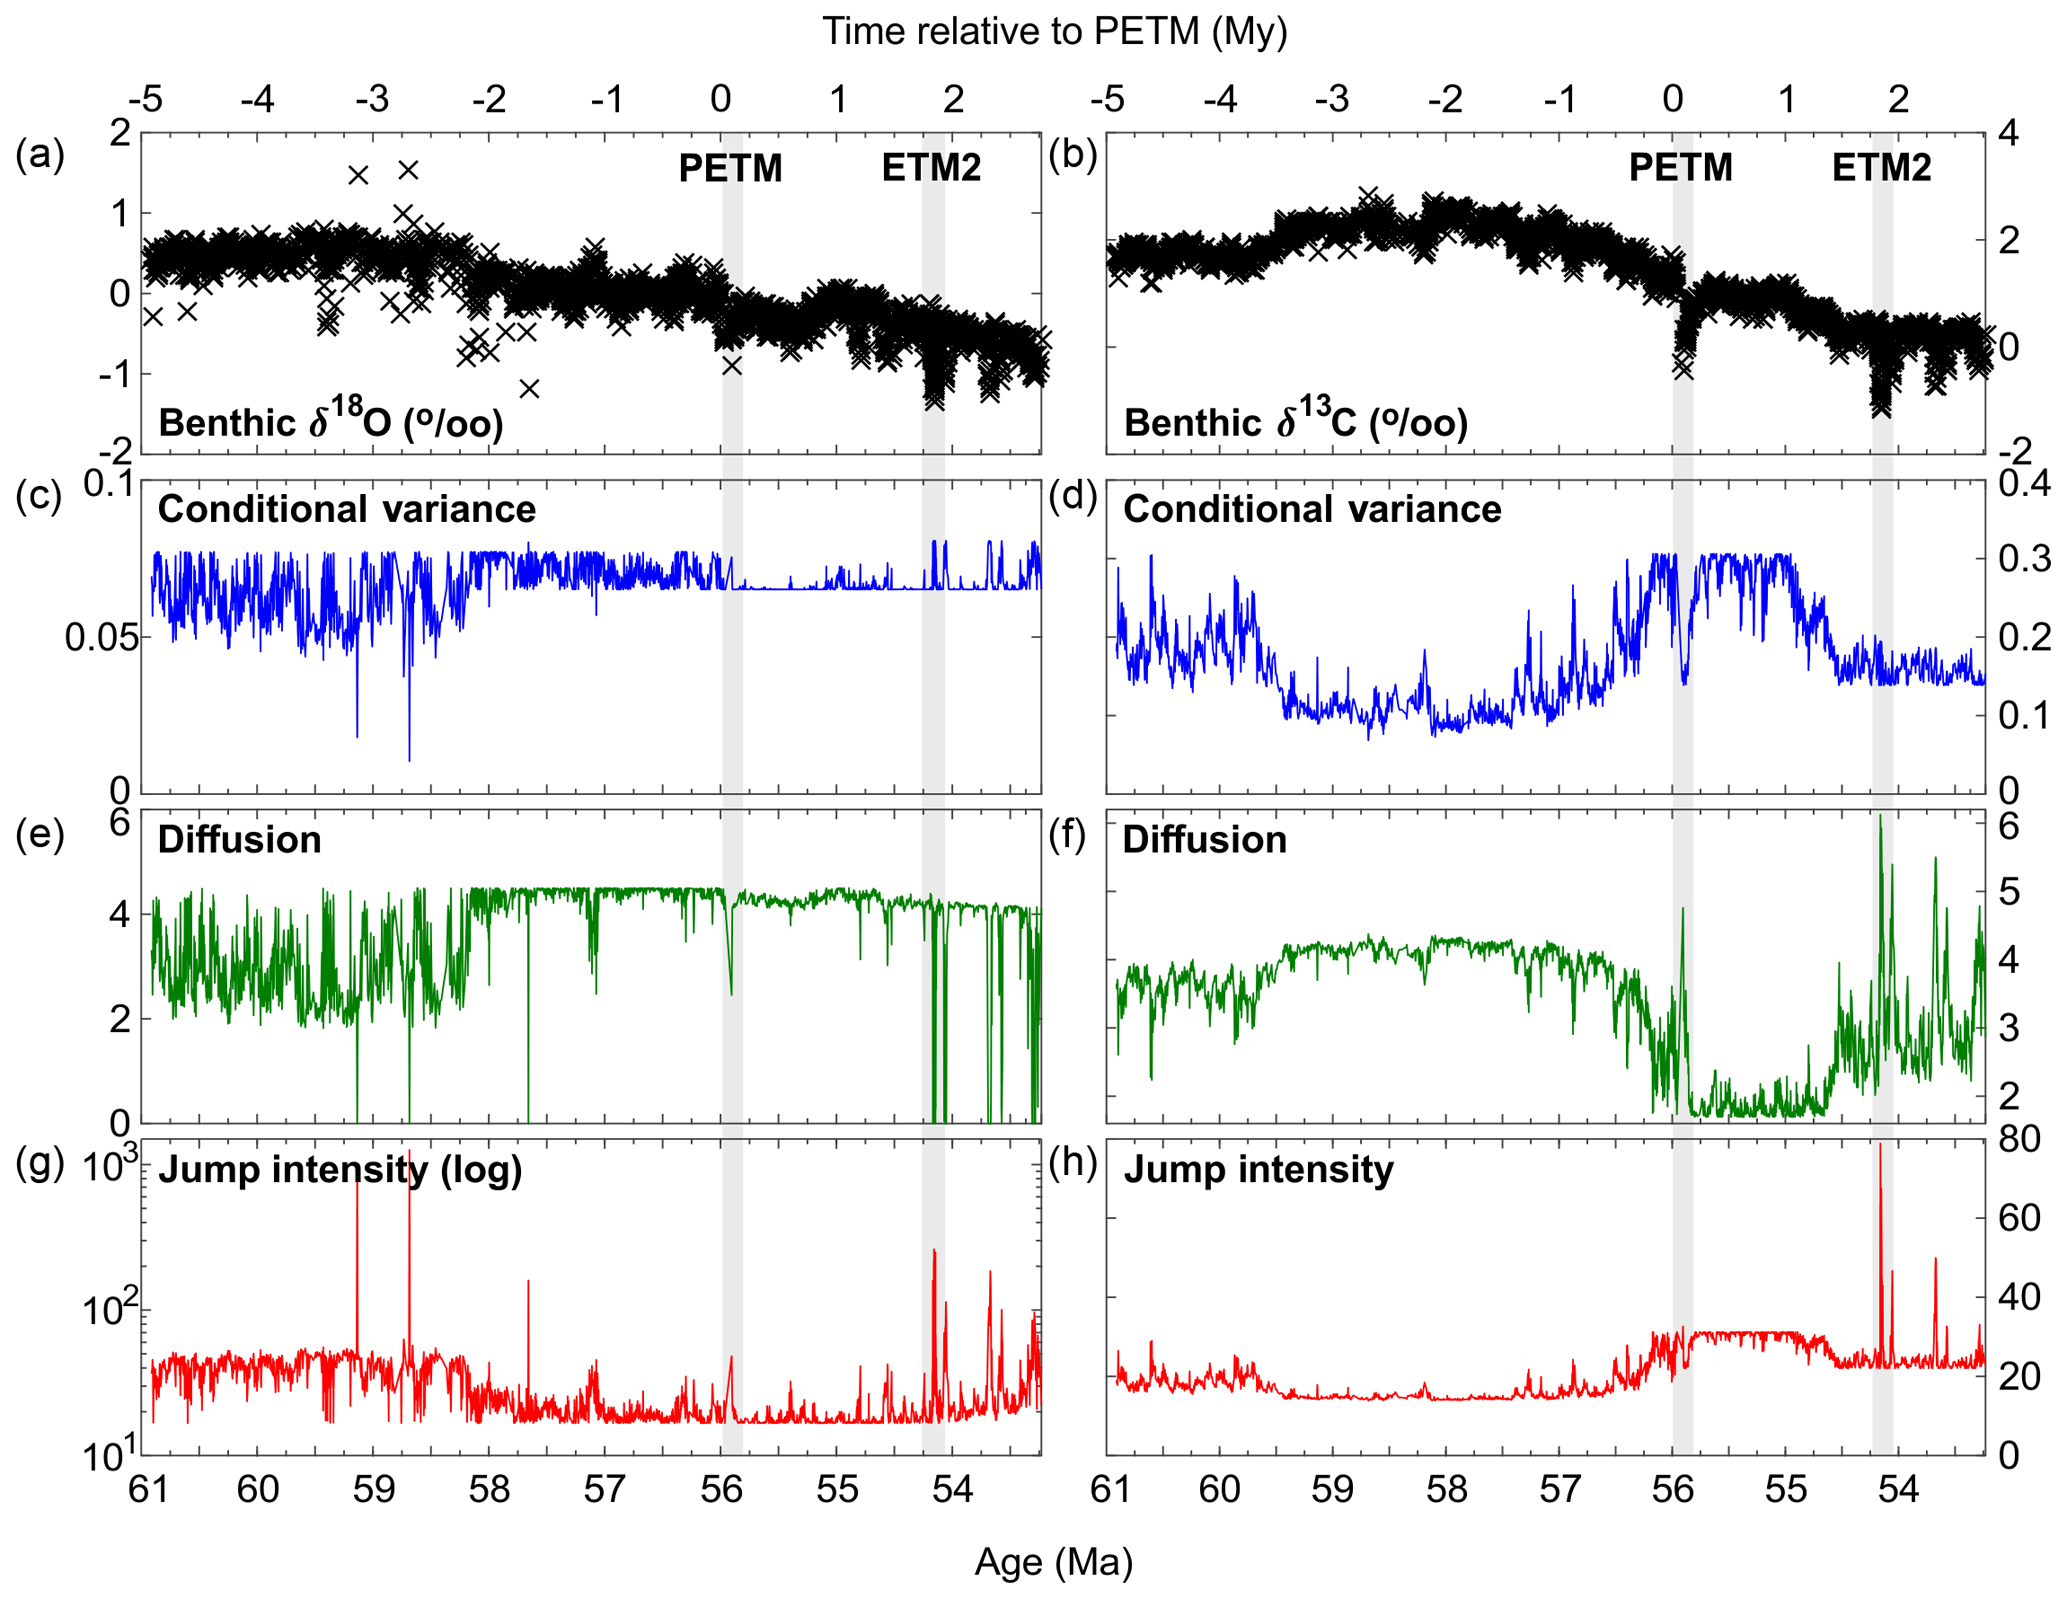
Figure 4Non-parametric drift–diffusion–jump model functions of benthic δ18O (a), (c), (e), (g) and δ13C (b), (d), (f), (h) across the PETM and ETM2. Panels (a) and (b) illustrate the palaeorecords (black crosses), with the panels below illustrating the model functions for (c, d) conditional variance (blue line), (e, f) diffusion (green line), (g, h) and jump intensity (red line) for each palaeorecord (drift is not plotted). The PETM and ETM2 are marked by the grey bars.
3.2 Binned metrics
To address the issue of large excursions failing to be removed by detrending for the rolling window metrics, as well as the issue of data gaps caused by dissolution at the peak of each event (Littler et al., 2014), we calculate aggregate metrics (i.e. no rolling windows) on the binned data (excluding data from within the events) (Table 1). The binned metrics show significant increases in AR(1) across both the PETM and ETM2 for δ18O and δ13C, with DFA-h also significantly increasing across the PETM and ETM2 for δ18O and across ETM2 for δ13C. SD significantly falls in the interval between the PETM and ETM2 and then significantly increases across ETM2 for both datasets, but the significant increase for δ13C for the all data after the PETM is likely to be biased by the inclusion of extreme data points within ETM2. These results are consistent with the rolling window metrics, except for δ13C SD, which in the rolling window metrics is higher between PETM and ETM2 than before the PETM and is likely to be the result of excluding the extreme data values during the PETM itself in the binned analysis (with SD beginning to drop just before the ETM2 in the rolling window analysis once the PETM leaves the window). These results indicate both the long-term climate system and carbon cycle slowed down to some extent after both the PETM and ETM2 (but became less variable following the PETM itself until ETM2), providing support for the slow parts of global carbon–climate system being progressively destabilised through the LPEE interval and into the Eocene by both of the hyperthermal events but not for any tipping points.
3.3 Non-parametric drift–diffusion–jump model
Fitting a non-parametric drift–diffusion–jump model to the datasets provides independent model-based metrics to compare to the rolling window metrics, with terms for the conditional variance measuring variance from dataset's conditional mean (estimated by kernel regression), diffusion measuring the standard deviation of regular small shocks at every time step, and jump intensity measuring either irregular large shocks or flickering (Carpenter and Brock, 2011; Dakos et al., 2012a) (Fig. 4). For benthic δ18O this model reveals an overall increase in conditional variance and diffusion and a reduction in jump intensity ∼2 Myr before the PETM, followed by a slight decrease in conditional variance after the PETM and intermittent spikes in jump intensity and conditional variance during and following ETM2. This suggests the climate shifted to a state with higher variability featuring regular small shocks ∼2 Myr prior to the PETM and became slightly less variable following the PETM, but featured larger irregular shocks during and after ETM2. While this suggests some degree of climate instability in the ∼2 Myr before the PETM and following ETM2, there is no evidence of a critical transition in the climate system at the PETM or ETM2 themselves. In contrast, the benthic δ13C model reveals decreasing diffusion and increasing conditional variance and jump intensity in the 1.5 Myr run-up to the PETM, indicating increasing total variability driven by large irregular shocks and consistent with a critical transition being approached in the carbon cycle at the PETM (Dakos et al., 2012a). Conditional variance and jump intensity remain high and diffusion remains low for ∼1 Myr after the PETM, before reversing ∼300 kyr before ETM2 except for brief spikes in both diffusion and jump intensity during and after ETM2. This indicates that variability in the carbon cycle remained high and driven by large shocks for ∼1 Myr after the PETM, but that variability mostly shifted towards smaller regular shocks prior to and after ETM2. This difference in the sources of variance prior to each event (the PETM is preceded by elevated jump intensity and overall conditional variance, whereas ETM2 is preceded by increased diffusion and decreased jump intensity) suggests potentially differing carbon cycle dynamics and drivers prior to each event. The shift in variability before ETM2 also slightly precedes the biotic turnover detected in both marine and terrestrial records in the ∼200 kyr prior to ETM2, despite there being no obvious shift in the palaeorecords that may have driven this turnover (Westerhold et al., 2018). Overall the δ13C DDJ results are consistent with elevated carbon cycle instability following the PETM, but suggest that ETM2 was not preceded by the same dynamics as the PETM.
In summary, both rolling window metrics before and across the PETM, binned metrics, and non-parametric drift–diffusion–jump models indicate that there was a decline in variability – suggesting a loss of resilience – in the slow components of the carbon cycle before the PETM. Following both the PETM and ETM2 there is also evidence of slowing down in both the long-term carbon cycle and climate system, indicating that both events led to a long-standing destabilisation of the carbon–climate system. In contrast, while there is some evidence for destabilisation in the δ18O data prior to and after the PETM, there is no clear evidence of a critical transition in the climate system at this time. Minimal lag between δ18O and δ13C in the late Palaeocene indicates close coupling between climate and the carbon cycle prior to the PETM (Littler et al., 2014), so the observed instability in the climate system is likely to have been induced by the contemporaneous destabilisation of the carbon cycle. Furthermore, ETM2 appears to be preceded by different carbon cycle dynamics to the PETM, which fits with the suggestion that the PETM required an extra “push” unlike the later eccentricity-paced hyperthermals, which might represent more classical tipping points (Littler et al., 2014). These results are consistent with the hypothesis of a gradual destabilisation of the long-term carbon cycle in the ∼1.5 Myr preceding the PETM (starting at ∼57.5 Ma, intensifying after ∼56.5 Ma) associated with increasing pCO2 concentrations and the warming seen in the benthic δ18O record from ∼58.2 Ma. This coincides with the North Atlantic Volcanic Province (NAVP) eruptions between 61 and 57 Ma and their associated volcanic and thermogenic CO2 and methane emissions, with subsequent large-scale eruptions from ∼56.1 Ma (possibly preceded by some degree of cryptic degassing coinciding with the intensified carbon cycle destabilisation from ∼56.5 Ma; e.g. Armstrong McKay et al., 2014) potentially triggering or prolonging the PETM (Frieling et al., 2016; Storey et al., 2007; Svensen et al., 2004). This time also coincides with a dramatic long-term decrease in organic carbon storage following a large build-up as indicated by the downturn in benthic δ13C from ∼58 Ma (Fig. 1), either as a result of large-scale methane hydrate or peat dissociation and oxidation in response to warming (Dickens, 2011; Komar et al., 2013; Kurtz et al., 2003) or a reduction in marine biological pump strength as higher temperatures lead to increased respiration rates of particulate organic carbon (Boscolo-Galazzo et al., 2018; John et al., 2014). This weakening of the organic carbon burial feedback in response to volcanism-driven warming could be the primary driver of the observed geological carbon cycle destabilisation in the ∼1.5 Myr prior to the PETM and may have in turn prolonged the duration of the PETM itself. Reconstructed silicate weathering feedback strength fell by ∼40 % in the ∼3 Myr after the PETM due to reduced continental weatherability (Caves et al., 2016; van der Ploeg et al., 2018), potentially allowing the carbon–climate system to remain destabilised and susceptible to further shocks long after the PETM and ETM2 as observed. The hypothesis of a carbon cycle tipping point at the PETM survives our tests (although they cannot directly confirm it or rule out an external trigger). In contrast, the hypothesis of a tipping point in deep ocean temperature (as recorded by the δ18O record considered) is not supported. A large external perturbation, e.g. a massive, abrupt injection of volcanic carbon from the NAVP during the PETM (Gutjahr et al., 2017; Storey et al., 2007) or the suggestion of a meteorite strike (Schaller et al., 2016), could have played a role in triggering the PETM, but we find clear evidence that the carbon cycle had already been getting progressively more unstable and thus more vulnerable to being pushed beyond a tipping point and remained so in its aftermath.
The data used for the plots and analysis of the global Palaeocene and Eocene benthic isotope stack (Zachos et al., 2001, 2008) and the ODP Site 1262 benthic isotopes (Littler et al., 2014, with ages adjusted as per Westerhold et al., 2015) are available via their published sources.
The supplement related to this article is available online at: https://doi.org/10.5194/cp-14-1515-2018-supplement.
DIAM and TML designed the study; DIAM performed the analyses; DIAM and TML wrote the paper.
The authors declare that they have no conflict of interest.
This work was supported by an EPSRC/ReCoVER Early Career Research Project
Award (number: RFFECR 002) and an NERC
Studentship to DIAM (number: NE/J500112/1) hosted at Ocean and Earth Science at the University of Southampton, with revised analyses performed at Stockholm Resilience Centre. TML was supported by a Royal
Society Wolfson Research Merit Award and the NERC “JET” large grant (NE/N018508/1). We are grateful to Kate Littler for
the data used in this study and for discussing our results and to Toby
Tyrrell, Paul A. Wilson, and James G. Dyke for feedback on preliminary
results, drafts, and interpretations.
The article processing charges for this open-access
publication were covered by Stockholm University.
Edited by: Yannick Donnadieu
Reviewed by: Valerie N. Livina and Pierre Maffre
Archer, D., Buffett, B., and Brovkin, V.: Ocean methane hydrates as a slow tipping point in the global carbon cycle, P. Natl. Acad. Sci. USA, 106, 20596–20601, https://doi.org/10.1073/pnas.0800885105, 2009.
Armstrong McKay, D. I., Tyrrell, T., Wilson, P. A., and Foster, G. L.: Estimating the impact of the cryptic degassing of Large Igneous Provinces: A mid-Miocene case-study, Earth Planet. Sc. Lett., 403, 254–262, https://doi.org/10.1016/j.epsl.2014.06.040, 2014.
Batjes, N. H.: Total carbon and nitrogen in the soils of the world, Eur. J. Soil Sci., 47, 151–163, https://doi.org/10.1111/j.1365-2389.1996.tb01386.x, 1996.
Berner, R. A.: A model for atmospheric CO2 over Phanerozoic time, Am. J. Sci., 291, 339–376, https://doi.org/10.2475/ajs.291.4.339, 1991.
Berner, R. A., Lasaga, A. C., and Garrels, R. M.: The carbonate-silicate geochemical cycle and its effect on atmospheric carbon dioxide over the past 100 million years, Am. J. Sci., 283, 641–683, 1983.
Boettiger, C. and Hastings, A.: Early warning signals and the prosecutor's fallacy, Proc. Biol. Sci., 279, 4734–4739, https://doi.org/10.1098/rspb.2012.2085, 2012a.
Boettiger, C. and Hastings, A.: Quantifying limits to detection of early warning for critical transitions, J. R. Soc. Interface, 9, 2527–2539, https://doi.org/10.1098/rsif.2012.0125, 2012b.
Boettiger, C., Ross, N., and Hastings, A.: Early warning signals: The charted and uncharted territories, Theor. Ecol., 6, 255–264, https://doi.org/10.1007/s12080-013-0192-6, 2013.
Boscolo-Galazzo, F., Crichton, K. A., Barker, S., and Pearson, P. N.: Temperature dependency of metabolic rates in the upper ocean: A positive feedback to global climate change?, Glob. Planet. Change, 170, 201–212, https://doi.org/10.1016/j.gloplacha.2018.08.017, 2018.
Buffett, B. and Archer, D.: Global inventory of methane clathrate: sensitivity to changes in the deep ocean, Earth Planet. Sc. Lett., 227, 185–199, https://doi.org/10.1016/j.epsl.2004.09.005, 2004.
Carpenter, S. R. and Brock, W. A.: Rising variance: a leading indicator of ecological transition, Ecol. Lett., 9, 311–318, https://doi.org/10.1111/j.1461-0248.2005.00877.x, 2006.
Carpenter, S. R. and Brock, W. A.: Early warnings of unknown nonlinear shifts: A nonparametric approach, Ecology, 92, 2196–2201, https://doi.org/10.1890/11-0716.1, 2011.
Caves, J. K., Jost, A. B., Lau, K. V., and Maher, K.: Cenozoic carbon cycle imbalances and a variable weathering feedback, Earth Planet. Sc. Lett., 450, 152–163, https://doi.org/10.1016/j.epsl.2016.06.035, 2016.
Chamberlin, T. C.: The Influence of Great Epochs of Limestone Formation upon the Constitution of the Atmosphere, J. Geol., 6, 609–621, 1898.
Cox, J. C. and Ross, S. A.: The valuation of options for alternative stochastic processes, J. Financ. Econ., 3, 145–166, https://doi.org/10.1016/0304-405X(76)90023-4, 1976.
Cui, Y., Kump, L. R., Ridgwell, A. J., Charles, A. J., Junium, C. K., Diefendorf, A. F., Freeman, K. H., Urban, N. M., and Harding, I. C.: Slow release of fossil carbon during the Palaeocene–Eocene Thermal Maximum, Nat. Geosci., 4, 481–485, https://doi.org/10.1038/ngeo1179, 2011.
Dakos, V., Scheffer, M., van Nes, E. H., Brovkin, V., Petoukhov, V., and Held, H.: Slowing down as an early warning signal for abrupt climate change, P. Natl. Acad. Sci. USA, 105, 14308–14312, https://doi.org/10.1073/pnas.0802430105, 2008.
Dakos, V., Carpenter, S. R., Brock, W. A., Ellison, A. M., Guttal, V., Ives, A. R., Kéfi, S., Livina, V., Seekell, D. A., van Nes, E. H., and Scheffer, M.: Methods for detecting early warnings of critical transitions in time series illustrated using simulated ecological data, PLoS One, 7, e41010, https://doi.org/10.1371/journal.pone.0041010, 2012a.
Dakos, V., van Nes, E. H., D'Odorico, P., and Scheffer, M.: Robustness of variance and autocorrelation as indicators of critical slowing down, Ecology, 93, 264–271, https://doi.org/10.1890/11-0889.1, 2012b.
Dakos, V., Nes, E. H., and Scheffer, M.: Flickering as an early warning signal, Theor. Ecol., 6, 309–317, https://doi.org/10.1007/s12080-013-0186-4, 2013.
Dakos, V., Carpenter, S. R., van Nes, E. H., and Scheffer, M.: Resilience indicators: prospects and limitations for early warnings of regime shifts, Philos. T. R. Soc. Lon. B, 370, 20130263, https://doi.org/10.1098/rstb.2013.0263, 2015.
DeConto, R. M. and Pollard, D.: Rapid Cenozoic glaciation of Antarctica induced by declining atmospheric CO2, Nature, 421, 245–249, https://doi.org/10.1038/nature01290, 2003.
DeConto, R. M., Pollard, D., Wilson, P. A., Pälike, H., Lear, C. H., and Pagani, M.: Thresholds for Cenozoic bipolar glaciation, Nature, 455, 652–656, https://doi.org/10.1038/nature07337, 2008.
DeConto, R. M., Galeotti, S., Pagani, M., Tracy, D., Schaefer, K., Zhang, T., Pollard, D., and Beerling, D. J.: Past extreme warming events linked to massive carbon release from thawing permafrost, Nature, 484, 87–91, https://doi.org/10.1038/nature10929, 2012.
Derry, L. A. and France-Lanord, C.: Neogene growth of the sedimentary organic carbon reservoir, Paleoceanography, 11, 267–275, https://doi.org/10.1029/95PA03839, 1996.
Dickens, G. R.: Down the Rabbit Hole: toward appropriate discussion of methane release from gas hydrate systems during the Paleocene-Eocene thermal maximum and other past hyperthermal events, Clim. Past, 7, 831–846, https://doi.org/10.5194/cp-7-831-2011, 2011.
Dickens, G. R., Neil, J. R. O., Rea, D. K., and Owen, R. M.: Dissociation of oceanic methane hydrate as a cause of the carbon isotope excursion at the end of the Paleocene, Paleoceanography, 10, 965–971, 1995.
Ditlevsen, P. D. and Johnsen, S. J.: Tipping points: Early warning and wishful thinking, Geophys. Res. Lett., 37, 1–4, https://doi.org/10.1029/2010GL044486, 2010.
Dunkley Jones, T., Lunt, D. J., Schmidt, D. N., Ridgwell, A., Sluijs, A., Valdes, P. J., and Maslin, M.: Climate model and proxy data constraints on ocean warming across the Paleocene-Eocene Thermal Maximum, Earth-Sci. Rev., 125, 123–145, https://doi.org/10.1016/j.earscirev.2013.07.004, 2013.
France-Lanord, C. and Derry, L. A.: Organic carbon burial forcing of the carbon cycle from Himalayan erosion, Nature, 390, 65–67, 1997.
Frieling, J., Svensen, H. H., Planke, S., Cramwinckel, M. J., Selnes, H., and Sluijs, A.: Thermogenic methane release as a cause for the long duration of the PETM, P. Natl. Acad. Sci. USA, 113, 12059–12064, https://doi.org/10.1073/pnas.1603348113, 2016.
Frieling, J., Gebhardt, H., Huber, M., Adekeye, O. A., Akande, S. O., Reichart, G.-J., Middelburg, J. J., Schouten, S., and Sluijs, A.: Extreme warmth and heat-stressed plankton in the tropics during the Paleocene-Eocene Thermal Maximum, Sci. Adv., 3, e1600891, https://doi.org/10.1126/sciadv.1600891, 2017.
Grimm, V. and Wissel, C.: Babel, or the ecological stability discussions: an inventory and analysis of terminology and a guide for avoiding confusion, Oecologia, 109, 323–334, https://doi.org/10.1007/s004420050090, 1997.
Gutjahr, M., Ridgwell, A., Sexton, P. F., Anagnostou, E., Pearson, P. N., Pälike, H., Norris, R. D., Thomas, E., and Foster, G. L.: Very large release of mostly volcanic carbon during the Palaeocene–Eocene Thermal Maximum, Nature, 548, 573–577, https://doi.org/10.1038/nature23646, 2017.
Hay, W. W.: Potential Errors in Estimates of Carbonate Rock Accumulating Through Geologic Time, in: The Carbon Cycle and Atmospheric CO2: Natural Variations Archean to Present, vol. 32, edited by: Sundquist, E. T. and Broecker, W. S., American Geophysical Union, Washington, DC, 573–583, 1985.
Held, H. and Kleinen, T.: Detection of climate system bifurcations by degenerate fingerprinting, Geophys. Res. Lett., 31, 1–4, https://doi.org/10.1029/2004GL020972, 2004.
Hofmann, M. and Rahmstorf, S.: On the stability of the Atlantic meridional overturning circulation, P. Natl. Acad. Sci. USA, 106, 20584–20589, https://doi.org/10.1073/pnas.0909146106, 2009.
Holling, C. S.: Resilience and Stability of Ecological Systems, Annu. Rev. Ecol. Syst., 4, 1–23, 1973.
Johannes, M.: The Statistical and Economic Role of Jumps in Continuous-Time Interest Rate Models, J. Finance, 59, 227–260, https://doi.org/10.1111/j.1540-6321.2004.00632.x, 2004.
John, E. H., Wilson, J. D., Pearson, P. N., and Ridgwell, A.: Temperature-dependent remineralization and carbon cycling in the warm Eocene oceans, Palaeogeogr. Palaeocl., 413, 158–166, https://doi.org/10.1016/j.palaeo.2014.05.019, 2014.
Kéfi, S., Dakos, V., Scheffer, M., Van Nes, E. H., and Rietkerk, M.: Early warning signals also precede non-catastrophic transitions, Oikos, 122, 641–648, https://doi.org/10.1111/j.1600-0706.2012.20838.x, 2013.
Kirtland Turner, S., Sexton, P. F., Charles, C. D., and Norris, R. D.: Persistence of carbon release events through the peak of early Eocene global warmth, Nat. Geosci., 7, 748–751, https://doi.org/10.1038/ngeo2240, 2014.
Kirtland Turner, S., Hull, P. M., Kump, L. R., and Ridgwell, A.: A probabilistic assessment of the rapidity of PETM onset, Nat. Commun., 8, 353, 1–10, https://doi.org/10.1038/s41467-017-00292-2, 2017.
Klinger, L. F., Taylor, J. A., and Franzen, L. G.: The Potential Role of Peatland Dynamics in Ice-Age Initiation, Quaternary Res., 45, 89–92, https://doi.org/10.1006/qres.1996.0008, 1996.
Komar, N., Zeebe, R. E., and Dickens, G. R.: Understanding long-term carbon cycle trends: The late Paleocene through the early Eocene, Paleoceanography, 28, 650–662, https://doi.org/10.1002/palo.20060, 2013.
Kump, L. R. and Arthur, M. A.: Global Chemical Erosion during the Cenozoic: Weatherability Balances the Budgets, in: Tectonic uplift and climate change, edited by: Ruddiman, W. F., Springer US, Boston, MA, 399–426, 1997.
Kurtz, A. C., Kump, L. R., Arthur, M. A., Zachos, J. C., and Paytan, A.: Early Cenozoic decoupling of the global carbon and sulfur cycles, Paleoceanography, 18, 1090, https://doi.org/10.1029/2003PA000908, 2003.
Lenton, T. M.: Early warning of climate tipping points, Nat. Clim. Change, 1, 201–209, https://doi.org/10.1038/nclimate1143, 2011.
Lenton, T. M.: Environmental Tipping Points, Annu. Rev. Environ. Res., 38, 1–29, https://doi.org/10.1146/annurev-environ-102511-084654, 2013.
Lenton, T. M., Held, H., Kriegler, E., Hall, J. W., Lucht, W., Rahmstorf, S., and Schellnhuber, H. J.: Tipping elements in the Earth's climate system, P. Natl. Acad. Sci. USA, 105, 1786–1793, https://doi.org/10.1073/pnas.0705414105, 2008.
Lenton, T. M., Livina, V. N., Dakos, V., and Scheffer, M.: Climate bifurcation during the last deglaciation?, Clim. Past, 8, 1127–1139, https://doi.org/10.5194/cp-8-1127-2012, 2012a.
Lenton, T. M., Livina, V. N., Dakos, V., van Nes, E. H., and Scheffer, M.: Early warning of climate tipping points from critical slowing down: comparing methods to improve robustness, Philos. Trans. A. Math. Phys. Eng. Sci., 370, 1185–204, https://doi.org/10.1098/rsta.2011.0304, 2012b.
Littler, K., Röhl, U., Westerhold, T., and Zachos, J. C.: A high-resolution benthic stable-isotope record for the South Atlantic: Implications for orbital-scale changes in Late Paleocene–Early Eocene climate and carbon cycling, Earth Planet. Sc. Lett., 401, 18–30, https://doi.org/10.1016/j.epsl.2014.05.054, 2014.
Livina, V. N. and Lenton, T. M.: A modified method for detecting incipient bifurcations in a dynamical system, Geophys. Res. Lett., 34, 1–5, https://doi.org/10.1029/2006GL028672, 2007.
Livina, V. N., Ditlevsen, P. D., and Lenton, T. M.: An independent test of methods of detecting system states and bifurcations in time-series data, Phys. A Stat. Mech. Appl., 391, 485–496, https://doi.org/10.1016/j.physa.2011.08.025, 2012.
Lourens, L. J., Sluijs, A., Kroon, D., Zachos, J. C., Thomas, E., Röhl, U., Bowles, J., and Raffi, I.: Astronomical pacing of late Palaeocene to early Eocene global warming events, Nature, 435, 1083–1087, https://doi.org/10.1038/nature03814, 2005.
Lunt, D. J., Ridgwell, A., Sluijs, A., Zachos, J., Hunter, S., and Haywood, A.: A model for orbital pacing of methane hydrate destabilization during the Palaeogene, Nat. Geosci., 4, 775–778, https://doi.org/10.1038/ngeo1266, 2011.
McInerney, F. A. and Wing, S. L.: The Paleocene-Eocene Thermal Maximum: A Perturbation of Carbon Cycle, Climate, and Biosphere with Implications for the Future, Annu. Rev. Earth Pl. Sc., 39, 489–516, https://doi.org/10.1146/annurev-earth-040610-133431, 2011.
Minshull, T. A., Marín-Moreno, H., Armstrong McKay, D. I., and Wilson, P. A.: Mechanistic insights into a hydrate contribution to the Paleocene-Eocene carbon cycle perturbation from coupled thermohydraulic simulations, Geophys. Res. Lett., 43, 8637–8644, https://doi.org/10.1002/2016GL069676, 2016.
Pagani, M., Huber, M., Liu, Z., Bohaty, S. M., Henderiks, J., Sijp, W., Krishnan, S., and DeConto, R. M.: The role of carbon dioxide during the onset of Antarctic glaciation, Science, 334, 1261–1264, https://doi.org/10.1126/science.1203909, 2011.
Peng, C. K., Buldyrev, S. V., Havlin, S., Simons, M., Stanley, H. E., and Goldberger, A. L.: Mosaic organization of DNA nucleotides, Phys. Rev. E, 49, 1685–1689, https://doi.org/10.1103/PhysRevE.49.1685, 1994.
Pollard, D. and DeConto, R. M.: Modelling West Antarctic ice sheet growth and collapse through the past five million years, Nature, 458, 329–332, https://doi.org/10.1038/nature07809, 2009.
R Foundation for Statistical Computing: R: A language and environment for statistical computing, available at: https://www.r-project.org/ (last access: 15 October 2018), 2016.
Rahmstorf, S.: Ocean circulation and climate during the past 120,000 years, Nature, 419, 207–214, https://doi.org/10.1038/nature01090, 2002.
Schaller, M. F., Fung, M. K., Wright, J. D., Katz, M. E., and Kent, D. V: Impact ejecta at the Paleocene-Eocene boundary, Science, 354, 225–229, https://doi.org/10.1126/science.aaf5466, 2016.
Scheffer, M., Carpenter, S., Foley, J. A., Folke, C., and Walker, B.: Catastrophic shifts in ecosystems, Nature, 413, 591–596, https://doi.org/10.1038/35098000, 2001.
Scheffer, M., Bascompte, J., Brock, W. A., Brovkin, V., Carpenter, S. R., Dakos, V., Held, H., van Nes, E. H., Rietkerk, M., and Sugihara, G.: Early-warning signals for critical transitions, Nature, 461, 53–9, https://doi.org/10.1038/nature08227, 2009.
Secord, R., Gingerich, P. D., Lohmann, K. C., and MacLeod, K. G.: Continental warming preceding the Palaeocene-Eocene thermal maximum, Nature, 467, 955–958, https://doi.org/10.1038/nature09441, 2010.
Sluijs, A., Brinkhuis, H., Schouten, S., Bohaty, S. M., John, C. M., Zachos, J. C., Reichart, G. J., Sinninghe Damsté, J. S., Crouch, E. M., and Dickens, G. R.: Environmental precursors to rapid light carbon injection at the Palaeocene/Eocene boundary, Nature, 450, 1218–1221, https://doi.org/10.1038/nature06400, 2007a.
Sluijs, A., Bowen, G. J., Brinkhuis, H., Lourens, L. J., and Thomas, E.: The Palaeocene-Eocene Thermal Maximum super greenhouse: Biotic and geochemical signatures, age models and mechanisms of global change, Geol. Soc. Spec. Publ., 1, 323–349, 2007b.
Stap, L., Lourens, L. J., Thomas, E., Sluijs, A., Bohaty, S., and Zachos, J. C.: High-resolution deep-sea carbon and oxygen isotope records of Eocene Thermal Maximum 2 and H2, Geology, 38, 607–610, https://doi.org/10.1130/G30777.1, 2010.
Stocker, T. F. and Wright, D. G.: Rapid transitions of the ocean's deep circulation induced by changes in surface water fluxes, Nature, 351, 729–732, https://doi.org/10.1038/351729a0, 1991.
Stommel, H.: Thermohaline Convection with Two Stable Regimes, Tellus, 13, 224–230, 1961.
Storey, M., Duncan, R. A., and Tegner, C.: Timing and duration of volcanism in the North Atlantic Igneous Province: Implications for geodynamics and links to the Iceland hotspot, Chem. Geol., 241, 264–281, https://doi.org/10.1016/j.chemgeo.2007.01.016, 2007.
Svensen, H., Planke, S., Malthe-Sørenssen, A., Jamtveit, B., Myklebust, R., Rasmussen Eidem, T., and Rey, S. S.: Release of methane from a volcanic basin as a mechanism for initial Eocene global warming, Nature, 429, 542–545, https://doi.org/10.1038/nature02566, 2004.
Tarnocai, C., Canadell, J. G., Schuur, E. A. G., Kuhry, P., Mazhitova, G., and Zimov, S.: Soil organic carbon pools in the northern circumpolar permafrost region, Global Biogeochem. Cy., 23, 1–11, https://doi.org/10.1029/2008GB003327, 2009.
The MathWorks Inc.: Matlab Release 2016a, available at: https://mathworks.com/products/matlab.html (last access: 15 October 2018), 2016.
Urey, H. C.: The planets, their origin and development, Yale University Press, New Haven, Connecticut, 265 pp., 1952.
van der Ploeg, R., Selby, D., Cramwinckel, M. J., Li, Y., Bohaty, S. M., Middelburg, J. J., and Sluijs, A.: Middle Eocene greenhouse warming facilitated by diminished weathering feedback, Nat. Commun., 9, 2877, https://doi.org/10.1038/s41467-018-05104-9, 2018.
van Nes, E. H., Arani, B. M. S., Staal, A., van der Bolt, B., Flores, B. M., Bathiany, S., and Scheffer, M.: What Do You Mean, “Tipping Point”?, Trends Ecol. Evol., 31, 902–904, https://doi.org/10.1016/j.tree.2016.09.011, 2016.
Walker, J. C. G. and Kasting, J. F.: Effects of fuel and forest conservation on future levels of atmospheric carbon dioxide, Palaeogeogr. Palaeocl., 97, 151–89, 1992.
Walker, J. C. G., Hays, P. B., and Kasting, J. F.: A negative feedback mechanism for the long-term stabilization of Earth's surface temperature, J. Geophys. Res., 86, 9776–9782, 1981.
Wang, R., Dearing, J. A., Langdon, P. G., Zhang, E., Yang, X., Dakos, V., and Scheffer, M.: Flickering gives early warning signals of a critical transition to a eutrophic lake state, Nature, 492, 419–422, https://doi.org/10.1038/nature11655, 2012.
Westerhold, T. and Röhl, U.: High resolution cyclostratigraphy of the early Eocene – new insights into the origin of the Cenozoic cooling trend, Clim. Past, 5, 309–327, https://doi.org/10.5194/cp-5-309-2009, 2009.
Westerhold, T., Röhl, U., Laskar, J., Raffi, I., Bowles, J., Lourens, L. J., and Zachos, J. C.: On the duration of magnetochrons C24r and C25n and the timing of early Eocene global warming events: Implications from the Ocean Drilling Program Leg 208 Walvis Ridge depth transect, Paleoceanography, 22, 1–19, https://doi.org/10.1029/2006PA001322, 2007.
Westerhold, T., Röhl, U., Frederichs, T., Bohaty, S. M., and Zachos, J. C.: Astronomical calibration of the geological timescale: Closing the middle Eocene gap, Clim. Past, 11, 1181–1195, https://doi.org/10.5194/cp-11-1181-2015, 2015.
Westerhold, T., Röhl, U., Wilkens, R. H., Gingerich, P. D., Clyde, W. C., Wing, S. L., Bowen, G. J., and Kraus, M. J.: Synchronizing early Eocene deep-sea and continental records – cyclostratigraphic age models for the Bighorn Basin Coring Project drill cores, Clim. Past, 14, 303–319, https://doi.org/10.5194/cp-14-303-2018, 2018.
Zachos, J. C., Pagani, M., Sloan, L., Thomas, E., and Billups, K.: Trends, rhythms, and aberrations in global climate 65 Ma to present, Science, 292, 686–693, https://doi.org/10.1126/science.1059412, 2001.
Zachos, J. C., Röhl, U., Schellenberg, S. A., Sluijs, A., Hodell, D. A., Kelly, D. C., Thomas, E., Nicolo, M., Raffi, I., Lourens, L. J., McCarren, H., and Kroon, D.: Rapid acidification of the ocean during the Paleocene-Eocene thermal maximum, Science, 308, 1611–1615, https://doi.org/10.1126/science.1109004, 2005.
Zachos, J. C., Dickens, G. R., and Zeebe, R. E.: An early Cenozoic perspective on greenhouse warming and carbon-cycle dynamics, Nature, 451, 279–283, https://doi.org/10.1038/nature06588, 2008.
Zeebe, R. E., Zachos, J. C., and Dickens, G. R.: Carbon dioxide forcing alone insufficient to explain Palaeocene–Eocene Thermal Maximum warming, Nat. Geosci., 2, 576–580, https://doi.org/10.1038/ngeo578, 2009.
Zeebe, R. E., Ridgwell, A., and Zachos, J. C.: Anthropogenic carbon release rate unprecedented during the past 66 million years, Nat. Geosci., 9, 325–329, https://doi.org/10.1038/ngeo2681, 2016.