the Creative Commons Attribution 4.0 License.
the Creative Commons Attribution 4.0 License.
 | 21 Jun 2018
The influence of carbonate platform interactions with subduction zone volcanism on palaeo-atmospheric CO2 since the Devonian
Jodie Pall
Sabin Zahirovic
Sebastiano Doss
Rakib Hassan
Kara J. Matthews
John Cannon
Michael Gurnis
Louis Moresi
Adrian Lenardic
R. Dietmar Müller
The CO2 liberated along subduction zones through intrusive/extrusive magmatic activity and the resulting active and diffuse outgassing influences global atmospheric CO2. However, when melts derived from subduction zones intersect buried carbonate platforms, decarbonation reactions may cause the contribution to atmospheric CO2 to be far greater than segments of the active margin that lacks buried carbon-rich rocks and carbonate platforms. This study investigates the contribution of carbonate-intersecting subduction zones (CISZs) to palaeo-atmospheric CO2 levels over the past 410 million years by integrating a plate motion and plate boundary evolution model with carbonate platform development through time. Our model of carbonate platform development has the potential to capture a broader range of degassing mechanisms than approaches that only account for continental arcs.
Continuous and cross-wavelet analyses as well as wavelet coherence are used to evaluate trends between the evolving lengths of carbonate-intersecting subduction zones, non-carbonate-intersecting subduction zones and global subduction zones, and are examined for periodic, linked behaviour with the proxy CO2 record between 410 Ma and the present. Wavelet analysis reveals significant linked periodic behaviour between 60 and 40 Ma, when CISZ lengths are relatively high and are correlated with peaks in palaeo-atmospheric CO2, characterised by a 32–48 Myr periodicity and a ∼ 8–12 Myr lag of CO2 peaks following CISZ length peaks. The linked behaviour suggests that the relative abundance of CISZs played a role in affecting global climate during the Palaeogene. In the 200–100 Ma period, peaks in CISZ lengths align with peaks in palaeo-atmospheric CO2, but CISZ lengths alone cannot be determined as the cause of a warmer Cretaceous–Jurassic climate. Nevertheless, across the majority of the Phanerozoic, feedback mechanisms between the geosphere, atmosphere and biosphere likely played dominant roles in modulating climate. Our modelled subduction zone lengths and carbonate-intersecting subduction zone lengths approximate magmatic activity through time, and can be used as input into fully coupled models of CO2 flux between deep and shallow carbon reservoirs.
- Article
(4484 KB) -
Supplement
(376 KB) - BibTeX
- EndNote


The current paradigm of the deep carbon cycle (i.e. the planetary cycling of carbon over million-year timescales) attributes fluctuations in the atmospheric carbon dioxide (CO2) to the realm of tectonic forces, where subduction-related emissions (van der Meer et al., 2014; Kerrick, 2001) and metamorphic decarbonation (Lee et al., 2013) are major CO2 sources, and the processes of silicate weathering (Sundquist, 1991; Kent and Muttoni, 2008), seafloor weathering (Brady and Gíslason, 1997; Krissansen-Totton and Catling, 2017) and marine organic carbon burial (Berner and Caldeira, 1997; Ridgwell and Zeebe, 2005) are major sinks removing CO2 from the atmosphere. Subduction plays a critical role in this cycle. In a dynamic interplay, oceanic lithosphere is consumed at subduction zones, removing carbon bound in pelagic carbonate seafloor sediments from the exogenic carbon cycle. Simultaneously, CO2 is emitted through diffuse outgassing and arc volcanism along subduction zones (Keleman and Manning, 2015). Recent studies have found support for links between periods of increased global arc activity and warmer global climates using detrital zircon ages, modelling and experimental techniques, particularly as drivers of greenhouse conditions in the Cambrian (McKenzie et al., 2016; Cao et al., 2017), Jurassic–Cretaceous (McKenzie et al., 2016) and early Palaeogene (Lee et al., 2013; Carter and Dasgupta, 2015; Cao et al., 2017). Moreover, it has been postulated that the relationship between arc activity and climate is periodic, relating to ∼ 50 Myr global flare-ups along extended segments of arcs (Lee and Lackey, 2015) as well as continent assembly and dispersal which cause transitions from intraoceanic-arc- to continental-arc-dominated states (Lenardic et al., 2011; Lee et al., 2013). However, it is difficult to test this hypothesis, especially due to poor preservation of ancient intra-oceanic arc rocks (Berner, 2004).
Recently, carbon and helium isotope analysis from modern volcanic arc gas has provided evidence that volcanic arcs that assimilate crustal carbonate in their magmas through decarbonation reactions have a greater atmospheric CO2 contribution than other types of arcs (Mason et al., 2017). Modern crustal carbonate reservoirs are a result of global organic and inorganic carbonate production throughout the Phanerozoic, which has contributed to the build-up of expansive, shallow-water carbonate sequences including ramps and rimmed shelves along continental margins, hereafter referred to as “carbonate platforms” (Kiessling et al., 2003). At different points in Earth's history, active (from extrusive volcanism) and passive (from intrusive magmatism) emissions from arcs along carbonate-intersecting subduction zones (CISZs) may have dominated global carbon flux from all subduction zones, such as during the Cretaceous (144–65 Ma) when continental arcs are hypothesised to have been longer than modern-day lengths and when a greenhouse climate prevailed (Lee et al., 2013; van der Meer et al., 2014; Cao et al., 2017). We investigate this hypothesis using wavelet analysis, which attempts to detect correlations and periodicities in two time series, namely climate proxy data and subduction zone lengths, at any scale or duration (Grinsted et al., 2004).
Specifically, we apply cross-wavelet analysis and wavelet coherence to investigate whether the CO2 flux from carbonate-intersecting subduction zones has been significantly different than the flux from the remainder of subduction zones that do not intersect with buried carbonate reservoirs (non-CISZ) in influencing global palaeo-atmospheric CO2 concentrations since the Devonian (410 Ma). We define CISZ CO2 flux as the sum of active volcanism and passive outgassing along arcs that develop at subduction zones which intersect buried carbonate platforms in the overriding lithosphere. Non-CISZ CO2 flux includes all volcanic CO2 emissions from all subduction zones that exist where subduction zones are not intersecting carbonate platforms (Fig. 1a).
A study by Cao et al. (2017) also endeavoured to apply regional geology in combination with palaeogeographic maps to explore the distribution of continental arcs through space and time in a plate tectonic framework. However, Cao et al. (2017) show conservative estimates of continental arc lengths, and may underestimate the lengths and duration of some arcs. The approach we propose measures subduction zone lengths as opposed to arc lengths, and therefore may capture some carbonate-intersecting arcs that the Cao et al. (2017) model may miss.
Furthermore, wavelet analysis is used to deconvolve two time series at a time (e.g. our CISZ and non-CISZ lengths with the palaeo-atmospheric CO2 record by Foster et al., 2017) to uncover any periodicities or correlations. Compared to other techniques that find time-dependent correlations between two signals such as the windowed Fourier transform, the wavelet transform is preferable because it is localised (bounded) in both time and frequency, whereas Fourier transforms are only localised in frequency (Torrence and Compo, 1998). Hence, the wavelet transform can better constrain correlations in time and is better suited than the Fourier transform to approximating data with sharp discontinuities, such as those addressed in this investigation.
This paper is accompanied by an open-source “subduction zone analysis toolkit” (Doss et al., 2016), including a model of spatio-temporal carbonate platform accumulation that extends from the Precambrian, to help enable the use of digital plate motion models (e.g. Matthews et al., 2016) and other tools to investigate aspects of the deep carbon cycle.
We investigate the combined effect of evolving global subduction zone lengths and the subsequent decarbonation of crustal carbonates by subduction zone melts to create a first-order approximation of the contribution of CO2 outgassed at CISZs to palaeo-CO2 levels over the past 410 Myr. An “accumulation model” of carbonate platform evolution since the Precambrian represents the long-term persistence and build-up of carbonate platforms in upper continental crust. The plate reconstructions used in this study have been developed through a synthesis of marine and continental geological and geophysical data, including seafloor spreading histories for the post-Pangaea time frame (Seton et al., 2012; Müller et al., 2016), and largely palaeomagnetic and continental geological constraints for pre-Pangaea time frame (Domeier and Torsvik, 2014; Matthews et al., 2016). Subduction zones are implemented where the geological record indicates arc volcanism or intrusive magmatism, an active accretionary melange, active orogens associated with subduction zones, formation of supra-subduction zone ophiolites, and other indicators of an active margin. As our plate reconstructions are global, plate boundary evolution requires continuously evolving topological polygons to capture plate motions (Gurnis et al., 2012), meaning that subduction zones are implemented along entire convergent margins, rather than only where preserved arc volcanics are found. Our plate reconstructions that include continental motions and plate boundary evolution are available as open-access community resources (https://www.earthbyte.org/global-plate-models/, last access: 20 June 2018).
2.1 An “accumulation model” of carbonate platform development
Palaeogeographic maps of carbonate platforms spanning the Phanerozoic since the Ordovician in Kiessling et al. (2003) have been used to model carbonate platform accumulation through time. The 31 maps represent the spatial extent of carbonate platforms at the maximum marine transgression within each epoch for the Phanerozoic (Kiessling et al., 2003). Additionally, all instances of carbonate lithologies of Precambrian (4600–541 Ma) and Cambrian age (541–485 Ma) are extracted as point data from the Paleobiology Database (2017) (304 data points; https://paleobiodb.org/, last access: 15 May 2018), the PaleoReefs Database (19 data points; Kiessling and Flugel, 2002) and some well-studied carbonates in northern China (Meng et al., 2011). Considering that the spatial extent of the Precambrian carbonate platforms is poorly constrained, we applied a 200 km buffer to the point data from the databases. All carbonate platform geometries are georeferenced to WGS84 co-ordinates in ArcGIS (ESRI, 2011) to be compatible with GPlates, the open-source plate reconstruction software (Boyden et al., 2011). A GPlates file is created to depict carbonate platform accumulation from 410 Ma to the present day using platforms which have existed since the Precambrian, in order to better capture buried carbonate platforms at the beginning of the model time frame. Creating this model involves stitching together all carbonate platform shapefiles and allowing them to persist until present day. Ages were ascribed based on the Golonka and Kiessling (2002) Phanerozoic timescale. However, owing to new chronostratigraphic data, the geological times ascribed to the existence of carbonate platforms in our model for each epoch are converted to the corresponding times in the latest chronostratigraphic scheme given in the 2016 version of the International Stratigraphic Chart (Cohen et al., 2013). Subsequently, the static carbonate platform shapefiles are reconstructed with the rotations and plate geometries associated with an older plate motion model (Scotese, 2016), similar to the model used by Kiessling et al. (2003). In GPlates, the carbonate platform geometries are assigned plate IDs based upon their overlapping position within the reconstructed continental geometry. Carbonate platforms are rotated to their present-day positions, and plate IDs associated with the Scotese (2016) model were translated into corresponding plate IDs from the Matthews et al. (2016) plate motion model. By obtaining the present-day geometry of the ancient carbonate platforms, attaching these geometries to any other plate motion model becomes straightforward. The evolving carbonate platform model is created by layering each carbonate platform geometry such that it persists to present day. The accumulation model we implement in this study embodies the idea that carbonate platforms accumulate in crustal reservoirs through time.
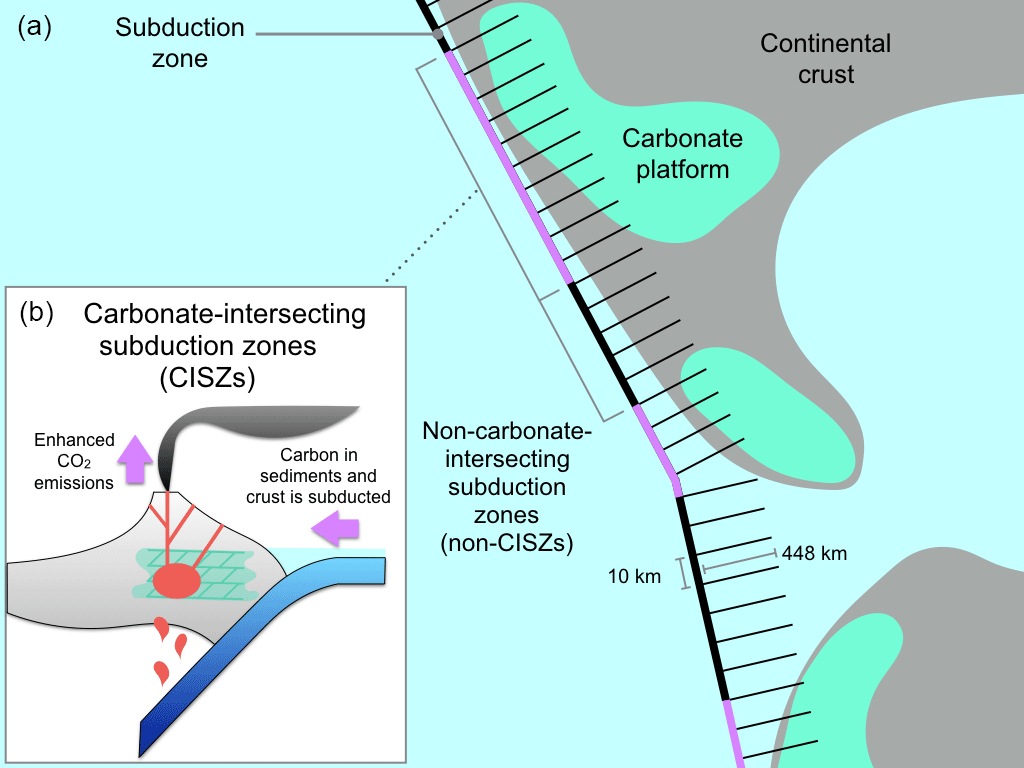
Figure 1(a) Schematic representation of the ∼ 450 km long cross-profile “whiskers” that are constructed along subduction zones (purple and black), spaced 10 km apart in the direction of subduction. The carbonate polygons (light blue) of the carbonate platform mask have a value of 1 (including those on the continental and oceanic crust), and elsewhere the grid values are zero. All whiskers that intersect, at some point along their length, with the carbonate platforms in the mask will contribute 10 km to the total count of carbonate-intersecting subduction zones. (b) Schematic representations of carbonate-intersecting continental subduction zones. Carbonate platforms become buried over time, forming reservoirs in the crust. Through assimilation and decarbonation reactions, arc magmas interact with upper-crustal carbonates and liberate significantly more CO2 emissions that at non-intersecting continental arcs.
2.2 Assumptions and limitations of the accumulation model
The accumulation model is an end-member scenario of how carbonate platforms evolve through time. Carbonate accumulation is assumed to accrete on primarily continental lithosphere and persist as mid-crustal carbonate reservoirs from the time of their formation to the present (Fig. 1). Ancient carbonate platforms are known to persist to the present day in surface reservoirs, and can be reconstructed from the geological record as they outcrop, are sampled by drilling or are interpreted from seismic reflection studies (Kiessling et al., 2003). Some crustal carbonate is inevitably eroded or subducted into the deep mantle, however it is improbable that most reservoirs have been destroyed in this way as most carbonate platforms accumulate on continental margins and are not likely to subduct (Lee and Lackey, 2015). Given limited erosion on passive continental margins, except in the cases of major uplift and deformation through mountain-building, it is far more likely that carbonate platform accretion has exceeded their depletion by erosion or consumption through time (Ridgwell and Zeebe, 2005). Moreover, the existence of fossil reef data as far back as the Precambrian (Grotzinger and James, 2000) favours the notion that extensive portions of platforms have been well preserved in continents.
Nevertheless, our model assumes that carbonate platforms have not been significantly depleted by sustained mantle-crust interaction through time. We follow this assumption because there is no way to account for their rate of depletion given the complexity of inter-dependent factors such as platform thickness, heat, pressure, composition and the duration of interaction (Johnston et al., 2011). Accounting for the thickness of platforms and the depletion of reservoirs over time are areas of necessary future developments in the model. We accept that our accumulation model is a simplification of the carbonate reservoir system and may lead to an overestimation of CISZ lengths. However, this may be a reasonable proxy for the substantial amount of CO2 emitted via diffuse outgassing that is largely unaccounted for in global estimates of carbon emitted at continental arcs (fore-arc, arc and back-arc settings; Keleman and Manning, 2015). Given little evidence of carbon storage in arc crust, these estimates provide important information on, if not an upper-bound estimate of, degassing from CISZs, which are hypothesised to be a significant source of atmospheric CO2 (Keleman and Manning, 2015). While some Precambrian carbonate platforms have been described (Grotzinger and James, 2000), no effort has yet been made to map their occurrence globally. It is beyond the scope of this work to map the global spatio-temporal patterns of Precambrian carbonate platforms, and thus only those point data captured by the PaleoReefs and Paleobiology databases were incorporated into our accumulation model. While it is expected that accounting for the entire extent of Precambrian platforms would not drastically change the analysis if Precambrian platforms largely lay over the extent of platforms already accounted for, the accumulation model nevertheless represents a degree of underestimation of the Earth's crustal carbonate reservoir.
2.3 Measuring global subduction zone lengths with pyGPlates
We use the open access global plate motion model from Matthews et al. (2016) to analyse the spatio-temporal distribution of subduction zone volcanic arcs in a deep-time tectonic framework and test the hypothesis that subduction zone arc lengths are correlated with atmospheric CO2 levels. The model spans much of the Phanerozoic as it links the 410–250 Ma Domeier and Torsvik (2014) and the 230–0 Ma Müller et al. (2016) plate motion models. Using open-source and cross-platform plate reconstruction software GPlates (http://gplates.org/download.html, last access: 20 June 2018) and a new pyGPlates Python application programming interface (API; https://www.gplates.org/docs/pygplates/, last access: 20 June 2018), we measure the length of subduction zones at 1 Myr intervals since 410 Ma and track the length of subduction zones that interact with carbonate platforms (CISZ), the length of all subduction zones that do not intersect carbonate platforms (non-CISZ), and total global subduction zone lengths. Using the pyGPlates workflow (Doss et al., 2016), global subduction zone boundaries were extracted from the Matthews et al. (2016) plate motion model, and subduction zone geometries were adjusted to remove any overlapping line segments that would overestimate subduction zone lengths through time (Doss et al., 2016).
2.4 Computing the intersections of carbonate platforms and subduction zones
We test whether subduction zones interacting with carbonate platforms are different from non-intersecting portions of subduction zones in their contribution to global atmospheric CO2 concentration, and hence we track the lengths of subduction zones that both do and do not intersect with carbonate platforms in the overriding lithosphere. Carbonate platform geometries are converted to polygons using grdmask from the development version of Generic Mapping Tools (GMT; v.5.2.1; Wessel et al., 2015), which create a Boolean-style mask consisting of closed domains with a value of 1 where carbonate platforms existed and 0 elsewhere. We identify polygons proximal to subduction boundaries through time using the exported subduction zone geometries from the pyGPlates workflow. We compute the signed-distance function, positive toward the overriding plate, on the surface of the sphere for all subduction zones and computed where the carbonate platforms lie within +448 km of the trench. The grdtrack tool in GMT is used to create large tracks of 448 km long cross-profiles perpendicular to subduction boundaries at a uniform spacing of 10 km, with “whiskers” pointing in the direction of subduction (Fig. 1a). The whiskers have five evenly spaced nodes to detect intersections with carbonate platform polygons anywhere along the cross-profiles. The whiskers function as a buffer, allowing us to identify the lengths of subduction zone boundaries within ∼ 450 km perpendicular radius of a carbonate platform polygon. Cross-profiles that overlap with carbonate platform polygons demarcate areas where continental subduction zones interact with crustal carbonates (Fig. 1b).
We statistically determine the 448 km long inclusion distance by calculating average arc-trench distances using the present-day “Volcanoes of the World” database maintained by the Smithsonian Institution's Global Volcanism Program (2003). From a sample size of 1023 volcanoes, average arc-trench distances are 287 km with a standard deviation of 161 km, such that one standard deviation greater than the mean arc-trench distance gives 448 km. This captures 84 % of the location of all present volcanic arcs. While flat slab subduction may cause arc-trench distances in excess of 500 km (Espurt et al., 2008), a 448 km long whisker length is likely to capture the majority of carbonate intersections through time.
Relationships between oscillations in two time series can be examined using a wavelet analysis to elucidate the scales and time intervals where the proxy record and modelled data display correlated, periodic signals. We performed wavelet analysis as a means of identifying localised variations of power between proxy records of CO2 and modelled CISZ lengths and in turn investigate the temporal evolution of these aperiodic signals. We are able to carry out this analysis as the geophysical data exhibit non-stationarity; dominant periodic signals vary in their frequency and amplitude through time. The continuous wavelet transform (CWT) is particularly useful for this task as it better characterises oscillatory behaviours of signals than discrete wavelet transforms. The CWT was applied to decompose arc lengths and proxy signals into time and frequency space simultaneously using functions (wavelets) that vary in width to discern both the high- and low-frequency features present (Lau and Weng, 1995; Supplement Sect. S3). To examine whether trends in atmospheric CO2 and CISZ arcs are connected in some way, the cross-wavelet transform (XWT) was carried out between the proxy CO2 data (Fig. S1 in the Supplement) and each of the modelled data on carbonate-intersecting arc lengths (Supplement Sect. S4). The XWT reveals space-time regions where the two datasets coincidentally have high common power as well as calculating the phase relationships between signals, indicating where two series co-vary (Grinsted et al., 2004). Wavelet transform coherence (WTC) is computed in tandem with the XWT and determines if the time series are significantly interrelated in the frequency domain. All wavelet analysis was carried out for each detrended and filtered time series based on the statistical approach applied to geological and geophysical data by Torrence and Compo (1998) and Grinsted et al. (2004).
Data filtering
The modelled results and proxy CO2 time series were pre-processed for wavelet analysis by detrending and applying a low-pass filter. A moving average filter was applied with a window size of 5 Myr to remove high-frequency signals that may represent noise or other short-term perturbations (Fig. S2). In the time-frequency domain, our focus is on the power in the low-to-mid-frequency spectrum and so the moving average filter was designed to remove periods less than 5 Myr. As a result, the analysis does not capture any geologically rapid (few Myr) changes in CO2 that may be driven by changes in plate tectonics and carbonate platform-arc interactions.
Rather than comparing estimates from the Accumulation Model with Phanerozoic atmospheric CO2 models like COPSE (Bergman et al., 2004) or GEOCARBSULF (Berner, 2006), results were compared to the proxy CO2 record compiled by Foster et al. (2017) because the unresolved uncertainties in model calculations may have rendered comparisons less meaningful than when comparing with proxy records. The multi-proxy CO2 dataset presented by Foster et al. (2017) is the most up-to-date compilation of CO2 data at the highest temporal resolution available (0.5 Myr sampling interval), representing their highest probability estimate of CO2 at each interval and is the proxy CO2 signal used in this study.
4.1 Continuous wavelet transform (CWT)
The wavelet power spectrum in the CWT shows the spatio-temporal distribution of amplitudes of correlation between the time series and a Morlet wavelet of a specific scale. Areas outside the cone of influence (COI) are not localised in time and are thus unreliable for constraining the duration of periodicity. For this reason, results within the 5 % significance level outside the COI (in white translucent regions of the wavelet power spectra) are ignored.
There is significant wavelet power in the 24–48 Myr waveband (period length) for CISZ lengths, which is intermittent in time yet dominates for time intervals (365–295 Ma, 250–115 Ma, 90–35 Ma; Fig. 2a). Significant wavelet power also exists in the 48–64 Myr waveband of 175–100 Ma and in the 72–128 Myr waveband of 220–120 Ma. In contrast, periodic signals of length ∼ 24–32 and 48–64 Myr have the highest wavelet power and are significant in the non-CISZ time series from ∼ 360–150 Ma (Fig. 2b), and are notably absent from the CISZ time series. Total global subduction zone lengths have two clear and persistent signals through time, primarily in the 24–32 and 48–64 Myr wavebands (Fig. 2c). Significant, high wavelet power in the 16–32 Myr waveband exists in the proxy CO2 time series of 280–150 Ma and of 125–50 Ma (Fig. 2d). The ∼ 96 Myr waveband has the highest wavelet power at the 5 % significance level in the proxy CO2 time series of 300–120 Ma (Fig. 2d). There is overlap in periodic behaviour between the CISZ, non-CISZ, global subduction zone and CO2 proxy data in the 16–32 Myr wavebands.
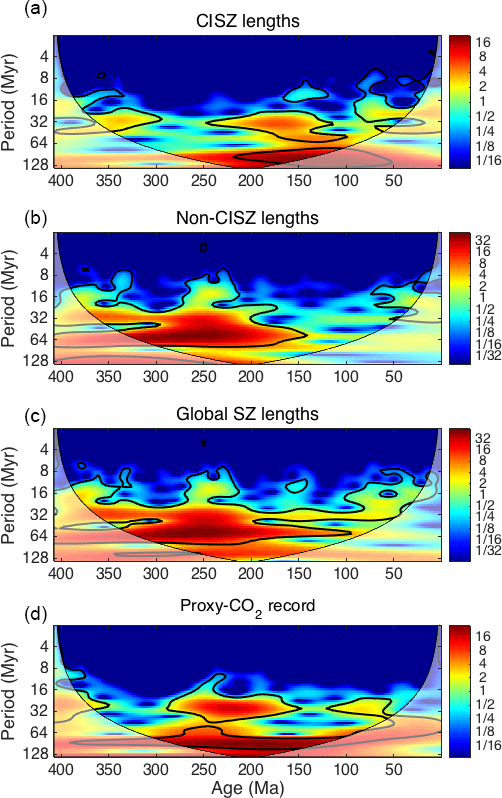
Figure 2Continuous wavelet transforms (CWT) for four time series: (a) carbonate-intersecting subduction zone (CISZ) lengths, (b) non-CISZ lengths, (c) global subduction zone lengths and (d) the proxy CO2 data from Foster et al. (2017). Thick black contours designate the 5 % significance level against a red noise background spectrum. The cone of influence (white translucent region) is where edge effects distort the spectrum, meaning that results in this region are not reliable. The colour bar indicates the range of wavelet power in the wavelet power spectrum, with hotter colours corresponding to the maximum peaks in wavelet power. Note the logarithmic scale of the period (Myr) axis.
4.2 Cross-wavelet transform (XWT) and wavelet transform coherence (WTC)
The periodic components common in the subduction zone length time series and the proxy CO2 record were investigated further using XWT and WTC (Fig. 3). The XWT highlights areas of common high wavelet power between two CWTs, whereas the WTC finds the correlation between two CWTs in time, highlighting persistent and significant periodic signals even if cross-wavelet power is low (Grinsted et al., 2004). Phase-locked arrows within the 95 % confidence contours in the WTC (arrows that do not change direction through time) are the strongest indicator of a persistent periodic signal. Generally, the WTC analysis between subduction zone lengths and the proxy CO2 record does not highlight significant and prolonged coherence through time, but rather, highlights time intervals where periodic behaviour was significant and stable.
While a prolonged interval of high joint power in the XWT spectra between CISZ lengths and proxy CO2 exists in the 24–48 Myr waveband (Fig. 3a), this is not found to be coherent through time in the WTC (Fig. 4d). However, the ∼ 96 Myr waveband is coherent in 200–100 Ma and likewise, the 32–48 Myr waveband is coherent in 60–40 Ma (Fig. 3d). Portions of these regions lie outside the COI and are thus cannot be well localised in time. Other areas of high coherence are not linked to significant cross-spectral power in the XWT.
East-pointing arrows that are phase-locked in the WTC in the ∼ 96 Myr waveband indicate in-phase peaks, such that local maxima in CISZ lengths and palaeo-atmospheric CO2 are aligned over the 200–100 Ma time interval (Fig. 3d). Between 60 and 40 Ma, coherent behaviour between CISZ lengths and the proxy CO2 record is characterised by a 32–48 Myr periodicity and CISZ lengths lead CO2 peaks by ∼ 90∘ (∼ 8–12 Myr; Fig. 3d). Over a similar time interval, coherent behaviour is found between the proxy CO2 record and global subduction zones. Between ∼ 60 and 20 Ma in the 16–24 Myr waveband, CO2 peaks lag by 5–8 Myr behind peaks in global subduction zone lengths (Fig. 3f). However, cross-wavelet power is stronger between the CO2 record and CISZ lengths compared to global subduction zone lengths over the 60–20 Ma interval (Fig. 3a, c).
Non-CISZ lengths and proxy CO2 record share broad areas of high common power (Fig. 3b), yet the most significant region in the WTC is the 12–16 Myr waveband of 275–225 Ma (Fig. 3e), corresponding to a significant area of the XWT. In this region, north-pointing phase arrows indicate a 90∘ (∼ 3–4 Myr) lag of peaks in the proxy CO2 record compared to peaks in non-CISZ lengths. Similarly, peaks in the proxy CO2 record lag global subduction zone lengths by 3–4 Myr in a cyclic period of 12–16 Myr (Fig. 3e). South-pointing phase-locked arrows indicate that CO2 peaks are leading peaks in non-CISZ lengths (48–64 Myr waveband, 315–185 Ma) and west-pointing arrows indicate anti-phase behaviour (where peaks in one time series coincide with troughs of another time series; 16–32 Myr, 210–150 Ma), both of which do not support causal relationships.
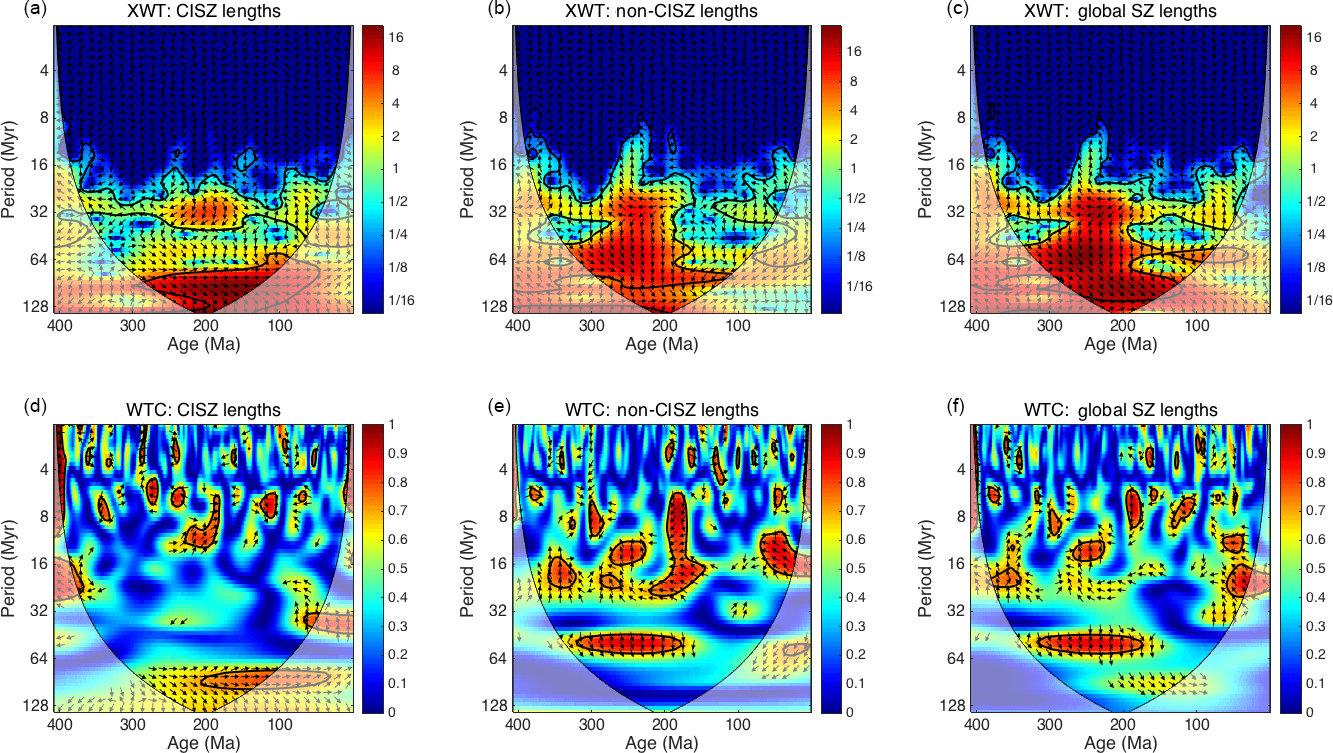
Figure 3The cross-wavelet transforms (XWT; top) and wavelet transform coherence (WTC; bottom) for (a, d) CISZ, (b, e) non-CISZ and (c, f) global subduction zone lengths respectively and the proxy CO2 record (Foster et al., 2017). Thick black contours designate the 5 % significance level against a red noise spectrum. The white translucent region designates the cone of influence (COI). The colour bar indicates the magnitude of cross-spectral power for the XWT, and for the WTC it represents the significance level of the Monte Carlo test. The arrows indicate the phase relationship of the two time series in time-frequency space, where east-pointing arrows indicate in-phase behaviour, west-pointing arrows indicate anti-phase behaviour, north-pointing arrows indicate that the peaks in subduction zone lengths leads the CO2 peaks and south-pointing arrows indicating that CO2 peaks lead peaks in subduction zone lengths.
The XWT shows that global subduction zone lengths and the proxy CO2 record share regions of high joint wavelet power (Fig. 3c). Nevertheless, extended horizontal regions in the WTC with south-pointing arrows indicate that CO2 peaks lead subduction zone lengths (48–64 Myr waveband, 315–185 Ma) and areas of coherence coincide with areas of low cross-spectral power (wavebands < 16 and 16–24 Myr, 380–340 Ma), undermining the potential of causal relationships (Fig. 3f).
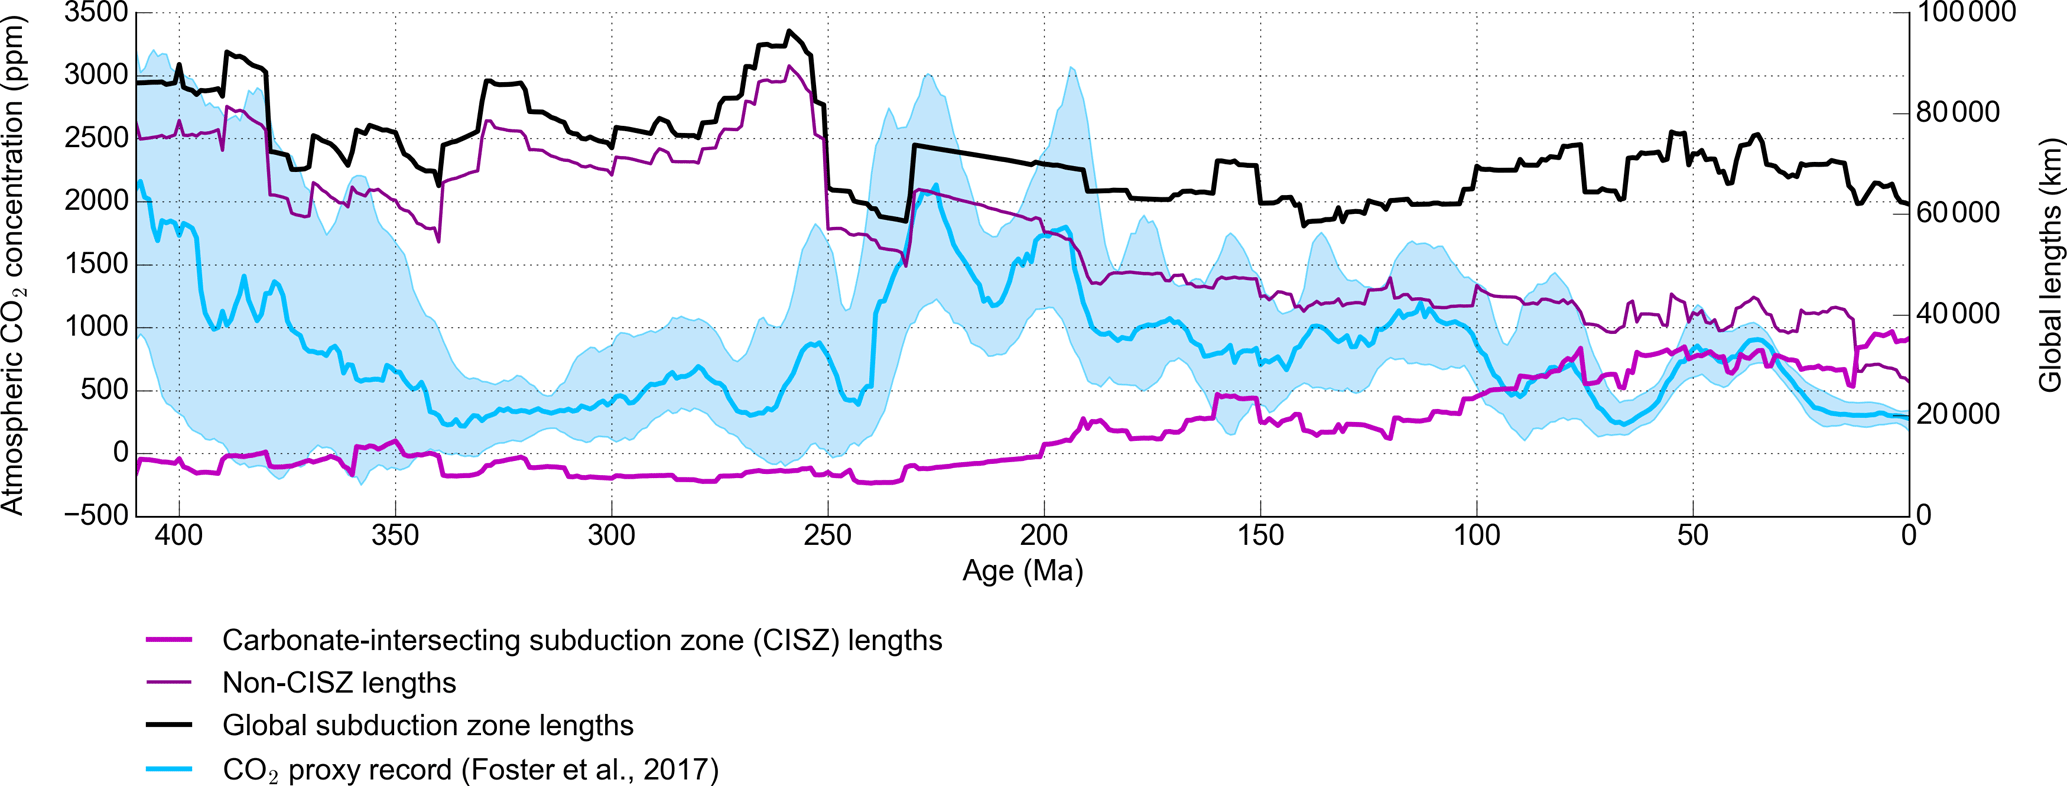
Figure 4Graph of total global lengths of subduction zones (black) compared with lengths of all subduction zones that intersect with buried crustal carbonate platforms (magenta, thick) and those subduction zone lengths that do not intersect crustal carbonate platforms (dark magenta, thin). The proxy CO2 record (blue) from Foster et al. (2017) with upper and lower bounds (blue envelope) is displayed for comparison.
4.3 Comparing carbonate-intersecting arc length and palaeo-CO2 trends
At present day, our estimates of CISZ and global subduction zone lengths reach approximately 35 300 and 62 000 km respectively. CISZ lengths show an increasing trend over time, especially from 220 Ma to present when lengths reliable reach above 10 000 km globally. From 250 Ma, accumulated carbonate platforms consistently intersect ∼ 70 % of total global subduction zone lengths (Fig. 4). Coherence analysis suggests that CISZ lengths and palaeo-atmospheric CO2 peaks may not be well correlated prior to 200 Ma. Indeed, CISZ lengths make up a small proportion of global subduction zones prior to 200 Ma, beginning at 8600 km at 410 Ma and increasing to over 14 000 km only after 200 Ma (Fig. 4). During some time windows, periodic behaviour may be correlated. These two areas of significance highlighted by the XWT and WTC analysis are between 200 and 100 Ma, and between 60 and 40 Ma (Fig. 3a, d). Between 200 and 100 Ma, WTC highlights linked periodic behaviour between CISZ lengths and the proxy CO2 record for a period length of ∼ 96 Myr (Fig. 3d). CISZ lengths increase non-uniformly over this period from ∼ 14 300 to ∼ 23 800 km, whereas palaeo-atmospheric CO2 levels drop from ∼ 1700 parts per million (ppm) to ∼ 860 ppm. Over the 60–40 Ma period, where WTC analysis found that CISZ lengths lead CO2 peaks by ∼ 8–12 Myr (Fig. 3d), CISZ lengths show small-scale oscillations between 28 400 and 33 700 km compared with broader, defined peaks in atmospheric CO2 (Fig. 4). Note that WTC analysis also found coherence with the proxy CO2 and global subduction zone lengths over a similar period (∼ 60–20 Ma), where peaks in global subduction zone lengths lead peaks in CO2 by ∼ 5–8 Myr in a 16–24 Myr cycle (Fig. 3f).
At 258 Ma, non-CISZ lengths reach a peak of 86 424 km as global subduction zone lengths reach 95 500 km, followed by palaeo-atmospheric CO2 reaching a peak of 880 ppm at 252 Ma. This result coheres with cyclic behaviour found in the WTC, where peaks in non-CISZ and global subduction zone lengths precede local CO2 maxima by 3–4 Myr in the 275–225 Ma time frame (Fig. 3e). In the same interval, a peak at 230 Ma in total subduction zone lengths and non-CISZ lengths (73 700 and 63 600 km respectively) precede a peak at 226 Ma in the proxy CO2 record (∼ 2100 ppm).
With growing global reservoirs of carbonate platforms since 250 Ma, we expect to see linked, periodic behaviour in the most recent past compared to 410–250 Ma if the length of CISZs have had a dominant climate-forcing effect. Indeed, our wavelet analysis highlights that CISZ lengths and the proxy CO2 record have aligned local maxima in 200–100 Ma, and found that ∼ 96 Myr cyclical behaviour between the two time series is linked in that time interval. Furthermore, if results found outside the COI could be localised better in time, it is possible that the cycle would extend further toward the present day. Our result that increased CISZ lengths 200–100 Ma drove the Jurassic–Cretaceous peak in atmospheric CO2 is consistent with the latest COPSE model results where a peak and decline of atmospheric CO2 and global temperature in the 200–0 Ma interval was driven by a peak and decline in volcanic degassing (Lenton et al., 2018). At this time, the breakup of Pangaea drove increased subduction zone lengths with continental dispersal, and thus increased CISZ lengths, especially at the northern edge of the Mongol–Okhotsk plate and in the Tethyan tectonic domain (Fig. 5c). However, Brune et al. (2017) found that continental rifting has the potential to drive massive CO2 emissions, especially from the 160–100 Ma time interval. Furthermore, degassing of basalt flows from the central Atlantic magmatic province (CAMP) ∼ 200 Ma has also been postulated to have driven climate change as well as the end-Triassic extinction (Davies et al., 2017).
As multiple feedback mechanisms between the geosphere, biosphere and atmosphere are at play in the 200–100 Ma time frame, it is unclear whether subduction zone lengths had a dominant or auxiliary effect in controlling increased atmospheric CO2. Moreover, in 60–40 Ma, a 32–48 Myr cyclicity prevailed, characterised by local maxima in CISZ lengths lead peaks in CO2 by ∼ 8–12 Myr (Fig. 3a, d). The implications of this result are discussed in Sect. 5.2.
From the WTC (Fig. 3e, f), we observe that local maxima in non-CISZ lengths and global subduction zone lengths are found to lead local maxima in palaeo-atmospheric CO2 by 3–4 Myr in a 12–16 Myr cycle, in the Permian–Triassic interval (275–225 Ma). While this indicates that a trend in global subduction zone and non-CISZ lengths may have had a climate-forcing effect in the 275–225 Ma time frame, multiple tectonic and non-tectonic events may have also influenced greenhouse conditions. It is during this time that massive volcanism from the Siberian traps and Emeishan large igneous province (LIP) were particularly important in the sudden increase in atmospheric CO2 (Renne et al., 1995; Johansson et al., 2018). Contemporaneously, it has also been suggested that an asteroid impact (Kaiho et al., 2001), oceanic anoxia (Wignall and Hallam, 1992) and a release of oceanic methane hydrates (Kump et al., 2005) all contributed to elevated atmospheric CO2 and the warmer climate at the Permian–Triassic boundary.
Overall, we find that multiple tectonic and non-tectonic forcings are at play during the 275–225 and 200–100 Ma time intervals where CISZ lengths appeared to have a dominant effect on atmospheric CO2.
Moreover, CISZ lengths and the proxy CO2 record are largely found to be independent with no strong leading relationship in the signal phase offset that is consistent through time. While there are several regions in all XWTs of significant common power between the proxy CO2 record and our subduction zone time series, the regions were not coherent in the WTC and could not be distinguished from random coincidence. For example, the prolonged ∼ 32 Myr cyclic trend in CISZ lengths appearing in the XWT (Fig. 3a) was not found to be consistent in time in the WTC (Fig. 3d). Additionally, in some time intervals, phase arrows in the WTC did not support the climate-forcing effect of subduction zone lengths. Ultimately, our study does not support the hypothesis that carbonate-intersecting arcs have had a sustained and dominant influence on atmospheric CO2 levels over the past 410 Myr. Instead, carbonate-intersecting subduction-derived magmatism is likely to have episodic control on atmospheric CO2, perhaps related to the inception or abandonment of major regional continental subduction zones. However, potential issues with the large uncertainties in the proxy record, complexities in reconstructing pre-Pangaea subduction zones and carbonate platforms, as well as the requirement to filter the time series, may influence this result.
5.1 Present-day subduction zone estimates
At present day, our estimates of CISZ lengths are approximately 2.4 times greater than the recent calculations of present-day global continental arc lengths by Cao et al. (2017; 62 000 and 15 000 km respectively). Cao et al. (2017) focussed on measuring the extent of continental volcanic arcs, whereas our investigation encompasses the total segment lengths of all subduction zones, including those that intersect carbonate platforms. Therefore, our analysis tends to capture a broader range of CO2 degassing mechanisms along subduction zones, including diffuse outgassing from fore-arcs, back-arcs and volcanic arcs along faults, fractures and fissures, in addition to arc volcanoes. This is because melt is ubiquitous along subduction zones, and there is very little carbon storage along arcs (Keleman and Manning, 2015). For this reason, our approach differs from that of Cao et al. (2017), as we are attempting to capture additional mechanisms of CO2 escape along continental subduction zones, as opposed to only those directly associated with volcanic arcs, and our estimates may be regarded as an upper bound on total CO2 emissions at subduction zones.
5.2 Implications for Palaeogene climate
Wavelet analysis also reveals coherent behaviour in the 60–40 Ma interval where local maxima in CISZ lengths consistently precede local maxima in palaeo-atmospheric CO2 by ∼ 8–12 Myr in a 32–48 Myr cycle. Between 60 and 40 Ma, subduction zone lengths also were found to have local maxima preceding local maxima in palaeo-atmospheric CO2 by ∼ 5–8 Myr in a 16–24 Myr cycle. However, cross-wavelet power is stronger between CISZ lengths and the CO2 record, suggesting that CISZ volcanism on a global scale had marginally more effect on climate 60–40 Ma than global subduction zone volcanism. The results may indicate that increases in global subduction zone lengths and CISZ lengths may have contributed to the Early Eocene climatic optimum (EECO) in 53–51 Ma, where temperatures were 14 ± 3 ∘C warmer than the pre-industrial period (Caballero and Huber, 2013). While climate interactions and feedbacks leading to the greenhouse state remain uncertain, climate sensitivity to CO2 forcing is likely (Anagnostou et al., 2016).
The termination of arc volcanism particularly along the Sundaland margin, where a large area of carbonate platforms are buried, contributed ∼ 3000 km to the global reduction in CISZ lengths by ∼ 7000 km between 75 and 65 Ma (Fig. 5e, f). The resumption of subduction along the Sunda–Java trench at 65 Ma described by Zahirovic et al. (2016) and the emplacement of a set of carbonate platforms in the lower latitudes at 63 Ma explain the modelled results of an increase in CISZ lengths at 63 Ma which persist until present day (Fig. 5f). The EECO occurred approximately 10 Myr later, supporting the 8–12 Myr lag in peaks of a ∼ 32–48 Myr periodicity found by the CISZ-CO2 XWT and WTC (Fig. 3a).
Our analysis shows a concomitant increase in global subduction zone lengths (Fig. 4), which cannot be ruled out as an explanatory source of climate forcing. However, modern volcanic CO2 output from arcs in Indonesia, Papua New Guinea, parts of the Andes and Italian magmatic province are strongly influenced by carbonate assimilation (Mason et al., 2017) and volcanoes in those regions currently contribute significantly to global atmospheric CO2 flux (Carter and Dasgupta, 2015). Assuming a similar subduction style, this result gives plausibility to the idea that volcanic activity along the Sunda–Java trench during the Palaeogene also significantly contributed to global CO2 output.
Previous studies have suggested that global arc CO2 contributed to the baseline warm climate of the Late Cretaceous and late Palaeogene, due to the greater size of carbonate reservoirs in continents and the increased continental arc lengths (Lee et al., 2013; Carter and Dasgupta, 2015; McKenzie et al., 2016; Cao et al., 2017). Our results agree well with the hypothesis, as a relative increase in carbonate-intersecting subduction zone lengths has been linked to a peak in atmospheric CO2 in 60–40 Ma, contributing to enhanced CO2 degassing. However, it cannot be determined from this study whether the increase in global subduction zone lengths is more important than the relative increase in the lengths that intersect carbonate platforms.

Figure 5Plate reconstructions with plate boundaries (black), subduction zones (purple) and distributions of carbonate platforms. Carbonate platforms are distributed according to the accumulation model at key intervals from 400 Ma to present day. Colour bar corresponds to the time during which the carbonate platforms were actively developing in the crust. In addition, we set Precambrian and early Phanerozoic carbonate occurrences to appear at the beginning of the model time frame, as the reconstructions do not yet extend beyond Devonian times.
5.3 Limitations of wavelet analysis
Wavelet analysis is inherently sensitive to the shape of signals, and as such, adjustment of filtering and processing techniques introduces variations in the results. A 5 Myr moving average window filter was chosen to remove high-frequency noise, yet it may have moved trends forward in time, which ultimately changes whether peaks overlap or not and adds uncertainty to results. Peaks in the XWT were robust in that they were found to appear in XWT plots regardless of the intensity of smoothing, yet the significance contours differed strongly due to smoothing. For instance, with a longer low-bandpass filter, small-scale oscillations < 5 Myr were removed, reducing areas of significant power in the shorter wavebands. Similarly, when experimenting with a high-bandpass filter, significant regions were directed away from the longer periodicities of > 64 Myr to shorter periodicities. The low-bandpass filter was chosen to remove the noise for smaller periodicities where fluctuations were less likely to represent trends instead possibly represent artefacts of interpolation, and as a result, this study cannot evaluate short-term relationships between climate and subduction zone volcanism.
Our analysis technique cannot quantify the error that propagates from uncertainty in the proxy CO2 record and subduction zone length signal through to the correlation uncertainty. Firstly, the Foster et al. (2017) proxy CO2 record is a maximum probability estimate of atmospheric palaeo-CO2 from a wider 95 % confidence envelope. While the uncertainties appear to be time-localised, the uncertainty in CO2 concentrations in the proxy record could not be captured by our method of extracting only one time series for analysis. Similarly, the Matthews et al. (2016) tectonic plate model represents one interpretation of geological data which becomes sparse for deeper geological time, especially for pre-Pangaea times (before ∼ 250–200 Ma). As there are no comparable models, we cannot quantify uncertainty in our subduction length signals. Therefore, we acknowledge that our comparison of two time series with large uncertainties are insufficient in constraining periodic behaviour and future research should involve comparing our estimates with other models and data.
XWT analysis describes areas with high power which can be misleading when the XWT spectrum is not normalised. For instance, areas of high joint power were found where relatively flat peaks in the CISZ length data occurred simply because of the large amplitude of peaks in the proxy CO2 data. The vast differences in magnitude do not necessarily constitute a causative relationship. WTC analysis does not present this problem because the spectrum is normalised, and hence periodicities with strong power were not necessarily found to be coherent (Maraun and Kurths, 2004). The combination of both measures somewhat circumvents the problem of misleading peaks in the XWT, but not entirely. Given that wavelet analysis is very sensitive to magnitude and timing of peaks, the fact that the uncertainty in our modelled estimates of subduction zone lengths are not well constrained introduces variability in correlative relationships. Wavelet analysis, like other signal processing techniques, is limited by the length of the time series data investigated. Periods of greater than half the time series length cannot be examined using this method (Winder, 2002). Therefore, very long oscillations on the scale of 250 Myr or more could not be derived from our data. One reason for examining patterns on 250 Ma periods is due to the very long-term nature of supercontinent cycles. The accretion of supercontinents such as Pangaea and Rodinia is associated with shortened continental subduction zone lengths, whilst continental break-up and dispersal initiates subduction on the edges of continents, and thus increases continental subduction zone lengths (Lenardic et al., 2011; Lee et al., 2016). These changing modes of supercontinent break-up or accretion have the potential to influence climate. Given that supercontinent cycles exceed 200 Myr in length and exert a large effect on the length of continental arcs (Lee et al., 2013), applying this analysis to plate reconstructions that capture multiple supercontinent cycles (e.g. Merdith et al., 2017) to investigate whether such long-term linkages exist between atmospheric CO2 and global subduction zone emissions.
5.4 Limitations of model assumptions
The extent to which our models are representative of subduction zone CO2 emissions is limited by some issues with the subduction zone quantification approach. The subduction zone modelling attempted to approximate atmospheric CO2 flux at subduction zones without directly measuring it by assuming a constant CO2 flux and a unit correspondence of subduction zone lengths to volcanoes, vents or fissures. Both assumptions are problematic. There are several dynamic factors that govern subduction zone CO2 flux such as convergence rates (van der Meer et al., 2014), the composition and volume of subducted sediments (Rea and Ruff, 1996), convergence obliquity (Kerrick and Connolly, 2001), slab volume flux (Fischer, 2008), the relative contribution of metamorphic decarbonation in the crust and in the mantle wedge (Keleman and Manning, 2015) and the efficiency of decarbonation (Johnston et al., 2011). The model does not account for these factors and assumes that the parameters of CO2 flux have remained constant in time. In addition, the number of volcanoes or vents per unit length of subduction zones is neither constant through time nor correlated, at least for the circum-Pacific arc and Central American arc (Kerrick, 2001). Furthermore, the accumulation model has no way to account for carbonate platform thicknesses, and thus cannot account for the realistic depletion of crustal carbonate reservoirs through time. The inability of the model to incorporate the complexity of depleting carbonate platforms may lead to sampling bias during continental collisions. This highlights an area of future improvement, including the utilisation of subduction zone geodynamic–geochemical modelling (e.g. Gonzales et al., 2016) by tracking different CO2 reservoirs in a geodynamic context.
Furthermore, uncertainty cannot currently be measured using our GPlates modelling approach. Uncertainty propagates through the plate motion model over deeper reaches of geological time, such that it is currently impossible to quantify uncertainty of all possible configurations of subduction zones, especially in the pre-Pangaea time frame. Moreover, there is much greater uncertainty in the dynamic mechanisms of carbon cycling along subduction zones, and quantification of all geochemical decarbonation reactions is still in infancy (Gonzales et al., 2016). For these reasons, formal uncertainties cannot yet be quantified for models of subduction zone carbon cycling. Taking all limitations into consideration, the accumulation model still provides a first-order approximation of changing subduction zone lengths through time and the interaction with (buried) carbonate platforms as an indicator of CO2 degassing, especially during the Palaeogene.
Wavelet analysis is a useful tool in elucidating coherent, phase-related periodicities between the CO2 record and various climate-forcing factors. Furthermore, our accumulation model has the potential to capture a broader range of degassing mechanisms, and thus provide an upper bound of total CO2 emissions at subduction zones.
Our analysis has revealed that carbonate-intersecting subduction zone volcanism is likely to have contributed to the greenhouse excursion of the Early Eocene climatic optimum, with the CISZs along the Sunda–Java trench representing the largest contribution to atmospheric CO2. At other times, our analysis reveals potentially causal relationships among CISZ, non-CISZ and global subduction zone lengths and atmospheric CO2 trends, but the effect of subduction zones could not be disambiguated from other tectonic and non-tectonic climate forcings. This analysis lends partial support to the idea that, at certain times, carbonate-intersecting subduction zone volcanism is more important than non-carbonate-intersecting activity in driving atmospheric CO2, yet the climate system is vastly complex and the result could mean that other processes have dominated climate feedback mechanisms through time, such as the proliferation of terrestrial plant life (Algeo and Scheckler, 1995), silicate weathering (Kent and Muttoni, 2008) and the emplacement of LIPs (Belcher and Mander, 2012).
Generally, an absence of constraints on carbon–climate interactions in deep time makes it difficult to test hypotheses about greenhouse and icehouse climate states. Clearly, more robust reconstructions of climate-forcing processes are needed to improve our understanding of the deep carbon system. It is suggested that further investigations be carried out 410–350 Ma and 50–0 Ma to eliminate the uncertainty around the time periods at the end of the data series that lie within the COI. With adjustments to the parameters and assumptions governing the carbonate platform evolution models, the data can be used as input into fully coupled planetary-scale climate and carbon cycle box models. This would provide the most comprehensive and self-consistent approach to understand the contribution of emissions at subduction zones to the deep carbon cycle.
The subduction zone toolkit by Doss et al. (2016; https://doi.org/10.5281/zenodo.154001) was developed as a product of this research and has been made publicly available for use with open-source plate reconstruction software, GPlates. The toolkit includes all proxy CO2 data, pyGPlates and bash scripts as well as the Matthews et al. (2016) plate model.
Both the Signal Processing Toolbox™ and Wavelet Coherence Toolbox™ for MATLAB® were used in analysis and the production of figures. The Wavelet Coherence Toolbox™ can be found at http://noc.ac.uk/marine-data-products/cross-wavelet-wavelet-coherence-toolbox-matlab (last access: 10 June 2018), while the Signal Processing Toolbox™ can be found at http://au.mathworks.com/help/signal/index.html (last access: 10 June 2018).
The supplement related to this article is available online at: https://doi.org/10.5194/cp-14-857-2018-supplement.
SD and JP developed the Subduction Zone toolkit together and carried out modelling experiments under the supervision of DM and SZ. Figures were prepared by JP and SD, and the toolkit repository was prepared by SD. JP conducted wavelet analysis with assistance from RH. JP also prepared the manuscript with contributions from all co-authors.
The authors declare that they have no conflict of interest.
The authors acknowledge and thank the Alfred P. Sloan Foundation and the Deep
Carbon Observatory (DCO) for funding this research. We would also like to
thank members of the EarthByte Group for all their assistance, as well as the
University of Sydney for supporting open source and open access
research.
Edited by: Laurie Menviel
Reviewed by: three anonymous referees
Algeo, T. J. and Scheckler, S. E.: Terrestrial-marine teleconnections in the Devonian: links between the evolution of land plants, weathering processes, and marine anoxic events, Philos. T. R. Soc. B, 353, 1965, https://doi.org/1098/rstb.1998.0195, 1998.
Anagnostou, E., John, E. H., Edgar, K. M., Foster, G. L., Ridgwell, A., Inglis, G. N., Pancost, R. D., Lunt, D. J., and Pearson, P. N.: Changing atmospheric CO2 concentration was the primary driver of early Cenozoic climate, Nature, 533, 380–384, 2016.
Belcher, C. M. and Mander, L.: Catastrophe: Extraterrestrial impacts, massive volcanism, and the biosphere, in: The Future of the World's Climate, edited by: Henderson-Sellers, A. and McGruffie, K., Elsevier, Amsterdam, 463–485, 2012.
Bergman, N. M., Lenton, T. M., and Watson, A. J.: COPSE: A new model of biogeochemical cycling over Phanerozoic time, AJS Online, 304, 397–437, https://doi.org/10.2475/ajs.304.5.397, 2004.
Berner, R. A.: The Phanerozoic Carbon Cycle: CO2 and O2, Oxford University Press, 2004.
Berner, R. A.: GEOCARBSULF: A combined model for Phanerozoic atmospheric O2 and CO2, Geochim. Cosmochim. Ac., 70, 5653–5664, 2006.
Berner, R. A. and Caldeira, K.: The need for Mass balance and feedback in the geochemical carbon cycle, Geology, 25, 955–956, 1997.
Boyden, J. A., Müller, R. D., Gurnis, M., Torsvik, T. H., Clark, J. A., Turner, M., Ivey-Law, H., Watson, R. J., and Cannon, J. S.: Next-generation plate-tectonic reconstructions using GPlates, Geoinformatics: cyberinfrastructure for the solid earth sciences, 9, 5–114, 2011.
Brady, P. V. and Gíslason, S. R.: Seafloor weathering controls on atmospheric CO2 and global climate, Geochim. Cosmochim. Ac., 61, 965–973, 1997.
Brune, S., Williams, S. E., and Müller, R. D.: Potential links between continental rifting, CO2 degassing and climate change through time, Nat. Geosci., 10, 941–946, https://doi.org/10.1038/s41561-017-0003-6, 2017.
Caballero, R. and Huber, M.: State-dependent climate sensitivity in past warm climates and its implications for future climate projections, P. Natl. Acad. Sci. USA, 110, 14162–14167, 2013.
Cao, W., Lee, C.-T. A., and Lackey, J. S.: Episodic nature of continental arc activity since 750 Ma: A global compilation, Earth Planet. Sc. Lett., 461, 85–95, https://doi.org/10.1016/j.epsl.2016.12.044, 2017.
Carter, L. B. and Dasgupta, R.: Hydrous basalt–limestone interaction at crustal conditions: Implications for generation of ultracalcic melts and outflux of CO2 at volcanic arcs, Earth Planet. Sc. Lett., 427, 202–214, 2015.
Cohen, K., Finney, S., Gibbard, P., and Fan, J.-X.: The ICS international chronostratigraphic chart, Episodes, 36, 199–204, 2013.
Domeier, M. and Torsvik, T. H.: Plate tectonics in the late Palaeozoic, Geosci. Front., 5, 303–350, 2014.
Doss, S., Zahirovic, S., Müller, D., and Pall, J.: DCO Modelling Of Deep Time Atmospheric Carbon Flux from Subduction Zone Interactions: Plate Models and Minor Edits, Zenodo, https://doi.org/10.5281/zenodo.154001, 2016.
Espurt, N., Funiciello, F., Martinod, J., Guillaume, B., Regard, V., Faccenna, C., and Brusset, S.: Flat subduction dynamics and deformation of the South American plate: Insights from analog modeling, Tectonics, 27, https://doi.org/10.1029/2007TC002175, 2008.
ESRI: Release 10, Documentation Manual, Redlands, CA, Environmental Systems Research Institute, 2011.
Fischer, T. P.: Fluxes of volatiles (H2O, CO2, N2, Cl, F) from arc volcanoes, Geochem. J., 42, 21–38, 2008.
Foster, G. L., Royer, D. L., and Lunt, D. J.: Future climate forcing potentially without precedent in the last 420 million years, Nat. Commun., 8, 14845, https://doi.org/10.1038/ncomms148452017, 2017.
Global Volcanism Program: Volcanoes of the World, v. 4.7.0., Smithsonian Institution, edited by: Venzke, E., https://doi.org/10.5479/si.GVP.VOTW4-2013, 2013.
Golonka, J. and Kiessling, W.: Phanerozoic time scale and definition of time slices, in: SEPM (Society for Sedimentary Geology), Phanerozoic Reef Patterns, edited by: Kiessling, W., Flugel, E., and Golonka, J., Special Publication, 72, 11–29, 2002.
Gonzalez, C., Gorczyk, W., and Gerya, T.: Decarbonation of subducting slabs: Insight from petrological–thermomechanical modeling, Gondwana Res., 36, 314–332, 2016.
Grinsted, A., Moore, J. C., and Jevrejeva, S.: Application of the cross wavelet transform and wavelet coherence to geophysical time series, Nonlin. Processes Geophys., 11, 561–566, https://doi.org/10.5194/npg-11-561-2004, 2004.
Grotzinger, J. P. and James, N. P.: Precambrian carbonates: evolution of understanding, SEPM Special Publication, 6, 3–20, 2000.
Gurnis, M., Turner, M., Zahirovic, S., DiCaprio, L., Spasojevic, S., Müller, R., Boyden, J., Seton, M., Manea, V., and Bower, D.: Plate Tectonic Reconstructions with Continuously Closing Plates, Comput. Geosci., 38, 35–42, 2012.
Johansson, L., Zahirovic, S., and Müller, R. D.: The interplay between the eruption and weathering of Large Igneous Provinces and the deep-time carbon cycle, Geophys. Res. Lett., https://doi.org/10.1029/2017GL076691, online first, 2018.
Johnston, F. K., Turchyn, A. V., and Edmonds, M.: Decarbonation efficiency in subduction zones: Implications for warm Cretaceous climates, Earth Planet. Sc. Lett., 303, 143–152, 2011.
Kaiho, K., Kajiwara, Y., Nakano, T., Miura, Y., Kawahata, H., Tazaki, K., Ueshima, M., Chen, Z., and Shi, G. R.: End-Permian catastrophe by a bolide impact: evidence of a gigantic release of sulfur from the mantle, Geology, 29, 815–818, 2001.
Keleman, P. and Manning, C.: Reevaluating carbon fluxes in subduction zones, what goes down, mostly comes up, P. Natl. Acad. Sci. USA, 112, E3997–E4006, 2015.
Kent, D. V. and Muttoni, G.: Equatorial convergence of India and early Cenozoic climate trends, P. Natl. Acad. Sci. USA, 105, 16065–16070, 2008.
Kent, D. V. and Muttoni, G.: Modulation of Late Cretaceous and Cenozoic climate by variable drawdown of atmospheric pCO2 from weathering of basaltic provinces on continents drifting through the equatorial humid belt, Clim. Past, 9, 525–546, https://doi.org/10.5194/cp-9-525-2013, 2013.
Kerrick, D. M.: Present and past nonanthropogenic CO2 degassing from the solid Earth, Rev. Geophys., 39, 565–585, 2001.
Kerrick, D. and Connolly, J.: Metamorphic devolatilization of subducted oceanic metabasalts: implications for seismicity, arc Magmatism and volatile recycling, Earth Planet. Sc. Lett., 189, 19–29, 2001.
Kiessling, W. and Flugel, E.: Paleoreefs – A databse on Phanerozoic reefs, SEPM Special Publication, 72, 77–92, ISBN: 1-56576-081-6, 2002.
Kiessling, W., Flügel, E., and Golonka, J.: Patterns of Phanerozoic carbonate platform sedimentation, Lethaia, 36, 195–225, 2003.
Krissansen-Totton, J. and Catling, D. C.: Constraining climate sensitivity and continental versus seafloor weathering using an inverse geological carbon cycle model, Nat. Commun., 8, 15423, https://doi.org/10.1038/ncomms15423, 2017.
Kump, L. R., Pavlov, A., and Arthur, M. A.: Massive release of hydrogen sulfide to the surface ocean and atmosphere during intervals of oceanic anoxia, Geology, 33, 397–400, 2005.
Lau, K. and Weng, H.: Climate signal detection using wavelet transform: How to make a time series sing, B. Am. Meteorol. Soc., 76, 2391–2402, 1995.
Lee, C. T. A. and Lackey, J. S.: Global continental arc flare-ups and their relation to long-term greenhouse conditions, Elements, 11, 125–130, 2015.
Lee, C.-T. A., Shen, B., Slotnick, B. S., Liao, K., Dickens, G. R., Yokoyama, Y., Lenardic, A., Dasgupta, R., Jellinek, M., and Lackey, J. S.: Continental arc–island arc fluctuations, growth of crustal carbonates, and long-term climate change, Geosphere, 9, 21–36, 2013.
Lee, H., Muirhead, J. D., Fischer, T. P., Ebinger, C. J., Kattenhorn, S. A., Sharp, Z. D., and Kianji, G.: Massive and prolonged deep carbon emissions associated with continental rifting, Nat. Geosci., https://doi.org/10.1029/2017GL07669, 2016.
Lenardic, A., Moresi, L., Jellinek, A., O'Neill, C., Cooper, C. M., and Lee, C. T.: Continents, supercontinents, mantle thermal mixing, and mantle thermal isolation: Theory, numerical simulations and laboratory experiments, Geochem. Geophy. Geosy., 12, Q10016, https://doi.org/10.1029/2011GC003663, 2011.
Lenton, T. M., Daines, S. J., and Mills, B. J. W.: COPSE reloaded: an improved model of biogeochemical cycling over Phanerozoic time, Earth-Sci. Rev., 178, 1–28, https://doi.org/10.1016/j.earscirev.2017.12.004, 2018.
Maraun, D. and Kurths, J.: Cross wavelet analysis: significance testing and pitfalls, Nonlin. Processes Geophys., 11, 505–514, https://doi.org/10.5194/npg-11-505-2004, 2004.
Mason, E., Edmonds, M., and Turchyn, A. V.: Remobilization of crustal carbon may dominate volcanic arc emissions, Science, 357, 6348, https://doi.org/10.1126/science.aan5049, 2017.
Matthews, K. J., Maloney, K. T., Zahirovic, S., Williams, S. E., Seton, M., and Müller, R. D.: Global plate boundary evolution and kinematics since the late Palaeozoic, Global Planet. Change, 146, 226–250, https://doi.org/10.1016/j.gloplacha.2016.10.002, 2016.
McKenzie, N. R., Horton, B. K., Loomis, S. E., Stockli, D. F., Planavsky, N. J., and Lee, C. T.: Continental arc volcanism as the principal driver of icehouse-greenhouse variability, Science, 352, 444–447, https://doi.org/10.1126/science.aad5787, 2016.
Meng, Q.-R., Wei, H.-H., Qu, Y.-Q., and Ma, S.-X.: Stratigraphic and sedimentary records of the rift to drift evolution of the northern North China craton at the Paleo- to Mesoproterozoic transition, Gondwana Res., 20, 205–218, 2011.
Merdith, A. S., Collins, A. S., Williams, S. E., Pisarevsky, S., Foden, J. D., Archibald, D. B., Blades, M. L., Alessio, B. L., Armistead, S., Plavsa, D., Clark, C., an Muller, R. D.: A full-plate global reconstruction of Neoproterozoic, Gondwana Res., 50, 84–134, 2017.
Müller, R. D., Seton, M., Zahirovic, S., Williams, S. E., Matthews, K. J., Wright, N. M., Shephard, G. E., Maloney, K., Barnett-Moore, N., and Hosseinpour, M.: Ocean basin evolution and global-scale plate reorganization events since Pangea breakup, Annu. Rev. Earth Pl. Sc., 44, 107–138, 2016.
Paleobiology Database: Data occurrences with carbonate lithology 4600–541 Ma, available at: https://paleobiodb.org, 15 May 2018.
Rea, D. K. and Ruff, L. J.: Composition and Mass flux of sediment entering the world's subduction zones: implications for global sediment budgets, great earthquakes, and volcanism, Earth Planet. Sc. Lett., 140, 1–12, 1996.
Renne, P. R., Black, M. T., Zichao, Z., Richards, M. A., and Basu, A. R.: Synchrony and Causal Relations Between Permian-Triassic Boundary Crises and Siberian Flood Volcanism, Science, 269, 1413–1416, https://doi.org/10.1126/science.269.5229.1413, 1995.
Ridgwell, A. and Zeebe, R.: The role of the global carbonate cycle in the regulation and evolution of the Earth system, Earth Planet. Sc. Lett., 234, 299–315, https://doi.org/10.1016/j.epsl.2005.03.006, 2005.
Scotese, C. R.: PALAEOMAP PalaeoAtlas for GPlates and the PalaeoData Plotter Program, PALAEOMAP Project, available at: http://www.earthbyte.org/palaeomap-palaeoatlas-for-gplates (last access: 1 November 2016), 2016.
Seton, M., Müller, R., Zahirovic, S., Gaina, C., Torsvik, T., Shephard, G., Talsma, A., Gurnis, M., Turner, M., Maus, S., and Chandler, M.: Global continental and ocean basin reconstructions since 200 Ma, Earth-Sci. Rev., 113, 212–270, 2012.
Sundquist, E. T.: Steady- and non-steady-state carbonate-silicate controls on atmospheric CO2, Quaternary Sci. Rev., 10, 283–296, https://doi.org/10.1016/0277-3791(91)90026-Q, 1991.
Torrence, C. and Compo, G. P.: A practical guide to wavelet analysis, B. Am. Meteorol. Soc., 79, 61–78, 1998.
van der Meer, D. G., Zeebe, R. E., van Hinsbergen, D. J., Sluijs, A., Spakman, W., and Torsvik, T. H.: Plate tectonic controls on atmospheric CO2 levels since the Triassic, P. Natl. Acad. Sci. USA, 111, 4380–4385, 2014.
Wessel, P., Smith, W. H. F., Scharroo, R., Luis, J. F., and Wobbe, F.: GMT 5.2.1., SOEST, Dept. of Geology & Geophysics, Honolulu, Hawaii, available at: http://gmt.soest.hawaii.edu/projects/gmt/wiki/Download (last access: 18 May 2018), 2015.
Wignall, P. and Hallam, A.: Anoxia as a cause of the Permian/Triassic mass extinction: facies evidence from northern Italy and the western United States, Palaeogeogr. Palaeocl., 93, 21–46, 1992.
Winder, S.: Analog and Digital Filter Design, Elsevier Science, 2002.
Zahirovic, S., Matthews, K. J., Flament, N., Müller, R. D., Hill, K. C., Seton, M., and Gurnis, M.: Tectonic evolution and deep mantle structure of the eastern Tethys since the latest Jurassic, Earth-Sci. Rev., 162, 293–337, 2016.