the Creative Commons Attribution 4.0 License.
the Creative Commons Attribution 4.0 License.
 | 02 Jul 2019
Mid-Holocene climate change over China: model–data discrepancy
Yating Lin
Gilles Ramstein
Haibin Wu
Raj Rani
Pascale Braconnot
Masa Kageyama
Qin Li
Yunli Luo
Ran Zhang
Zhengtang Guo
The mid-Holocene period (MH) has long been an ideal target for the validation of general circulation model (GCM) results against reconstructions gathered in global datasets. These studies aim to test GCM sensitivity, mainly to seasonal changes induced by the orbital parameters (longitude of the perihelion). Despite widespread agreement between model results and data on the MH climate, some important differences still exist. There is no consensus on the continental size (the area of the temperature anomaly) of the MH thermal climate response, which makes regional quantitative reconstruction critical to obtain a comprehensive understanding of the MH climate patterns. Here, we compare the annual and seasonal outputs from the most recent Paleoclimate Modelling Intercomparison Project Phase 3 (PMIP3) models with an updated synthesis of climate reconstruction over China, including, for the first time, a seasonal cycle of temperature and precipitation. Our results indicate that the main discrepancies between model and data for the MH climate are the annual and winter mean temperature. A warmer-than-present climate condition is derived from pollen data for both annual mean temperature (∼0.7 K on average) and winter mean temperature (∼1 K on average), while most of the models provide both colder-than-present annual and winter mean temperature and a relatively warmer summer, showing a linear response driven by the seasonal forcing. By conducting simulations in BIOME4 and CESM, we show that surface processes are the key factors creating the uncertainties between models and data. These results pinpoint the crucial importance of including the non-linear responses of the surface water and energy balance to vegetation changes.
- Article
(9327 KB) -
Supplement
(2663 KB) - BibTeX
- EndNote


Much attention from paleoclimate studies has been focused on the current interglacial (the Holocene), especially the mid-Holocene (MH; 6±0.5 ka). The major difference in the experimental configuration between the MH and pre-industrial (PI) arises from the orbital parameters, which brings about an increase in the amplitude of the seasonal cycle of insolation in the Northern Hemisphere and a decrease in the Southern Hemisphere (Berger, 1978). Thus, the MH provides an excellent case study on which to base an evaluation of the climate response to changes in the distribution of insolation. Great efforts have been devoted by the modelling community to designing MH common experiments using similar boundary conditions (Joussaume and Taylor, 1995; Harrison et al., 2002; Braconnot et al., 2007a, b). In addition, much work has been done to reconstruct the paleoclimate change based on different proxies at the global and continental scale (Guiot et al., 1993; Kohfeld and Harrison, 2000; Prentice et al., 2000; Bartlein et al., 2011). The greatest progress in understanding MH climate change and variability has consistently been made by comparing large-scale analyses of data with simulations from global climate models (Joussaume et al., 1999; Liu et al., 2004; Harrison et al., 2014).
However, the source of discrepancies between model results and data is still an open and stimulating question. Two types of inconsistencies have been identified: (1) the model and data showing opposite signs; for instance, paleoclimate evidence from data records indicates an increase of about 0.5 K in global annual mean temperature during the MH compared with PI (Shakun et al.. 2012; Marcott et al., 2013), while there is a cooling trend in model simulations (Liu et al., 2014). (2) The same trend being displayed by both model and data but with different magnitudes. Previous studies have shown that while climate models can successfully reproduce the direction and large-scale patterns of past climate changes, they tend to consistently underestimate the magnitude of change in the monsoons of the Northern Hemisphere as well as the amount of MH precipitation over northern Africa (Braconnot et al., 2012; Harrison et al., 2015). Moreover, significant spatial variability has been noted in both observations and simulations (Peyron et al., 2000; Davis et al., 2003; Braconnot et al., 2007a; Wu et al., 2007; Bartlein et al., 2011). For instance, Marcott et al. (2013) reconstructed a cooling trend of global temperature during the Holocene, mainly from marine records (∼80 %). Based on 642 sub-fossil pollen data points, Marsicek et al. (2018) show that long-term warming defined the Holocene until around 2000 years ago for the European and North American continents. The different trends of pollen- and marine-based reconstructions indicate the spatial variability of annual temperature change during the MH over the globe, which has already been investigated by Bartlein et al. (2010). That makes regional quantitative reconstruction (Davis et al., 2003; Mauri et al., 2015) essential to obtain a comprehensive understanding of the MH climate patterns and to act as a benchmark to evaluate climate models (Fischer and Jungclaus, 2011; Harrison et al., 2014).
China offers two advantages with respect to these issues. The sheer expanse of the country means that the continental response to insolation changes over a large region can be investigated. Moreover, the quantitative reconstruction of seasonal climate changes during the MH, based on the new pollen dataset, provides a unique opportunity to compare the seasonal cycles for models and data. Previous studies indicate that warmer- and wetter-than-present conditions prevailed over China during the MH and that the magnitude of the annual temperature increases varied from 2.4 to 5.8 K spatially, with an annual precipitation increase in the range of 34–267 mm (e.g. Sun et al., 1996; Jiang et al., 2010; Lu et al., 2012; Chen et al., 2015). However, Jiang et al. (2012) clearly show a mismatch between multi-proxy reconstructions and model simulations. In terms of climate anomalies (MH–PI), besides the ∼1 K increase in summer temperature, 35 out of 36 Paleoclimate Modelling Intercomparison Project (PMIP) models reproduce annual (∼0.4 K) and winter temperatures (∼1.4 K) that are colder than the baseline, and a drier-than-baseline climate in some western and middle regions over China is depicted in models (Jiang et al., 2013). Jiang et al. (2012) point out the model–data discrepancy over China during the MH, but the lack of seasonal reconstructions in their study limits comparisons with simulations.
An important issue raised by Liu et al. (2014) is that the discrepancy at the annual level could be due to incorrect reconstructions of the seasonal cycle, a key objective in our paper. Moreover, it has been suggested that the vegetation change can strengthen the temperature response at high latitudes (O'Ishi et al., 2009; Otto et al., 2009), as well as alter the hydrological conditions in the tropics (Z. Liu et al., 2007). However, compared to the substantial land cover changes in the MH derived from pollen datasets (Ni et al., 2010; Yu et al., 2000), the changes in vegetation have not yet been fully quantified and discussed in PMIP3 (Taylor et al., 2012).
In this study, we first present new reconstructions. We use a quantitative biomization method to reconstruct vegetation types during the MH based on a new synthesis of pollen datasets and then use an inverse vegetation model (Guiot et al., 2000; Wu et al., 2007) to obtain the mean annual temperature, the mean temperature of the warmest month (MTWA), the mean temperature of the coldest month (MTCO), the mean annual precipitation, July precipitation and January precipitation over China for the MH. Furthermore, we present a comprehensive evaluation of the PMIP3 simulations performed with state-of-art climate models based on our reconstructions of temperature and precipitation. This is the first time that such progress towards a quantitative seasonal climate comparison for the MH over China has been made. This point is crucial because the MH PMIP3 experiment is essentially one that looks at the response of the models to changes in the seasonality of insolation, and the attempt to derive reconstructions of both summer and winter climate to compare with the simulations will thus enable us to answer the question posed by Liu et al. (2014) on the importance of seasonal reconstructions.
Figure 1Distribution of pollen sites during the mid-Holocene period in China. The black circle is the original China Quaternary Pollen Database, red circles are digitized ones from published papers and green circles represent the three original pollen data points used in this study. The area in green represents the Tibetan Plateau, and yellow represents the Loess Plateau.
2.1 Data
In this study, we collected 159 pollen records covering most of China for the MH period (6000±500 14C yr BP) (Fig. 1). Notably, according to IntCal13 (Reimer et al., 2013), the MH time slice of 6000±500 14C yr BP is about 6800 cal BP (the average value), which is not totally consistent with the “mid-Holocene” used in the CMIP5–PMIP3 experiment (6000 cal BP). But for a better comparison with BIOME6000 (in which the MH is defined as 6000±500 14C yr BP), we decided to choose the pollen data at 6000±500 14C yr BP in our study. In the 159 records, 65 were from the China Quaternary Pollen Database (CQPD, 2000), 3 were original datasets obtained for our study and the others were digitized from pollen diagrams in published papers with a recalculation of pollen percentages based on the total number of terrestrial pollen types. These digitized 91 pollen records were selected according to three criteria: (1) clearly readable pollen diagrams with a reliable chronology and a minimum of three independent age control points since the Last Glacial Maximum (LGM); (2) including the pollen taxa during the 6000±500 14C yr BP period with a minimum sampling resolution of 1000 years per sample; and (3) abandoning the pollen records if the published paper mentions the influence of human activity. For the age control, different dating methods are utilized in the collected pollen records, and we applied CalPal 2007 (Weninger et al., 2007) to correct 14C age into calendar age so that they can be contrasted with each other. For lacustrine records, if the specific carbon pool age is mentioned in the literature, the calendar age is corrected after deducting the carbon pool. Otherwise, the influence of the carbon pool is not considered. The age–depth model for the pollen records was estimated by linear interpolation between adjacent available dates or by regression. Using ranking schemes from the Cooperative Holocene Mapping Project, the quality of dating control for the mid-Holocene was assessed by assigning a rank from 1 to 7; 70 % of the records used in our study fell into the first and second classes (see Table 1 for detailed information) according to the Webb 1–7 standards (Webb III, 1985). Vegetation type was quantitatively reconstructed using biomization (Prentice et al., 1996), following the classification of plant functional types (PFTs) and biome assignment in China by the Members of the China Quaternary Pollen Database (CQPD, 2000), which has been widely tested in surface sediment. The new sites (91 digitized data points and 3 original data points) added to our database improved the spatial coverage of pollen records, especially in the northwest, the Tibetan Plateau, the Loess Plateau and southern regions, where the data in the previous databases are very limited.

Modern monthly mean climate variables investigated in this study, including temperature, precipitation and cloudiness (total cloud fraction), have been collected for each modern pollen site based on the datasets (1951–2001) from 657 meteorological observation stations over China (China Climate Bureau, China Ground Meteorological Record Monthly Report, 1951–2001). The MH soil properties and characteristics used in the inverse vegetation model were kept the same with PI conditions, which are derived from the digital world soil map produced by the Food and Agricultural Organization (FAO, 1995). The atmospheric CO2 concentration for the MH was taken from ice core records (EPICA community members, 2004) and was set at 270 ppmv.
A three-layer back-propagation (BP) artificial neural network (ANN) technique was used for interpolation on each pollen site (Caudill and Butler, 1992). Five input variables (latitude, longitude, elevation, annual precipitation, annual temperature) and one output variable (biome scores) have been chosen in ANN for modern vegetation. The ANN has been calibrated on the training set, and its performance has been evaluated on the verification set (20 %, randomly extracted from the total sets). After a series of training runs, the lowest verification error is obtained with five neurons in the hidden layer after 10 000 iterations. In our study, at each pollen site, we first applied the biomization method to get the biome scores for both the present day and the MH. The anomalies between past (6 ka) and modern vegetation indices (biome scores) were then interpolated to the 0.2×0.2∘ grid resolution by applying the ANN. After that, the modern grid values were added to the values of the grid of paleo-anomalies to provide gridded paleo-biome indices. Finally, the biome with the highest index was attributed to each grid point. This ANN method is more efficient than many other techniques on the condition that the results are validated by independent datasets, and therefore it has been widely applied in paleoclimatology (Guiot et al., 1996; Peyron et al., 1998). The schematic diagram of ANN (Fig. S1) can be found in the Supplement.
2.2 Climate models
PMIP, a long-standing initiative, is a climate model evaluation project which provides an efficient mechanism for using global climate models to simulate climate anomalies for past periods and to understand the role of climate feedbacks. In its third phase (PMIP3; Braconnot et al., 2011), the models were identical to those used in the Climate Modelling Intercomparison Project Phase 5 (CMIP5) experiments. The experimental set-up for the mid-Holocene simulations in PMIP3 followed the PMIP protocol (Taylor et al., 2012; https://wiki.lsce.ipsl.fr/pmip3/doku.php/pmip3:design:6k: final, last access: 20 June 2019). The main forcing difference between the MH and PI in PMIP3 is the change in the orbital configuration. More precisely, the orbital configuration in the MH climate has an increased summer insolation and a decreased winter insolation in the Northern Hemisphere compared to the PI climate (Berger, 1978). In addition, the CH4 concentration is prescribed at 650 ppbv in the MH, while it is set at 760 ppbv in PI (Table 2).
All 13 models (Table 3) from PMIP3 with the MH simulation have been included in our study, including eight atmosphere–ocean (AO) models and five atmosphere–ocean–vegetation (AOV) models. Means for the last 30 years were calculated from the archived time series data on individual model grids for climate variables. Then the near-surface temperature and precipitation flux were bi-linearly interpolated to a uniform 2.5∘ grid in order to compute the bioclimatic variables (e.g. MAT, MAP, MTWM, MTCO, July precipitation) onto a common grid for comparison with the reconstruction results.
2.3 Vegetation model
The vegetation model BIOME4 is a coupled bio-geography and biogeochemistry model developed by Kaplan et al. (2003). Monthly mean temperature, precipitation, sunshine percentage (an inverse measure of cloud area fraction), absolute minimum temperature, atmospheric CO2 concentration and subsidiary information about the soil's physical properties like water retention capacity and percolation rates are the main input variables. It represents 13 plant functional types (PFTs), which have different bioclimatic limits. The PFTs are based on physiological attributes and bioclimatic tolerance limits such as heat, moisture and chilling requirements as well as resistance of plants to cold. These limits determine the areas where the PFTs can grow in a given climate. A viable combination of these PFTs defines a particular biome among 28 potential options. These 28 biomes can be further classified into eight megabiomes (Table S1). BIOME4 has been widely utilized to analyse past, present and potential future vegetation patterns (e.g. Bigelow et al., 2003; Diffenbaugh et al., 2003; Song et al., 2005). In this study, we conducted 13 PI and associated MH biome simulations using PMIP3 climate fields (temperature, precipitation and sunshine) as inputs. The climate fields, obtained from PMIP3, are the monthly mean data of the last 30 model years.
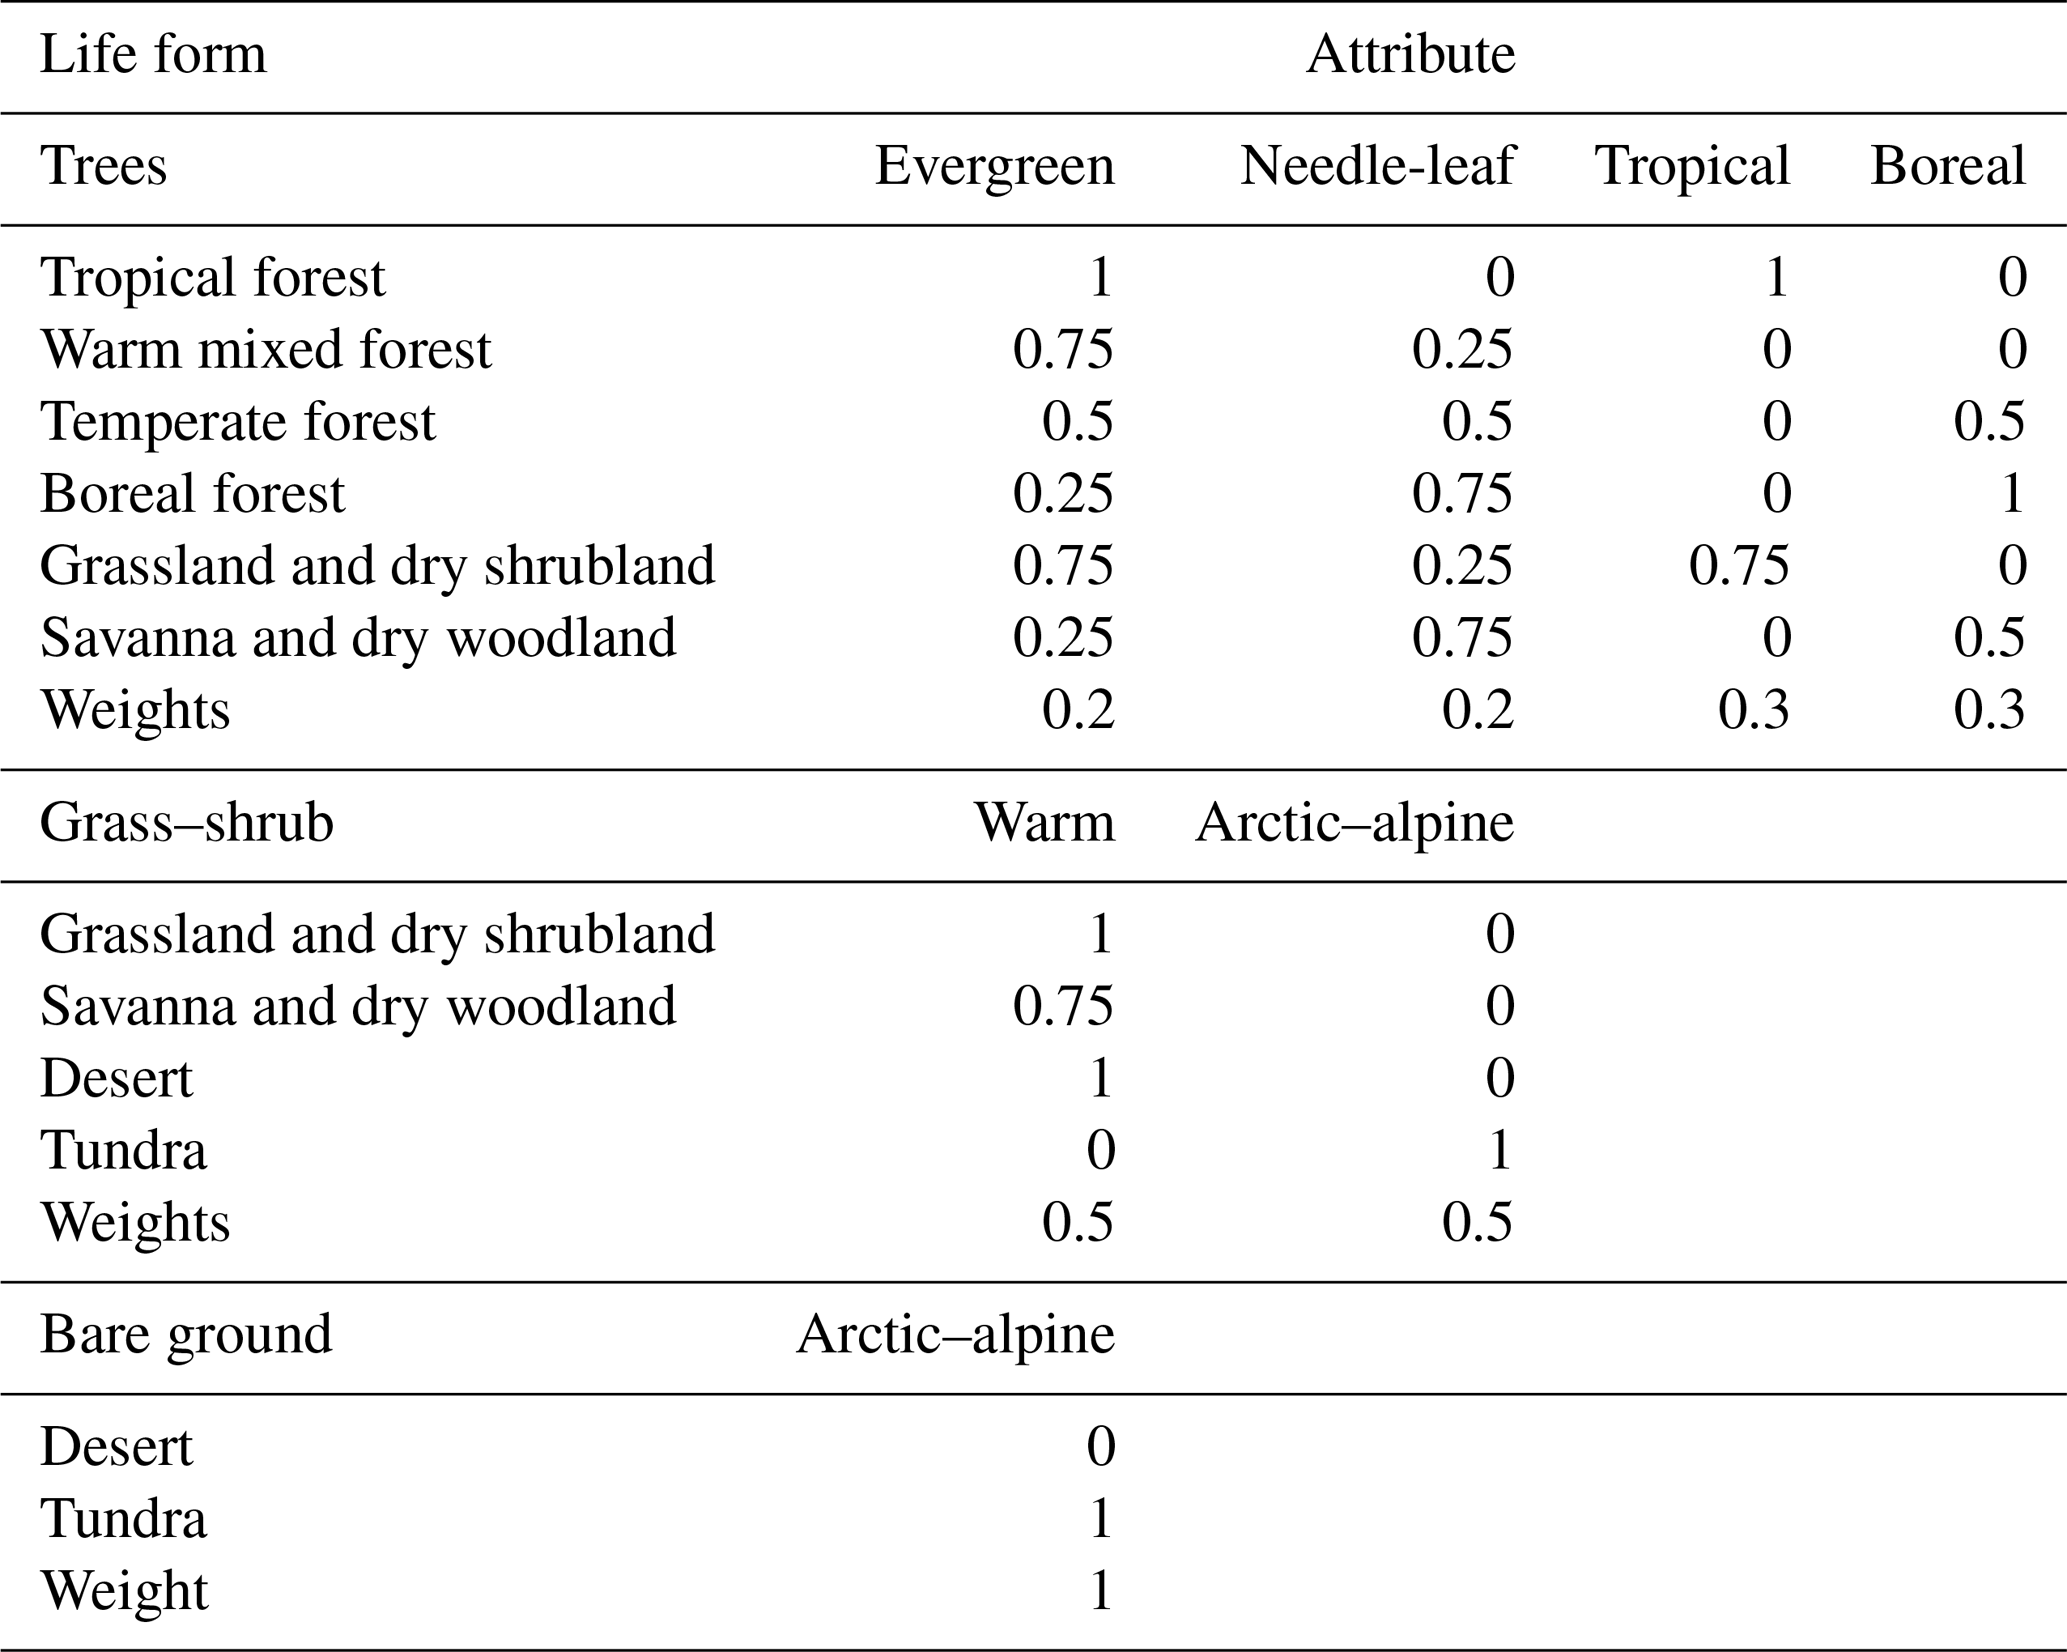
Table 4Important values for each plant life form used in the ΔV statistical calculation as assigned to the megabiomes.
Table 5Attribute values and the weights for plant life forms used by the ΔV statistic.
2.4 Statistics and interpolation for vegetation distribution
To quantify the differences between simulated (based on BIOME4 forced by the climate model output) and reconstructed (from pollen) megabiomes, a map-based statistic (point-to-point comparison with observations) called ΔV (Sykes et al., 1999; Ni et al., 2000) was applied to our study. ΔV is based on the relative abundance of different plant life forms (e.g. trees, grass, bare ground) and a series of attributes (e. g. evergreen, needle-leaf, tropical, boreal) for each vegetation class. The definitions and attributes of each plant form follow naturally from the BIOME4 structure, and the vegetation attribute values in the ΔV computation were defined for BIOME4 in the same way as for BIOME1 (Sykes et al., 1999). The abundance and attribute values are given in Tables 4 and 5, which describe the typical floristic composition of the biomes. Weighting the attributes is subjective because there is no obvious theoretical basis for assigning relative significance. Transitions between highly dissimilar megabiomes have a weighting of close to 1, whereas transitions between less dissimilar megabiomes are assigned smaller values. The overall dissimilarity between model and data megabiome maps was calculated by averaging ΔV for the grids with pollen data, while the value was set at 0 for any grid without data. ΔV values <0.15 can be considered to point to very good agreement between simulated and actual distributions; 0.15–0.30 is good, 0.30–0.45 is fair, 0.45–0.60 is poor and >0.80 is very poor (adjusted from Zhang et al., 2010).
2.5 Inverse vegetation model
The inverse vegetation model (Guiot et al., 2000; Wu et al., 2007), highly dependent on the BIOME4 model, is applied to our reconstruction. The key concept of this model can be summarized in two points: firstly, a set of transfer functions able to transform the model output into values directly comparable with pollen data is defined. There is no full compatibility between the biome typology of BIOME4 and the biome typology of pollen data. A transfer matrix (Table S2) was defined in our study whereby each BIOME4 vegetation type is assigned a vector of values, one for each pollen vegetation type, ranging from 0 (representing an incompatibility between the BIOME4 type and pollen biome type) to 15 (corresponding to maximum compatibility). Secondly, using an iterative approach, a representative set of climate scenarios compatible with the vegetation records is identified within the climate space, constructed by systematically perturbing the input variables (e.g. ΔT, ΔP) of the model (Table S3).
Table 6Regression coefficients between the reconstructed climates by inverse vegetation models and observed meteorological values.
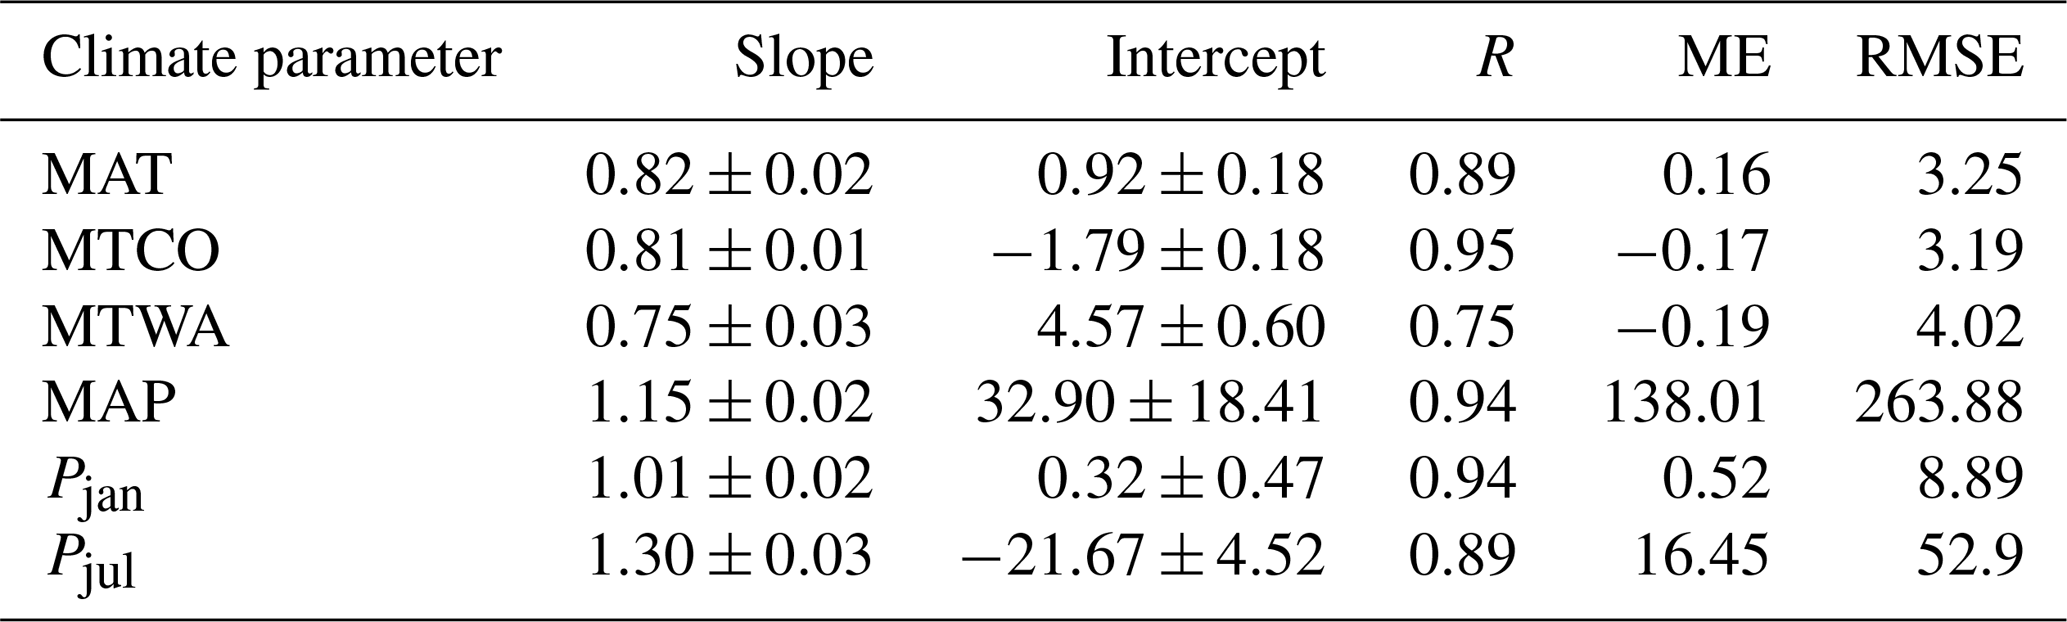
The climatic parameters used for regression are the actual values (data source: China Climate Bureau, China Ground Meteorological Record Monthly Report, 1951–2001). MAT is the annual mean temperature, MTCO is the mean temperature of the coldest month, MTWA is the mean temperature of the warmest month, MAP is the annual precipitation, RMSE is the root mean square error of the residuals and ME is the mean error of the residuals. Pjan: precipitation for January; Pjul: precipitation for July.R is the correlation coefficient ± standard error.
The inverse vegetation model (IVM) provides a possibility, for the first time, to reconstruct both annual and seasonal climates for the MH over China. Moreover, it offers a way to consider the impact of CO2 concentration on competition between PFTs as well as on the relative abundance of taxa and thus makes reconstructions from pollen records more reliable. More detailed information about the IVM can be found in Wu et al. (2007).
We applied the inverse model to modern pollen samples to validate the approach by reconstructing the modern climate at each site and comparing it with the observed values. The high correlation coefficients (R=0.75–0.95), with intercepts close to 0 (except for the mean temperature of the warmest month) and slopes close to 1 (except for the July precipitation), demonstrated that the inversion method worked well for most variables in China (see Table 6).
2.6 Sensitivity test for vegetation feedback
To quantify the vegetation feedback on climate change during the mid-Holocene over China, we performed a sensitivity test using CESM version 1.0.5. This version, developed at the National Center for Atmospheric Research, is a widely used coupled model with dynamic atmosphere (CAM4), land (CLM4), ocean (POP2) and sea-ice (CICE4) components (Gent et al., 2011). Here, we use ∼ 2∘ resolution for CAM4 (∼ 1.9∘ for latitude ×2.5∘ for longitude) in the horizontal direction and 26 layers in the vertical direction. The POP2 adopts a finer grid, with a nominal 1∘ horizontal resolution and 60 layers in the vertical direction. The land and sea-ice components have the same horizontal grids as the atmosphere and ocean components, respectively.
Two experiments were conducted, including a mid-Holocene (MH) experiment (6 ka) with the original vegetation setting (prescribed as PI vegetation for the MH) and an MH experiment with reconstructed vegetation (6 ka_VEG). In detail, experiment 6 ka used the MH orbital parameters (eccentricity: 0.018682; obliquity: 24.105∘; longitude of the perihelion: 0.87∘) and modern vegetation (Salzmann et al., 2008). Compared to experiment 6 ka, experiment 6 ka_VEG used our reconstructed vegetation in China. Except for the changed vegetation, all other boundary conditions were kept unchanged in these two experiments, including the solar constant (1365 W m−2), modern topography and ice sheet, and pre-industrial greenhouse gases (CO2=280 ppmv; CH4=760 ppbv; N2O=270 ppbv). Experiment 6 ka was initiated from the default pre-industrial simulation and run for 500 model years. Experiment 6 ka_VEG was initiated from model year 301 of experiment 6 ka and run for another 200 model years. We analysed the computed climatological means of the last 50 model years from each experiment here.
3.1 Comparison of annual and seasonal climate changes at the MH
In this study, we collected 159 pollen records, broadly covering the whole of China (Fig. 1). To check the reliability of the collected data, we first categorized our pollen records into megabiomes in line with the standard tables developed for BIOME6000 (Table S1) and compared them with the BIOME6000 dataset (Fig. 2). The match between the collected data and BIOME6000 is more than 90 % (145 out of 159 sites) for both the MH and PI.
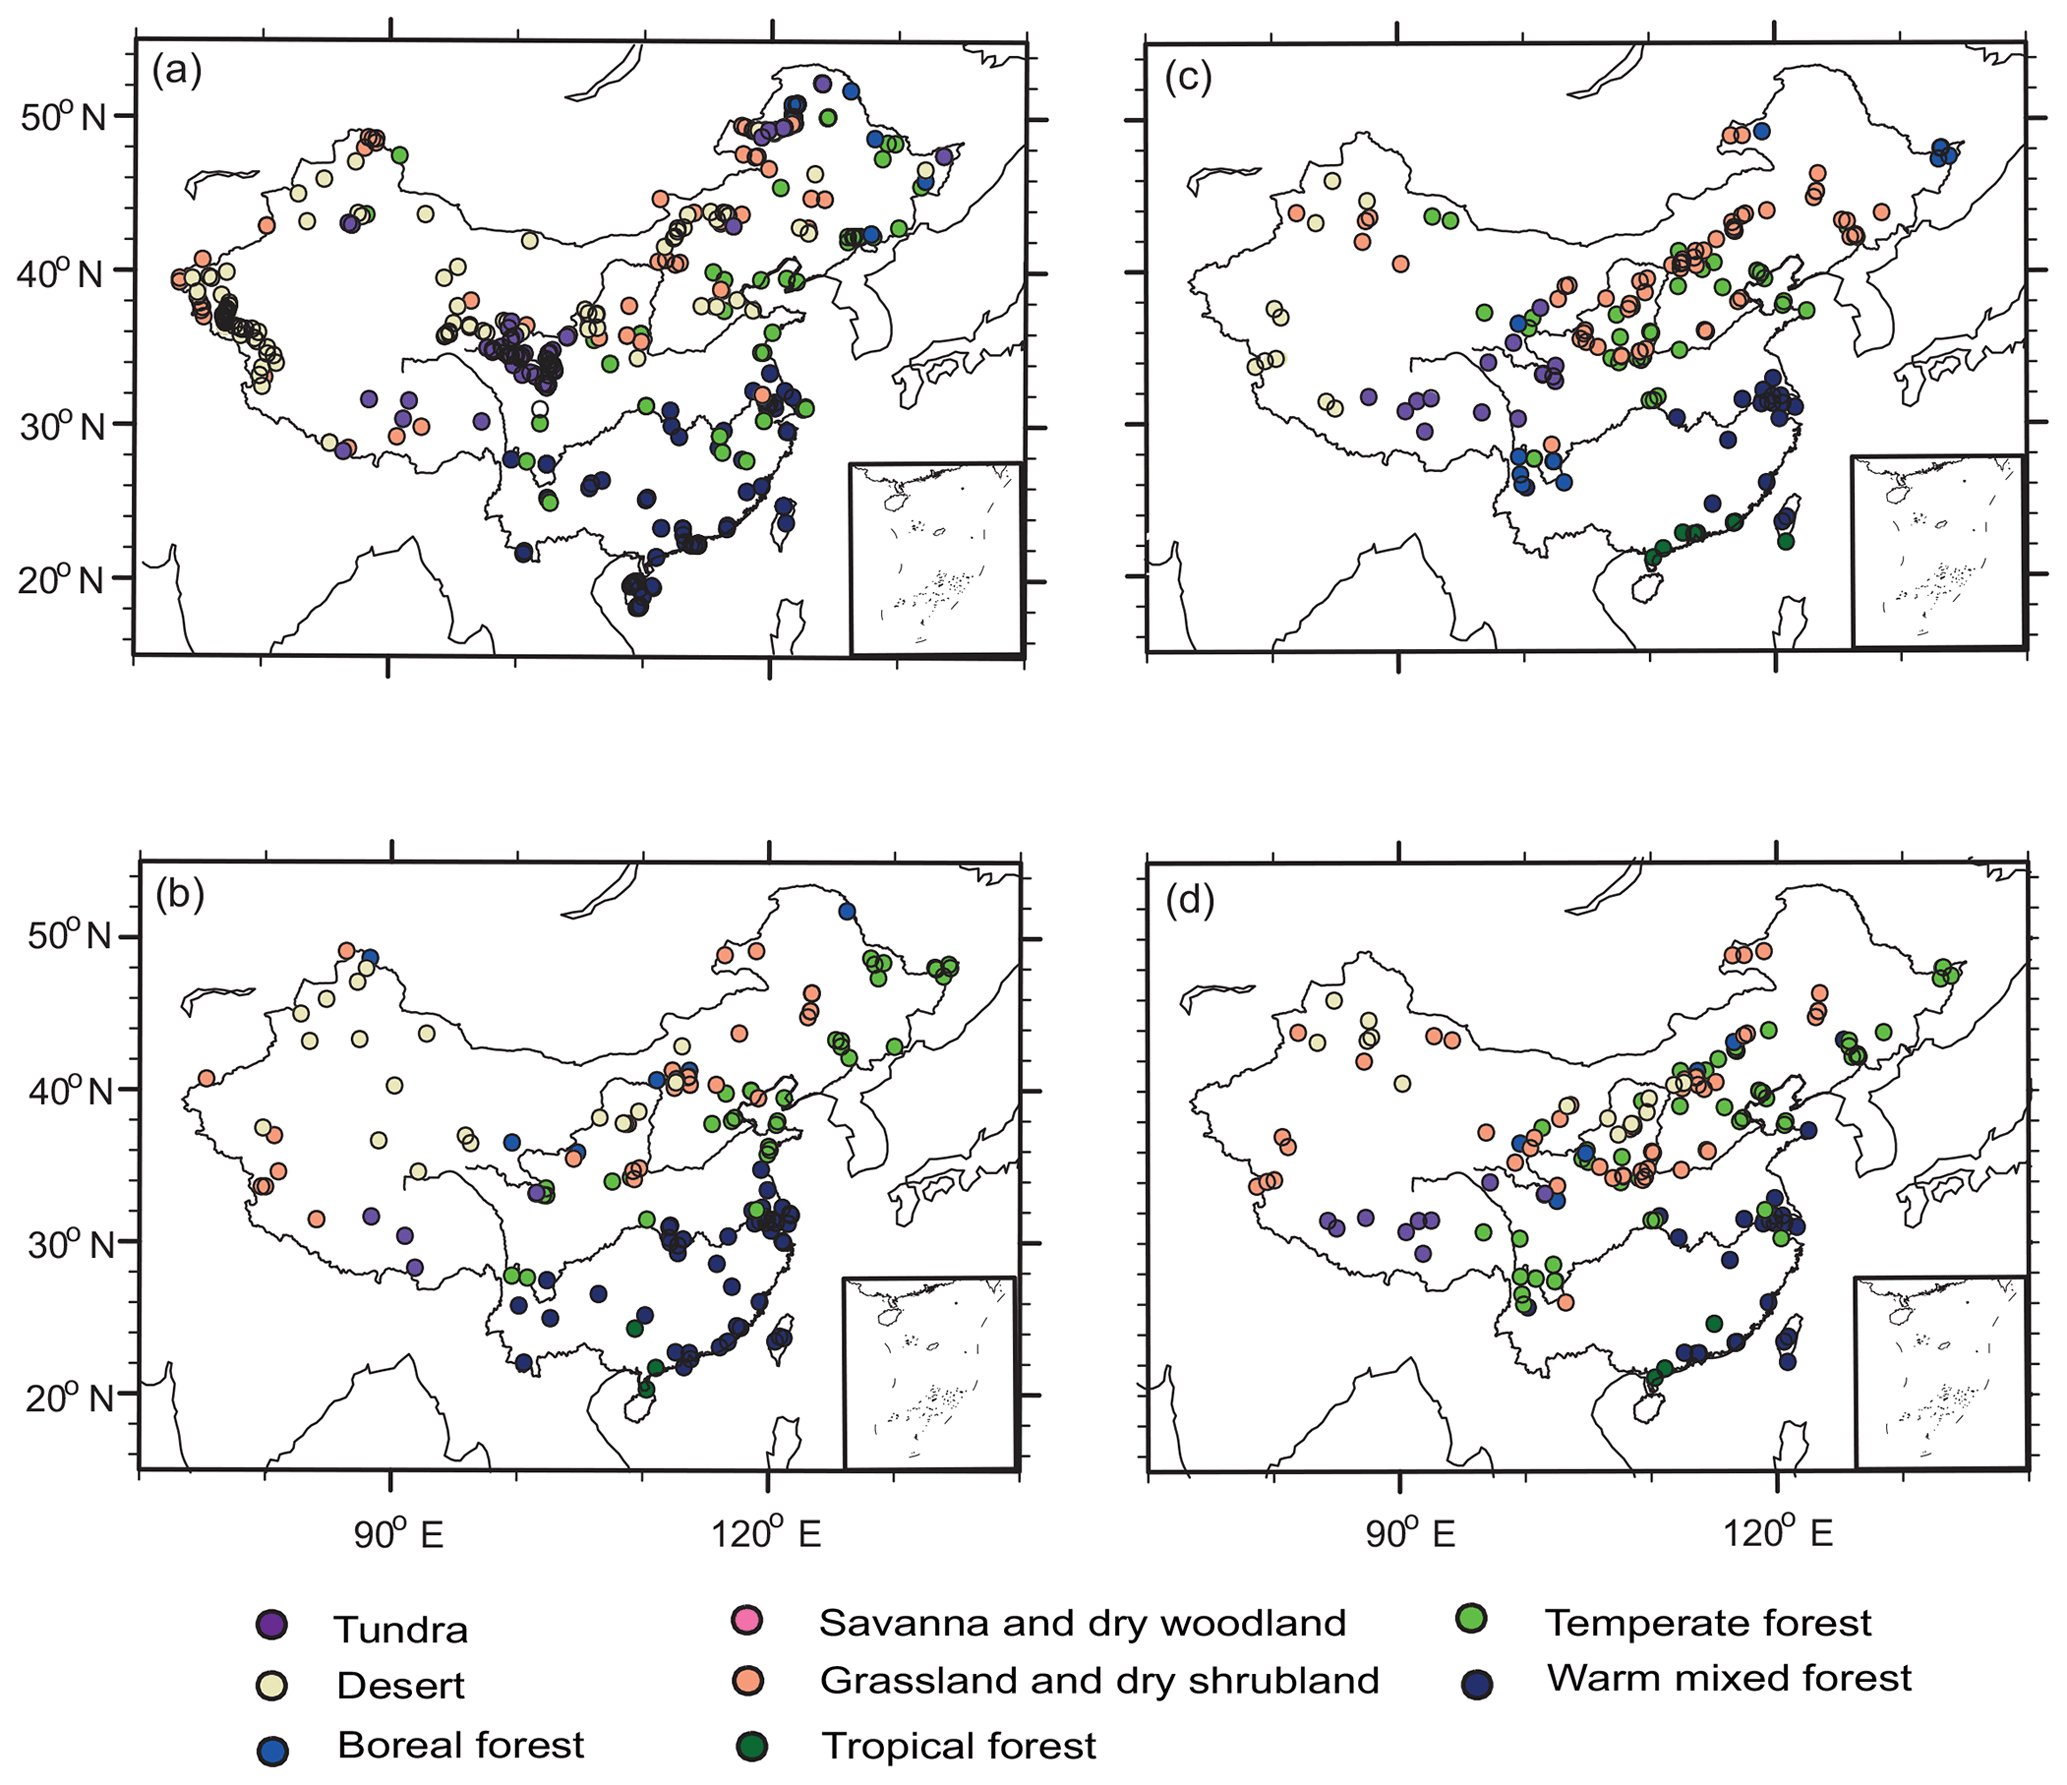
Figure 2Comparison of megabiomes for PI (a, c) and the MH (b, d): (a, b) BIOME6000 and (c, d) pollen data collected in this study.
Based on pollen records, the spatial pattern of climate changes over China during the MH, deduced from IVM, are presented in Fig. 3a–c (points), alongside the results from PMIP3 models (shaded in Fig. 3). For temperature, a warmer-than-present annual climate condition (∼0.7 K on average) is derived from pollen data (the points in Fig. 3a), with the largest increase occurring in the northeast (3–5 K) and a decrease in the northwest and on Tibetan Plateau. On the other hand, the results from a multi-model ensemble (MME) indicate a generally colder annual temperature ( K on average), with significant cooling in the south and slight warming in the northeast (shaded in Fig. 3a). Of the 13 models, 11 simulate a cooler annual temperature compared with PI than MME. However, two models (HadeGEM2-ES and CNRM-CM5) present the same warmer condition as was found in the reconstruction (Fig. 3d). Compared to the reconstruction, the annual mean temperature during the MH is largely underestimated by most PMIP3 models, which depict an anomaly ranging from 1 to ∼0.5 K. Concerning seasonal change, during the MH, MTWA from the data is ∼0.5 K higher than PI, with the largest increase in the northeast and a decrease in the northwest. From model outputs, an average increase of ∼1.2 K is reproduced by MME, with more pronounced warming at high latitudes, which is consistent with the insolation change (Berger, 1978). Figure 3e shows that all 13 models reproduce the same warmer summer temperatures as the data and that HadGEM2-ES and CNRM-CM5 reproduce the largest increases among the models. Although models simulate warmer MTWA, which is consistent with reconstructions, there is a discrepancy between them on MTCO. In Fig. 3c, the data show an overall increase of ∼1 K, with the largest increase occurring in the northeast and a decrease of opposite magnitude on the Tibetan Plateau. Inversely, MME reproduces a decreased MTCO with an average amplitude of K, the areas with strongest cooling being the southeast, the Loess Plateau and the northwest. Similarly to the MME, all 13 models simulate a colder-than-present climate with amplitudes ranging from K (CCSM4 and FGOALS-g2) to K (HadGEM2-ES and CNRM-CM5).
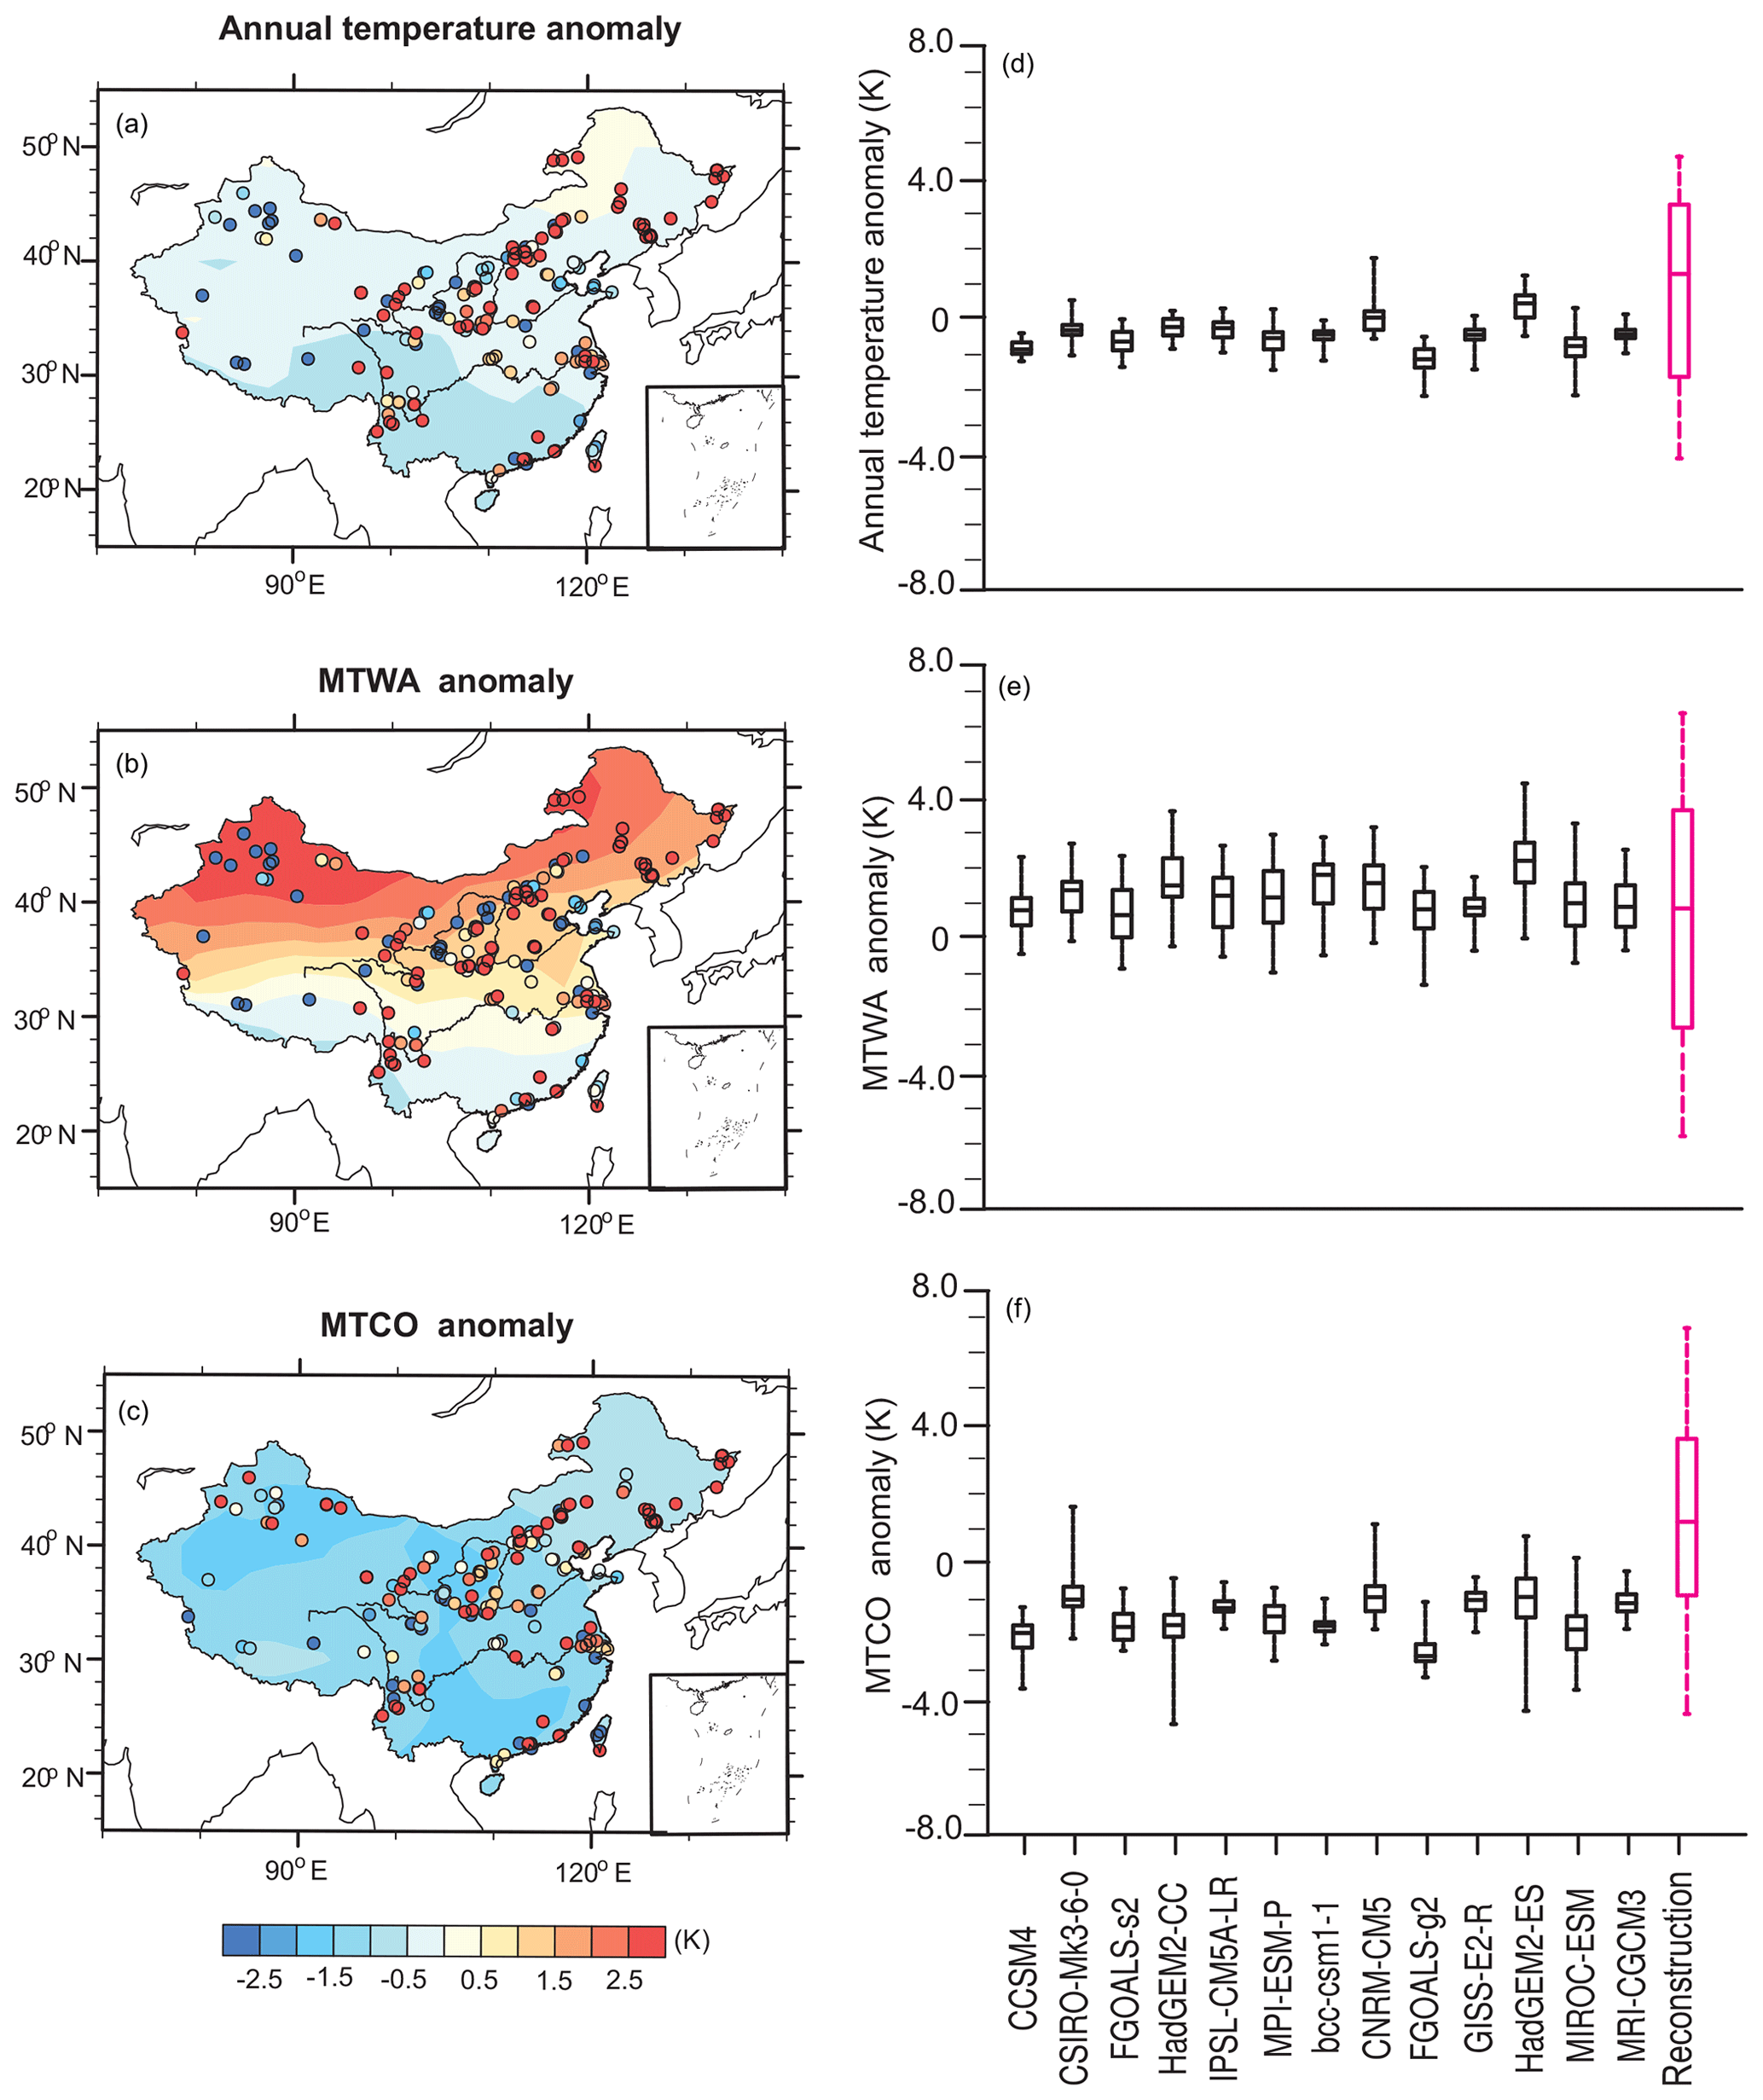
Figure 3Model–data comparison for annual and seasonal (MTWA and MTCO) temperature (K). For (a–c), points represent the reconstruction from IVM, and shading shows the last 30-year mean simulation results of a multi-model ensemble (MME) for 13 PMIP3 models. The box-and-whisker plots (d–f) show the changes as indicated by each PMIP3 model and the reconstruction. (d) Changes in annual temperature, (e) changes in MTWA and (f) changes in MTCO. The lines in each box show the median value from each set of measurements, the box shows the 25 %–75 % range and the whiskers show the 90 % interval (5th to 95th percentile).
Concerning the annual change in precipitation, the reconstruction shows wetter conditions during the MH across almost the whole of China with the exception of part of the northwest. The southeast presents the largest increase in annual precipitation. All but two models (MIROC-ESM and FGOALS-g2) depict wetter conditions with an amplitude of ∼10 to ∼50 mm. The reconstruction and MME results also indicate an increased annual precipitation during the MH (Fig. 4a), with a much larger magnitude visible in the reconstruction (∼30 mm and ∼230 mm, respectively). The main discrepancy in annual precipitation between simulations and reconstruction occurs in the northeast, which is depicted as drier by the models and wetter by the data. With regard to seasonal change, the reconstruction shows an overall increase in July rainfall (∼50 mm on average), with a decrease in the northwestern regions and East Asian monsoon region in the Yangtze River valley. In line with the reconstruction, the MME also shows an overall increase in rainfall (∼7 mm on average), with a decrease in the northwest for July (Fig. 4b). Notably, a much larger increase is simulated for the south and the Tibetan Plateau by the models, while the opposite pattern emerges along the eastern margin from both models and data. For January precipitation, the reconstruction shows an overall increase in most regions (∼15 mm), except for the northwestern region, while MME indicates a slight decrease (∼3 mm on average). More detailed information about the geographic distribution of simulated temperature and precipitation for each model can be found in Figs. S2–S7.
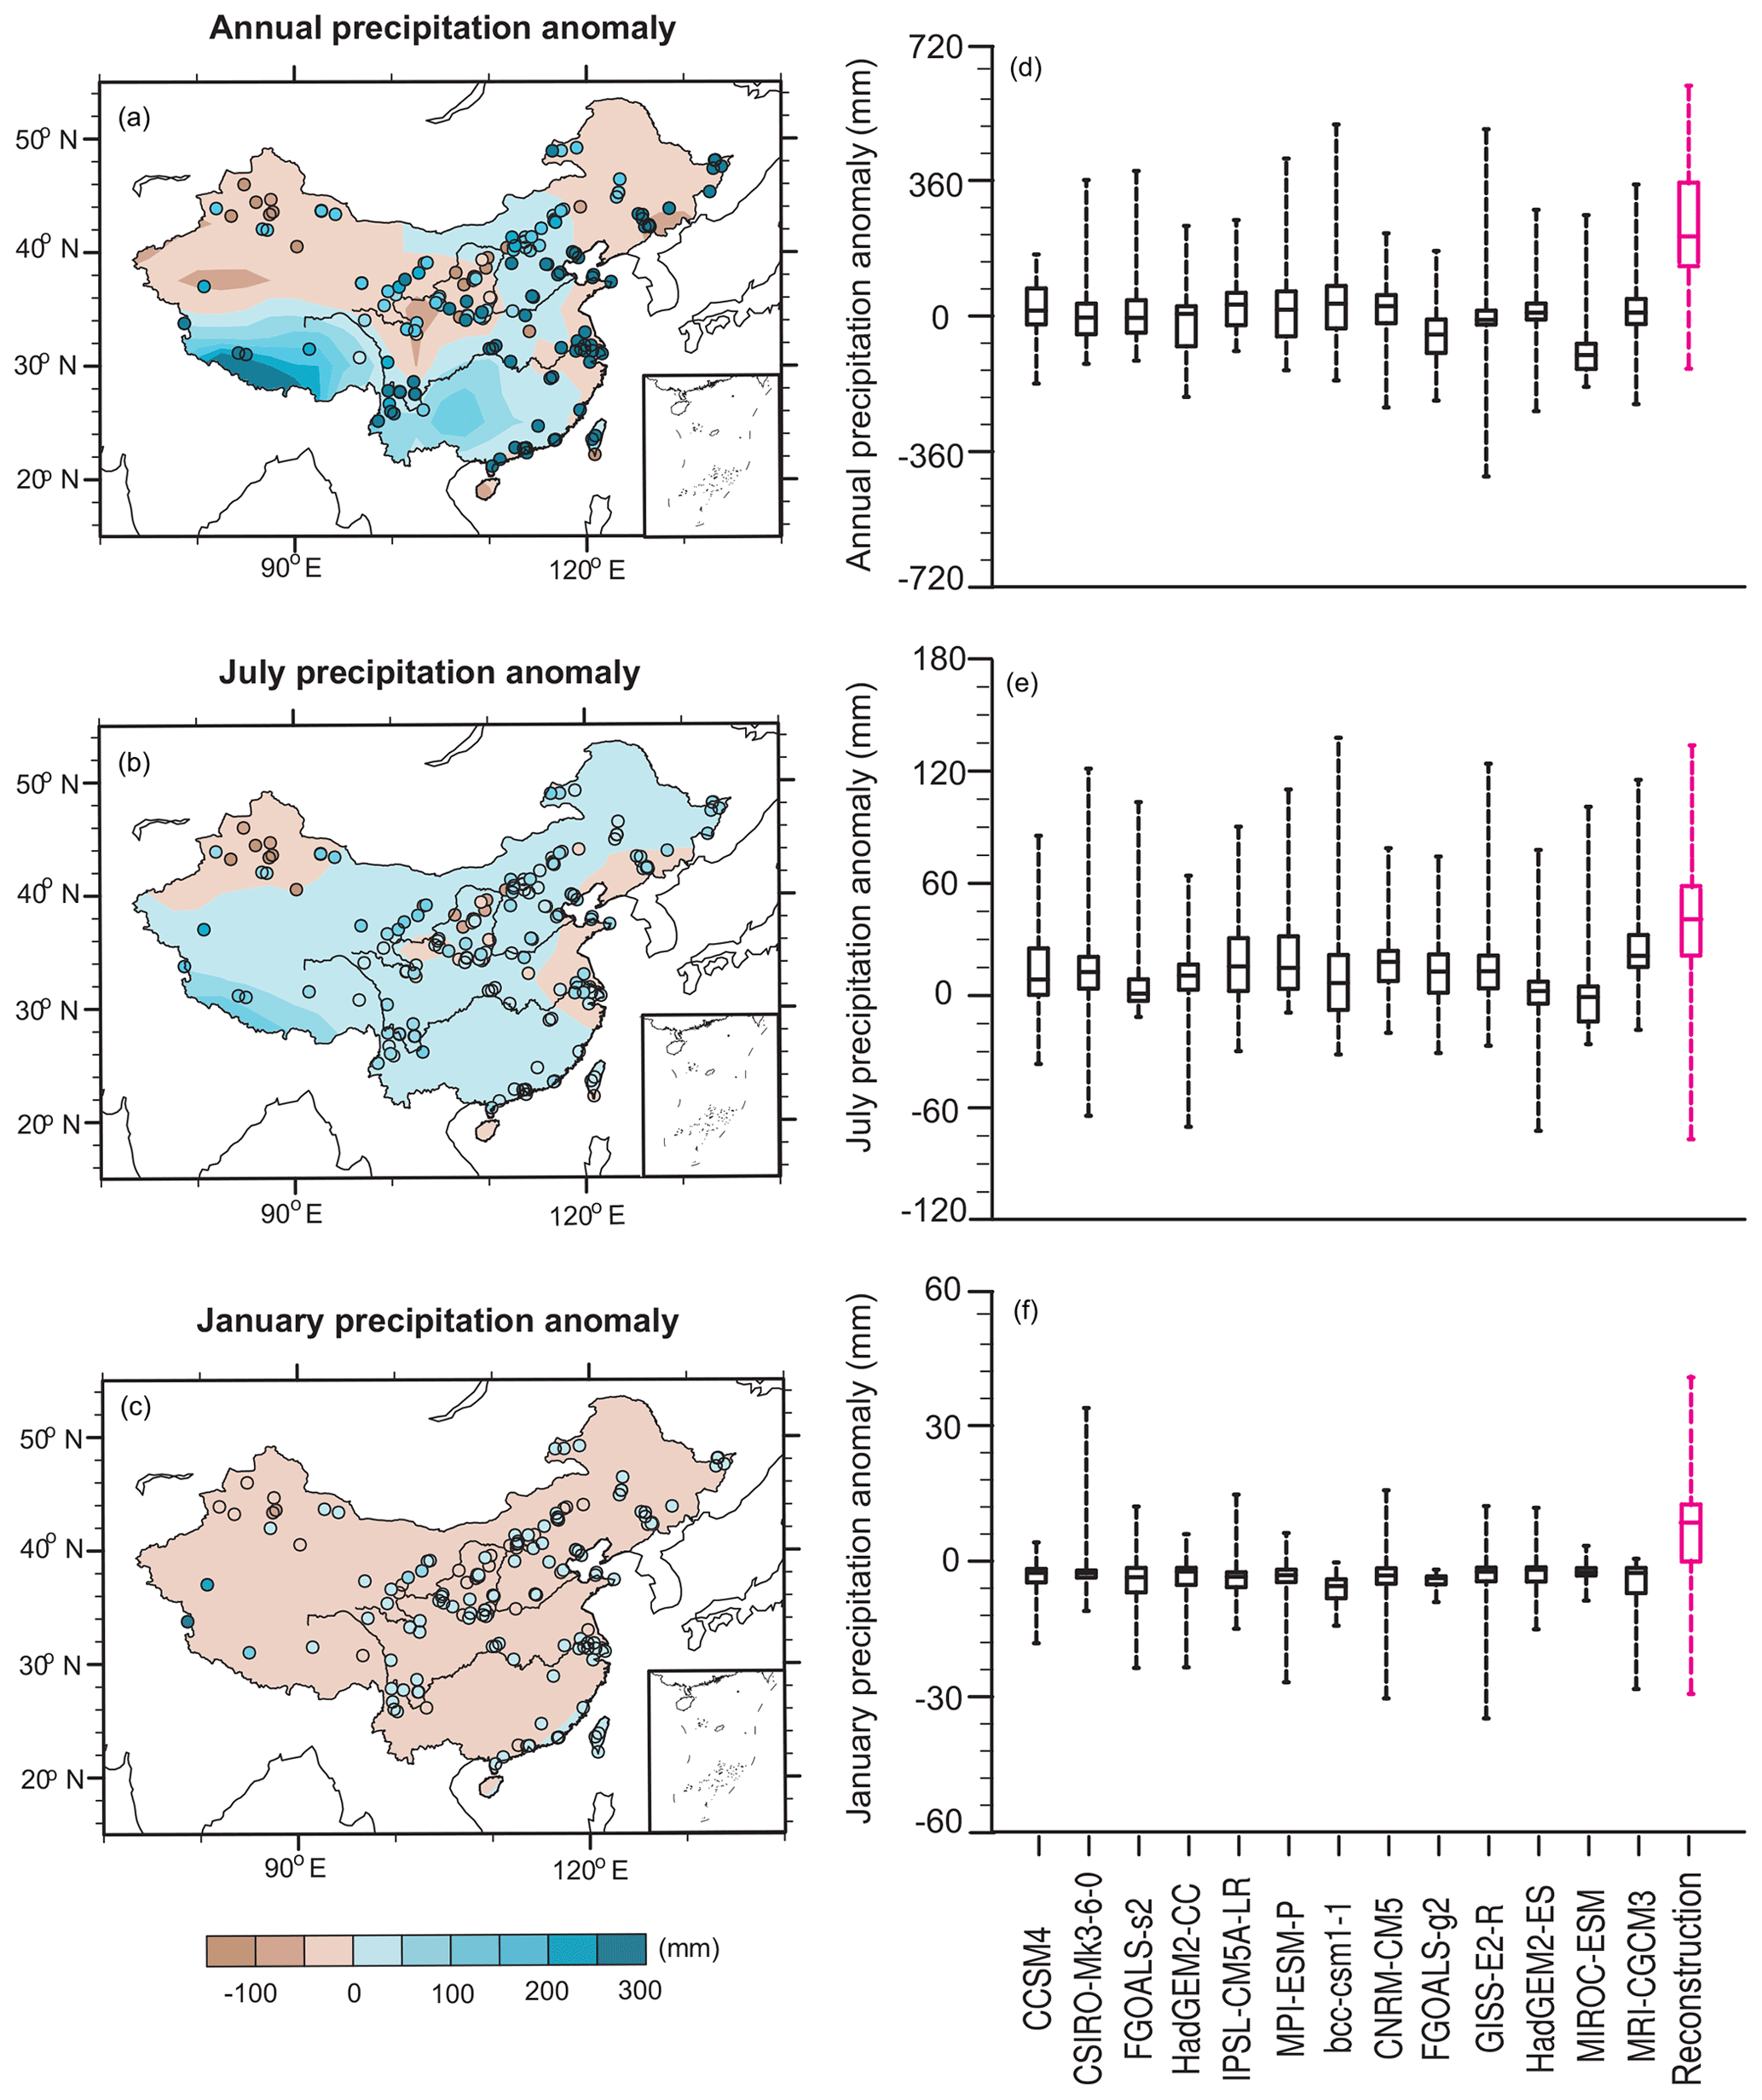
Figure 4Model–data comparison for annual, July and January precipitation (mm). For (a, b), points represent the reconstruction from IVM, and shading shows the last 30-year mean simulation results of a multi-model ensemble (MME) for 13 PMIP3 models. The box-and-whisker plots (d–f) show the changes as indicated by each PMIP3 model and the reconstruction. (d) Changes in annual precipitation, (e) changes in July precipitation and (f) changes in January precipitation. The lines in each box show the median value from each set of measurements, the box shows the 25 %–75 % range and the whiskers show the 90 % interval (5th to 95th percentile).
Table S4 provides the biome scores from IVM for pollen data collected from published papers. The reconstructed climate change derived from IVM at each pollen site can be found in Table S5, in which the columns show the median and the 90 % interval (5th to 95th percentage) for feasible climate values produced with the IVM approach. The simulated values for each of the climate variables as shown in the box plots (Figs. 3 and 4) are given in Tables S6 and S7. All the values mentioned above are the mean of the values at 159 pollen sites.
3.2 Comparison of vegetation change at the MH
The use of the PMIP3 database is clearly limited by the different vegetation inputs among the models for the MH period (Table S8). Only HadGEM2-ES and HadGEM2-CC use dynamic vegetation for the MH, and the vegetation of the other 11 models is prescribed to PI with or without interactive leaf area index (LAI), which can introduce a bias to the role of vegetation–atmosphere interaction in the MH climates. To evaluate the model results against the reconstruction for the MH vegetation, we conducted 13 biome simulations with BIOME4 using the PMIP3 climate fields, and the megabiome distribution for each model during the MH is displayed in Fig. 5 (see Fig. S8 for a comparison of PI biomes). To quantify the model–data dissimilarity between megabiomes, a map-based statistic called ΔV (Sykes et al., 1999; Ni et al., 2000) was applied here (see Sect. 2.4).
Figure S9 shows the dissimilarity between simulations and observations for megabiomes during the MH, with the overall values for ΔV ranging from 0.43 (HadGEM2-ES) to 0.55 (IPSL-CM5A-LR). According to the classification of ΔV (see Sect. 2.4) for the 13 models, 12 (all except HadGEM2-ES) showed poor agreement with the observed vegetation distribution. Most models poorly simulate the desert, grassland and tropical forest areas for both periods but perform better for warm mixed forest, tundra and temperate forest. However, this statistic is based on a point-to-point comparison, so the ΔV calculated here cannot represent an estimation of full vegetation simulation due to the uneven distribution of pollen data and the potentially huge difference in the area of each megabiome. For instance, tundra in our data for PI is represented by only 4 points, which counts for a small contribution to ΔV since we averaged it over a total of 159 points, but this calculation could induce a significant bias if these 4 points are representative of a large area of China.
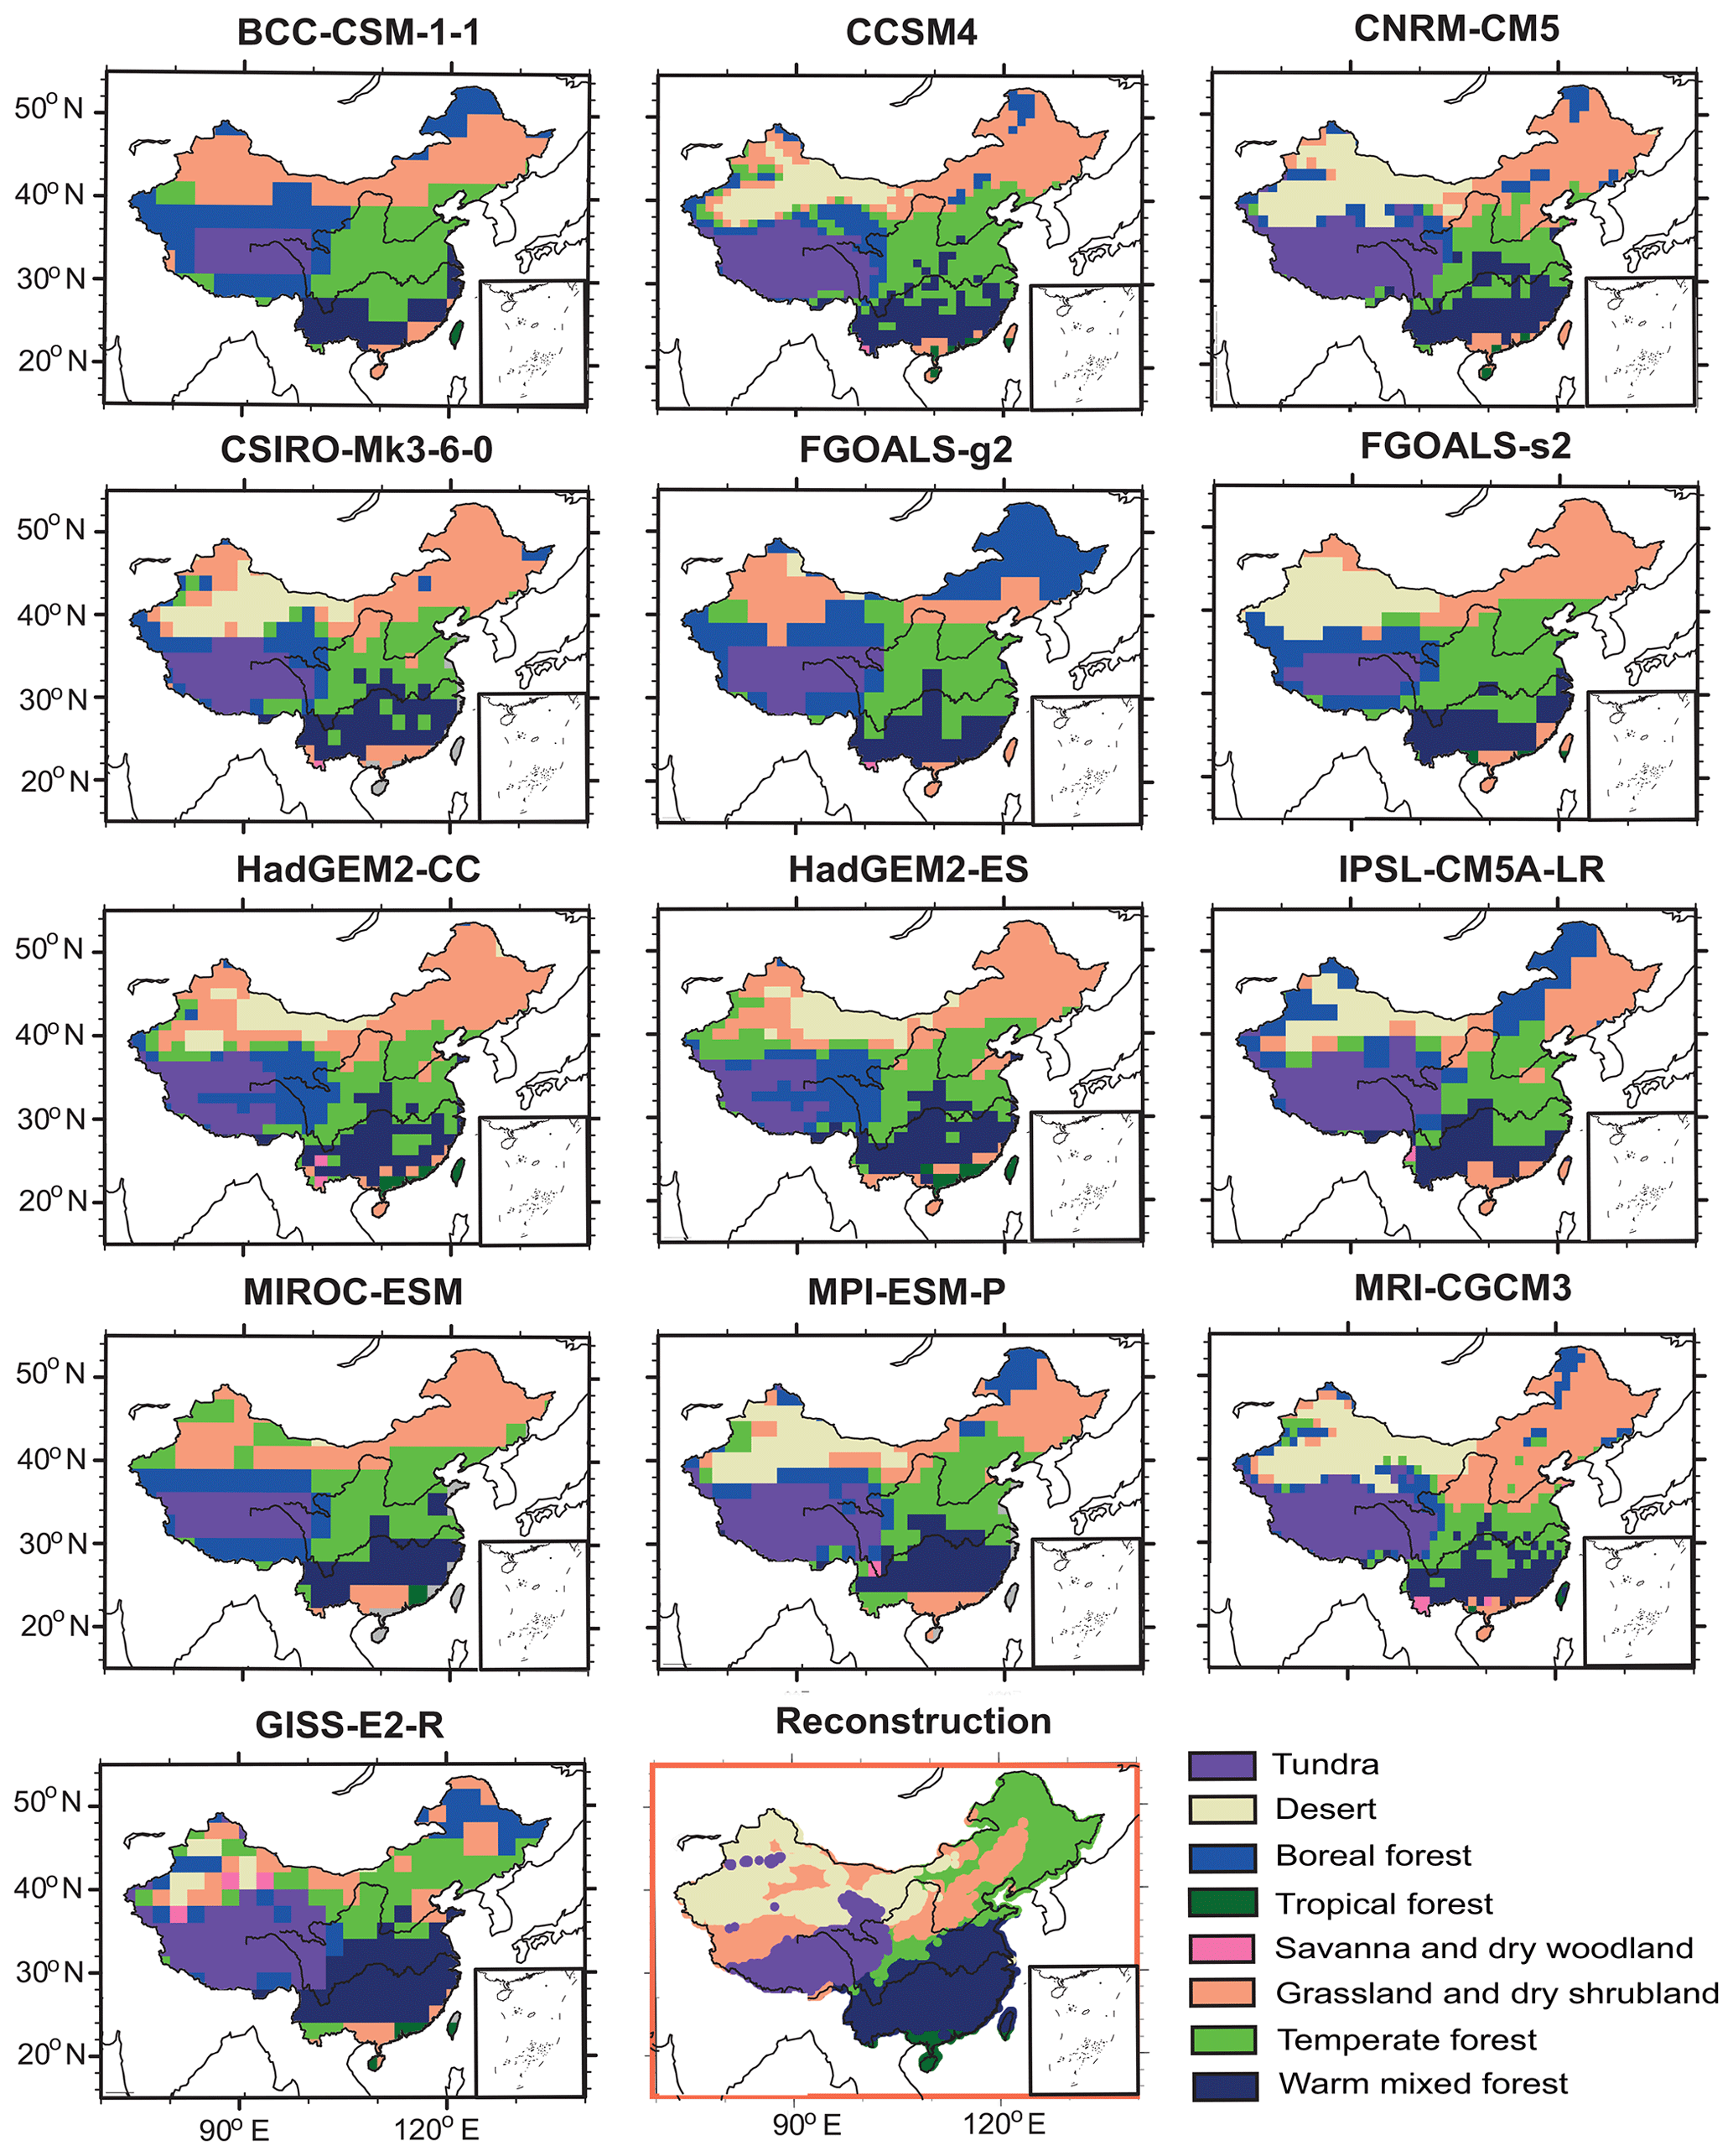
Figure 5Comparison of interpolated megabiome distributions (plot in the red rectangle) with the simulated spatial pattern from BIOME4 for each model during the mid-Holocene.
So, we used the biome scores based on the artificial neural network technique as described by Guiot et al. (1996) for interpolation (the plots in the red rectangle in Fig. 5) and compared the simulated vegetation distribution from BIOME4 for each model with the interpolated pattern. During the MH, most models are able to capture the tundra on the Tibetan Plateau as well as the combination of warm mixed forest and temperate forest in the southeast. However, all models fail to simulate or underestimate the desert area in the northwest compared to reconstructed data. The main model–data inconsistency in the MH vegetation distribution occurs in the northeast, where data show a mix of grassland and temperate forest, and the models show a mix of grassland and boreal forest.
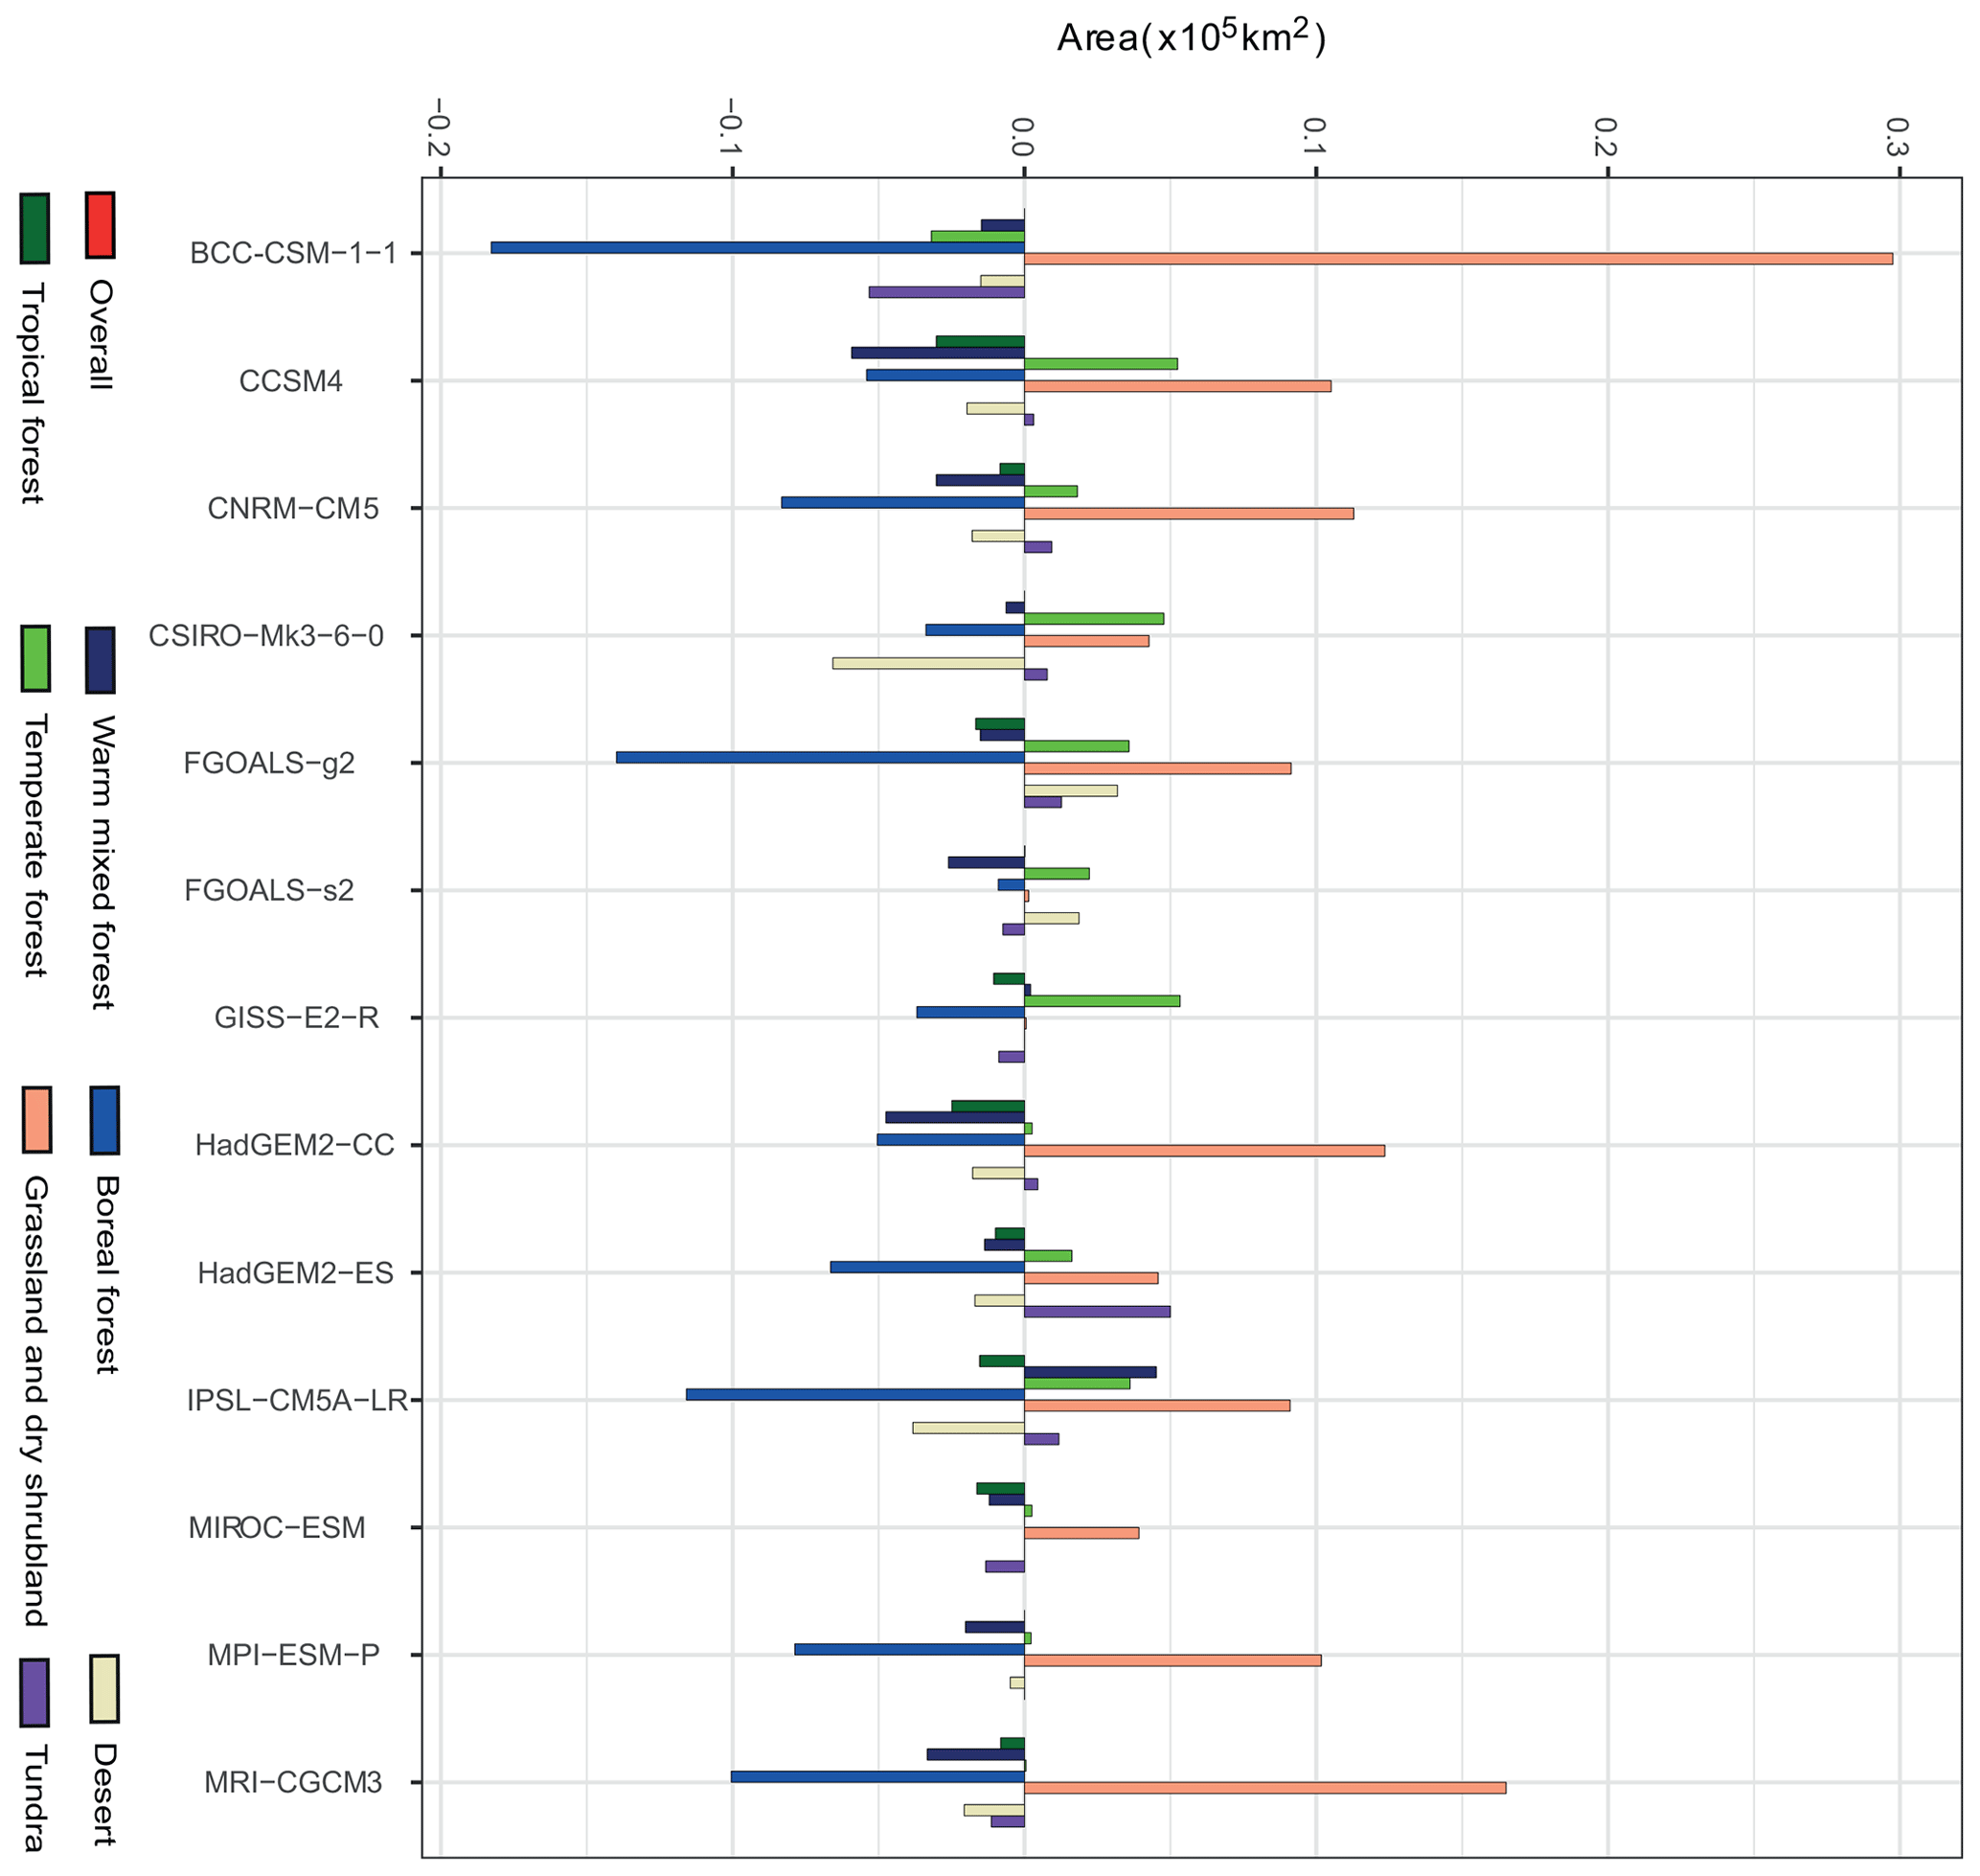
Figure 6Changes in the extent of each megabiome as a consequence of simulated climate changes for each model, both expressed as change relative to the PI extent of the same megabiome.
The area statistics carried out for simulated vegetation changes (Fig. 6) reveal that the main difference during the MH, compared with PI, is that grassland replaced boreal forest in large tracts of the northeast (Figs. 5, S8). No other significant difference in vegetation distribution between the two periods was derived from the models. Unlike in the models, three main changes in megabiomes during the MH are depicted by the data. Firstly, the megabiomes were converted from grassland to temperate forest in the northeast. Secondly, a large area of temperate forest was replaced in the southeast by a northward expansion of warm mixed forest. Thirdly, in the northwest and at the northern margin of the Tibetan Plateau, part of the desert area changed into grassland. However, none of the models succeed in capturing these features, especially the transition from grassland into forest in the northeast during the MH. Therefore, this failure to capture vegetation changes between the two periods will lead to a cumulating inconsistency in the model–data comparison for climate anomalies if this computed vegetation was used as a boundary condition in MH climate simulations.
4.1 Validation and uncertainties of the reconstructions
To investigate the discrepancy between models and reconstructions for the MH climate change over China, the reliability of our reconstruction should first be considered. We therefore compared our reconstruction with previous studies concerning the MH climate change over China based on multiple proxies (including pollen, lake core, paleosol, ice core, peat and stalagmite); the related references and detailed information are listed in the Supplement (Tables S9 and S10). In comparison with PI conditions, most reconstructions reproduced warmer and wetter annual conditions during the MH (Fig. 7), as in our study. In other words, this model–data discrepancy for climate change over China during the MH is common and robust with respect to reconstructions derived from different proxies. Our study reinforces the picture given by the discrepancies between PMIP simulations and pollen data based on a synthesis of the literature.
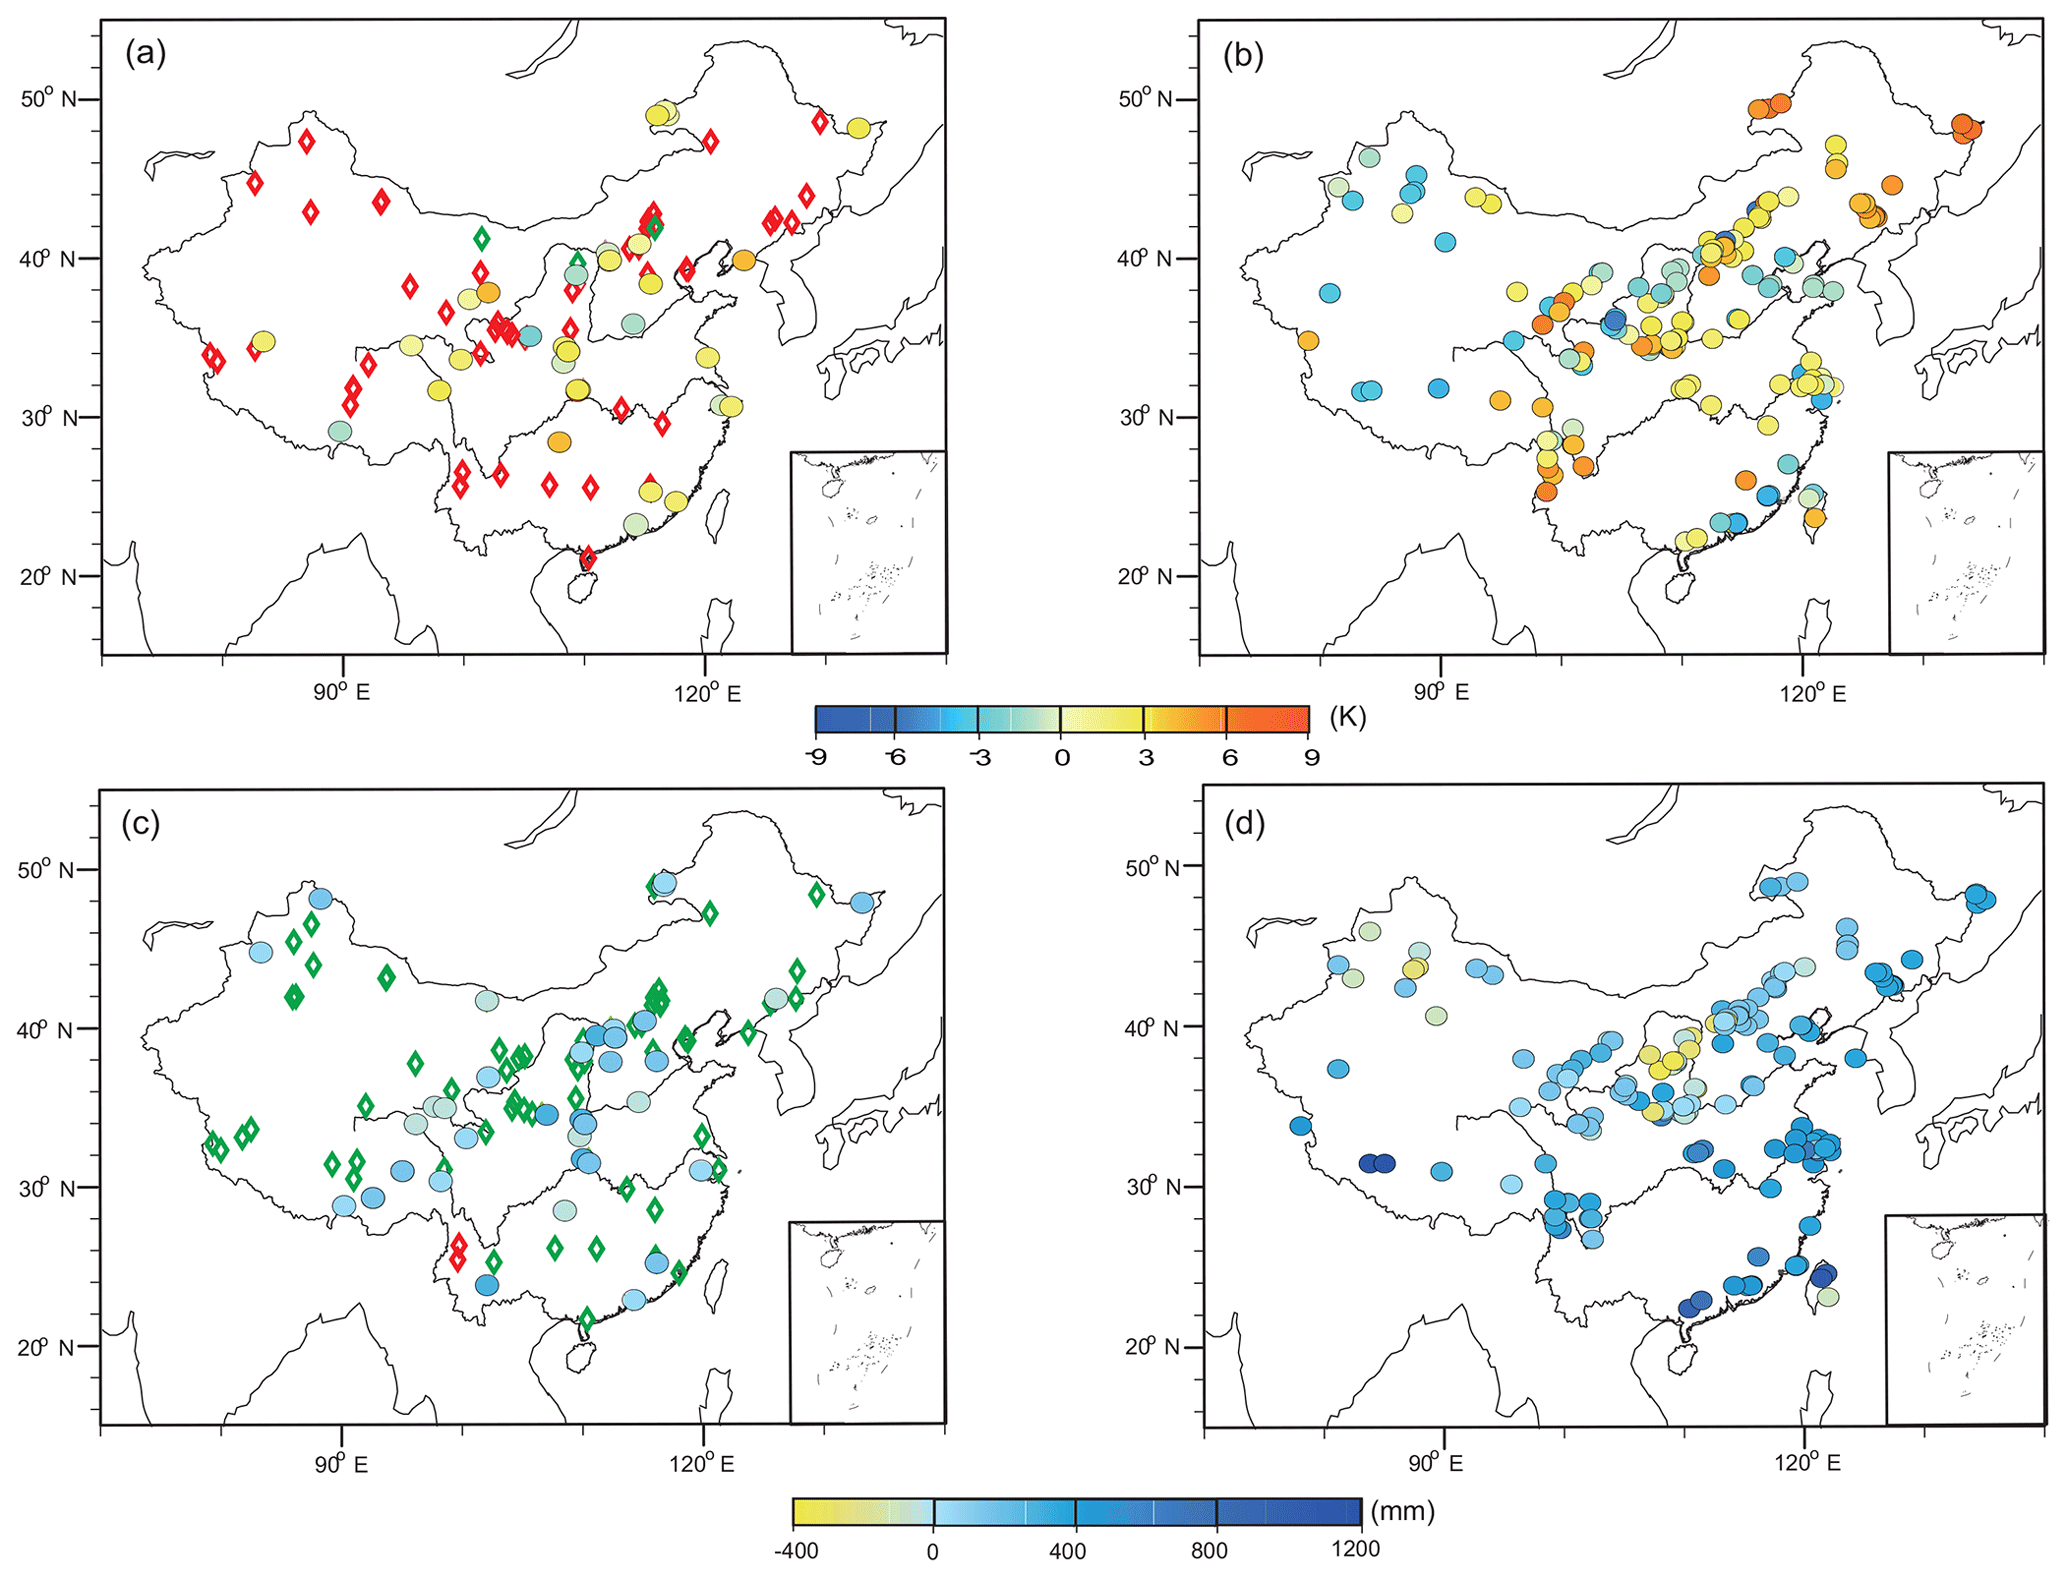
Figure 7Comparison between the climate reconstruction and previous reconstruction over China. (a) Previous temperature results. The diamond is the qualitative reconstruction, red is the temperature increase and green is the temperature decrease; the circle is the quantitative reconstruction. (b) Mean annual temperature reconstruction in this study; (c) previous precipitation results. The diamond is the qualitative reconstruction, red is the precipitation decrease and green is the precipitation increase; the circle is the quantitative reconstruction. (d) Mean annual precipitation reconstruction in this study.
However, there could still be some biases due to the reconstruction method. Estimated climates for the present day from IVM were compared with observed climates (Table 6). The slopes and intercepts show a slight bias for annual and January precipitation, while there is a larger bias between the IVM reconstruction and observation for temperature and July precipitation. IVM relies heavily on BIOME4, and since BIOME4 is a global vegetation model, it is possible that the spatial robustness of regional reconstruction could be less than that of global reconstruction due to the failure to simulate local features (Bartlein et al., 2011). Moreover, the output of the model cannot be directly compared to the pollen data, and the conversion of BIOME4 biomes to pollen biomes by the transfer matrix may add a source of uncertainty in the reconstruction. All these biases in reconstruction should be considered in the evaluation of the discrepancy between models and data for climate change during the MH over China.
4.2 Uncertainties for simulations
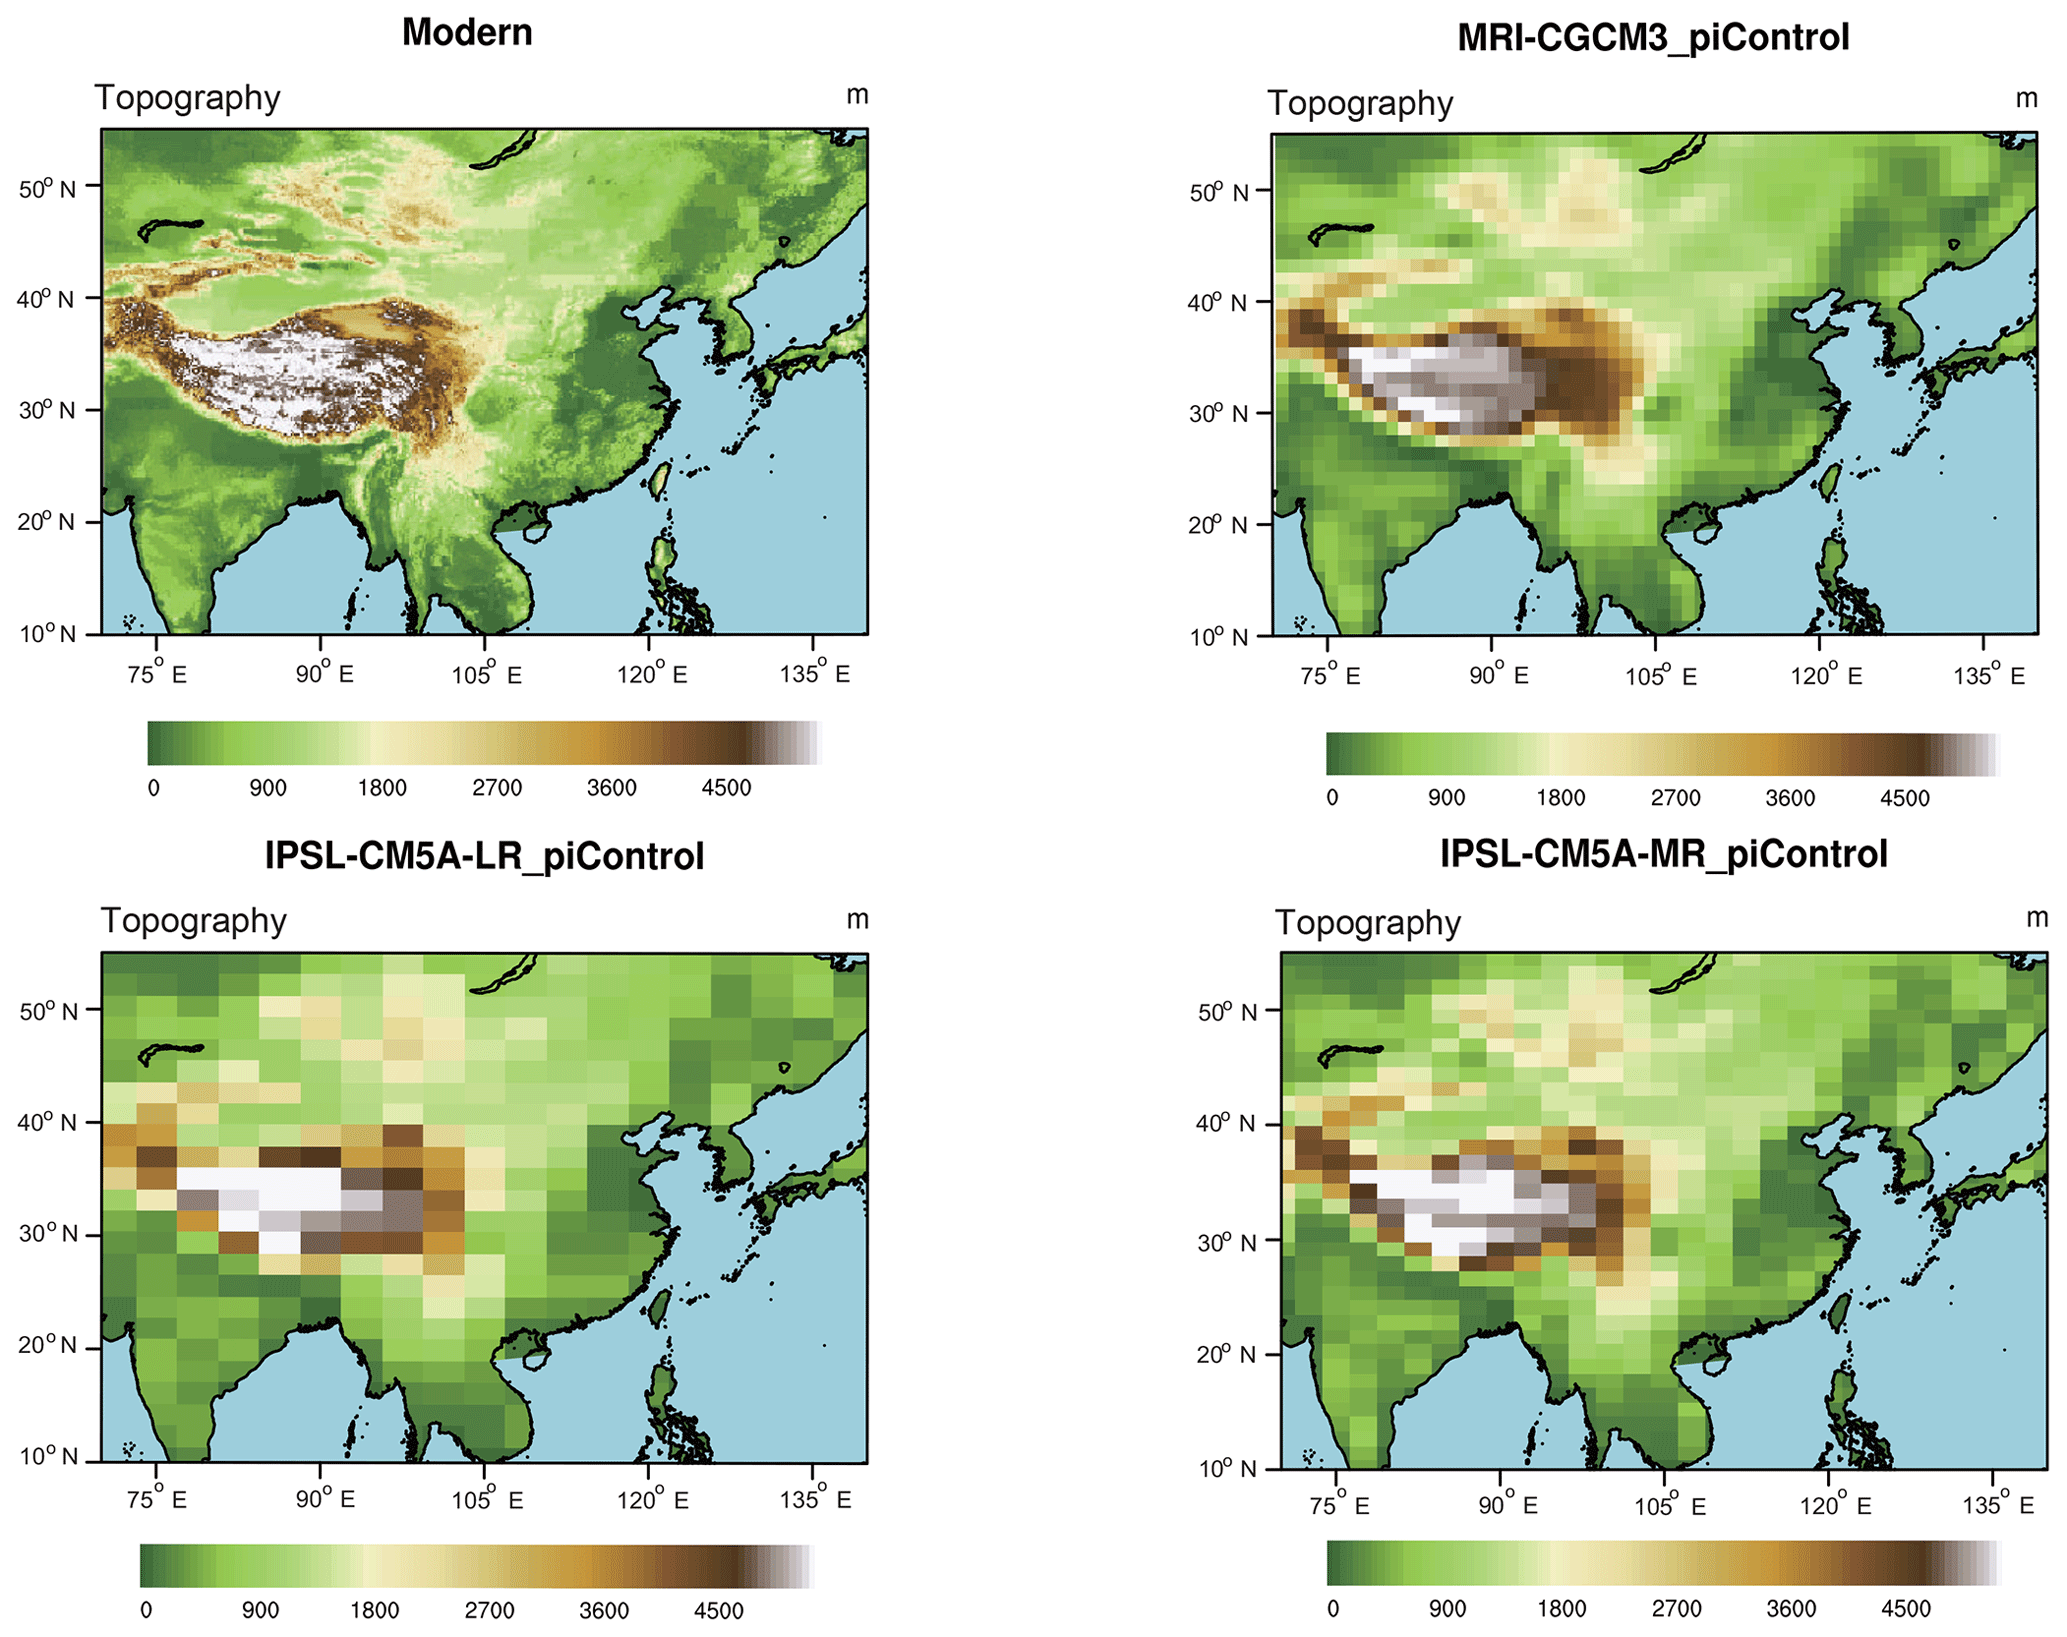
The discrepancies between models and data for MH climate change can also result from uncertainties in simulation and/or model characteristics. First, the coarse spatial resolution of models can be a factor of discrepancy: previous studies show that the GCMs from PMIP3 are reliable in simulating the geographical distribution of temperature and precipitation over China for the present day. However, compared with observations, most models have topography-related cold biases (Jiang et al., 2016). The climate fields, directly used from the model output without downscaling, will not contain the spatial variability of modern climate in topographically complex areas. Thus, it is necessary to determine to what degree model–data mismatch is related to the rough topography used in the climate models. In PMIP3, MRI-CGCM3 has the highest resolution (atmosphere: 320 × 160 × L48; ocean: 364 × 368 × L51), while IPSL-CM5A-LR has the lowest (atmosphere: 96 × 96 × L39; ocean: 182 × 149 × L31). In Fig. 8, we give the actual modern topography and the interpolated topography used in MRI-CGCM3 and IPSL-CM5A-LR. For MRI-CGCM3, the topography is very close to the observation, so for this model, the model–data discrepancy during the MH over China is not related to the resolution. However, for the model with coarse resolution (IPSL-CM5A-LR), it is true that the coarse version of the model will lead to a bias in topography when regional diversity is discussed. The spatial variations in topography could influence the vegetation and hence the simulated climate. To quantify this impact, we compare the topography and PI climate results of IPSL-CM5A-LR and IPSL-CM5A-MR. Figure 9 shows that the difference in topography caused by model resolution does have an impact on small scales (e.g. southern region of the Tibetan Plateau) but not on the overall pattern. However, small- or regional-scale variations in climate can have a large impact on vegetation and hence reconstructed climate. For better comparison in the future work, downscaled climate variables should be considered.
Secondly, besides the qualitative consistency among models caused by the protocol of PMIP3 experiments (Table 2), variability in the magnitude of anomalies between models is clearly illustrated by the box plots (Figs. 3 and 4), especially for the temperature anomaly. Figure S10 demonstrates that there is no clear relationship between PI temperature and temperature anomaly (MH–PI). In other words, these disparities in value or even pattern among models are not related to the difference in PI simulations in a simple manner; instead, they reflect the obvious differences in the response by the climate models to the MH forcing, which raises the question of the magnitude of feedbacks among models.

Figure 9The pre-industrial climate comparison between simulations and observations. “Tas” means temperature 2 m above the surface, and “pr” means precipitation.
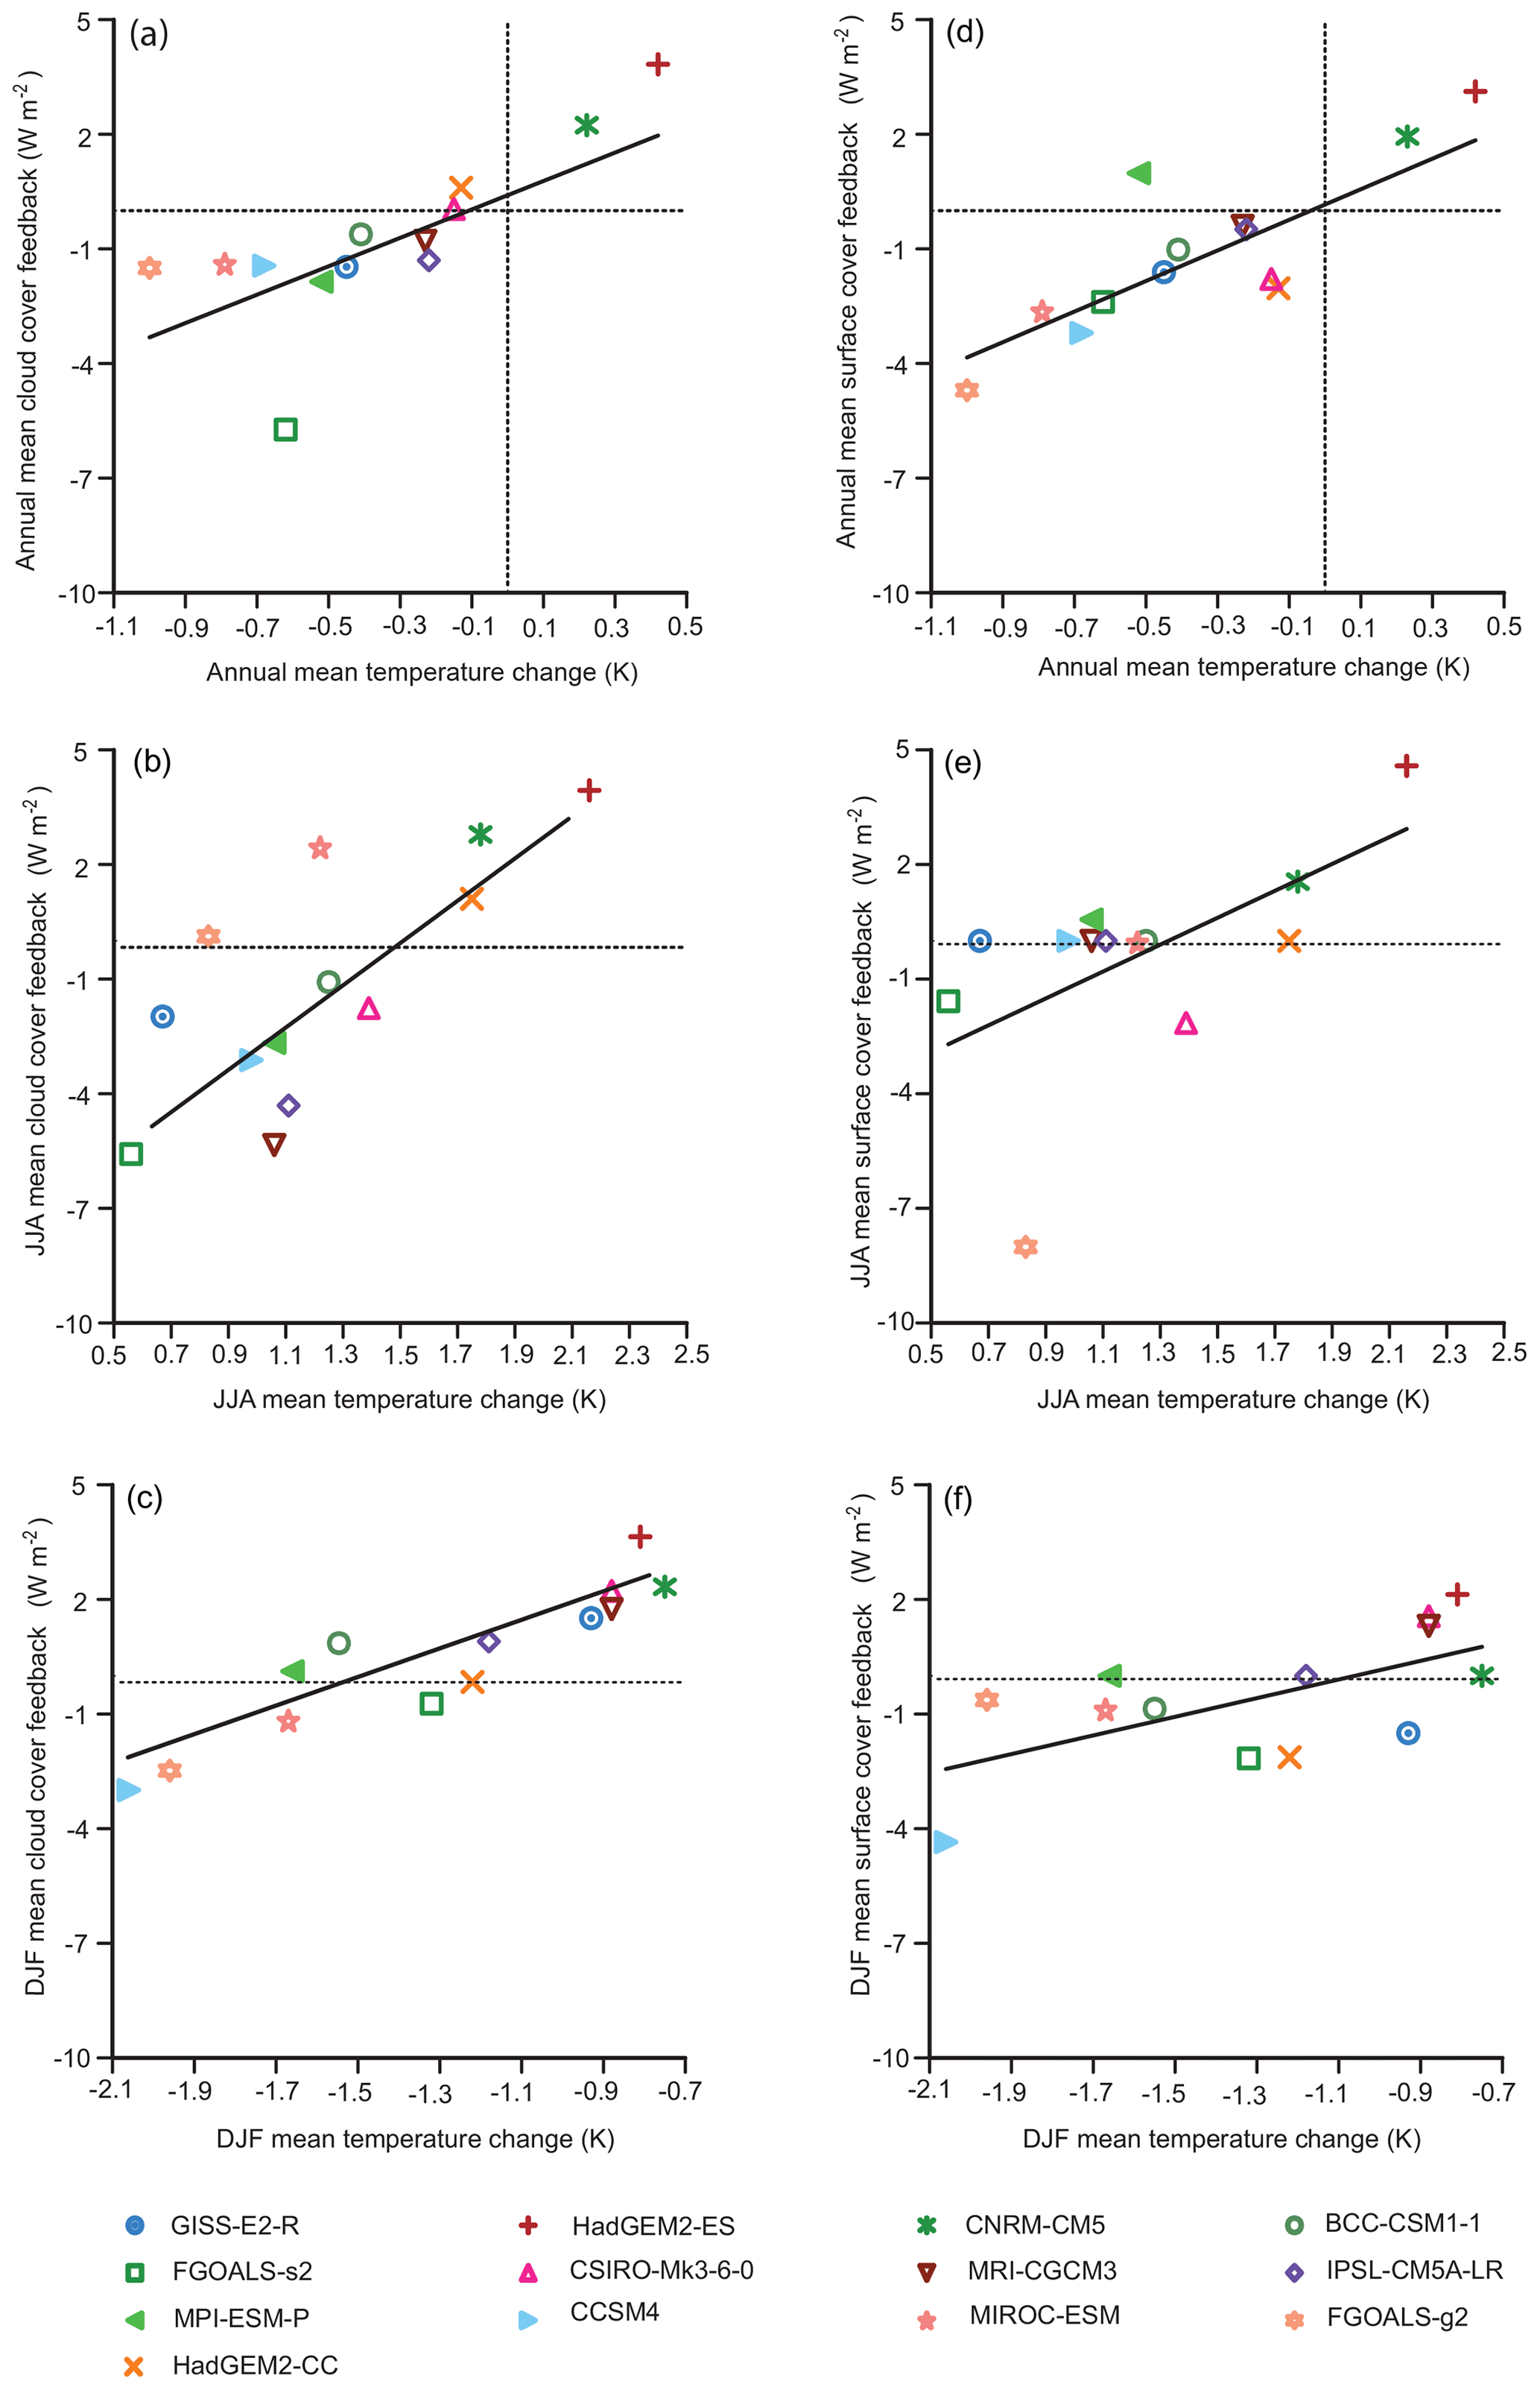
Figure 10Scatter plots showing temperature, cloud cover feedback and surface albedo feedback changes during the MH. The values shown are the simulated 30-year mean anomaly (MH–PI) for the 13 models. (a) Annual mean temperature relative to the annual mean cloud cover feedback and (d) annual surface albedo feedback. (b) Summer (JJA) mean temperature relative to the summer mean cloud cover feedback and (e) summer surface albedo feedback. (c) Winter (DJF) mean temperature relative to the summer mean cloud cover feedback and (f) winter surface albedo feedback. The horizontal and vertical lines in the plots represent the value of 0.
As positive feedbacks between climate and vegetation are important to explain regional climate changes, the failure of the models to represent the amplitude and pattern of the observed vegetation differences (see Sect. 3.2) could amplify and partly account for the model–data disparities in climate change, mainly due to variations in the albedo. Because HadGEM2-ES and HadGEM2-CC are the only two models in PMIP3 with a dynamic vegetation simulation for the MH, we focused on these models to examine the variations in vegetation fraction in the simulations. The main vegetation changes during the MH demonstrated by HadGEM2-ES are an increased tree coverage (∼15 %) and a decreased bare soil fraction (∼6 %), while HadGEM2-CC depicts a ∼3 % decrease in tree fraction and a ∼1 % increase in bare soil (Fig. S11). We made a rough calculation of albedo variance caused solely by vegetation change for both models and for our reconstruction based on the area fraction and albedo value of each vegetation type (Betts, 2000; Bonfils et al., 2001; Oguntunde et al., 2006; Bonan, 2008). The overall albedo change from the vegetation reconstruction during the MH shows a ∼1.8 % decrease when snow free, with a much larger impact (∼4.2 % decrease) when snow covered. The results from HadGEM2-ES are highly consistent with the albedo changes from the reconstruction, featuring a ∼1.4 % (∼6.5 %) decrease without (with) snow, while HadGEM2-CC produces an increased albedo value during the MH (∼0.22 % for snow free, ∼1.9 % with snow cover), depending on its vegetation simulation. Two ideas could be inferred from this calculation: (1) HadGEM2-ES is much better in simulating the MH vegetation changes than HadGEM2-CC, and (2) the failure by models to capture these vegetation changes will result in a much larger impact on winter albedo (with snow) than summer albedo (without snow). In conclusion, there is an obvious advantage of using AOVGCM instead of AOGCM when discussing the MH climate, but the premise is that the AOVGCM can simulate an accurate vegetation distribution.
These surface albedo changes due to vegetation changes could have a cumulative effect on the regional climate by modifying the radiative fluxes. For instance, the spread of trees into the grassland biome in the northeast during the MH, revealed by the reconstruction in our study, should act as a positive feedback to climate warming by increasing the surface net shortwave radiation associated with reductions in albedo due to taller and darker canopies (Chapin et al., 2005). Previous studies show that cloud and surface albedo feedbacks on radiation are major drivers of differences between model outputs for past climates. Moreover, the land surface feedback shows large disparities among models (Braconnot and Kageyama, 2015).
We used a simplified approach (Taylor et al., 2007) to quantify the feedbacks and to compare model behaviour for the MH, thus justifying the focus on surface albedo and atmospheric scattering (mainly accounting for cloud change). Surface albedo and cloud change are calculated using the simulated incoming and outgoing radiative fluxes at the Earth's surface and at the top of the atmosphere (TOA) based on data for the last 30 years averaged from all models. Using this framework, we quantified the effect of changes in albedo on the net shortwave flux at TOA (Braconnot and Kageyama, 2015) and further investigated the relationship between these changes and temperature change. Figure 10 shows that most models produced a negative cloud cover and surface albedo feedback on the annual mean shortwave radiative forcing. Concerning seasonal change, the shortwave cloud and surface feedback in most models tend to counteract the insolation forcing during the boreal summer, while they enhance the solar forcing during winter. A strong positive correlation between albedo feedback and temperature change is depicted, with a large spread in the models owing to the difference in albedo in the 13 models. In particular, CNRM-CM5 and HadGEM2-ES capture higher values of cloud and surface albedo feedback, which could be the reason for the reversal of the decreased annual temperature seen in other models (Fig. 3d).
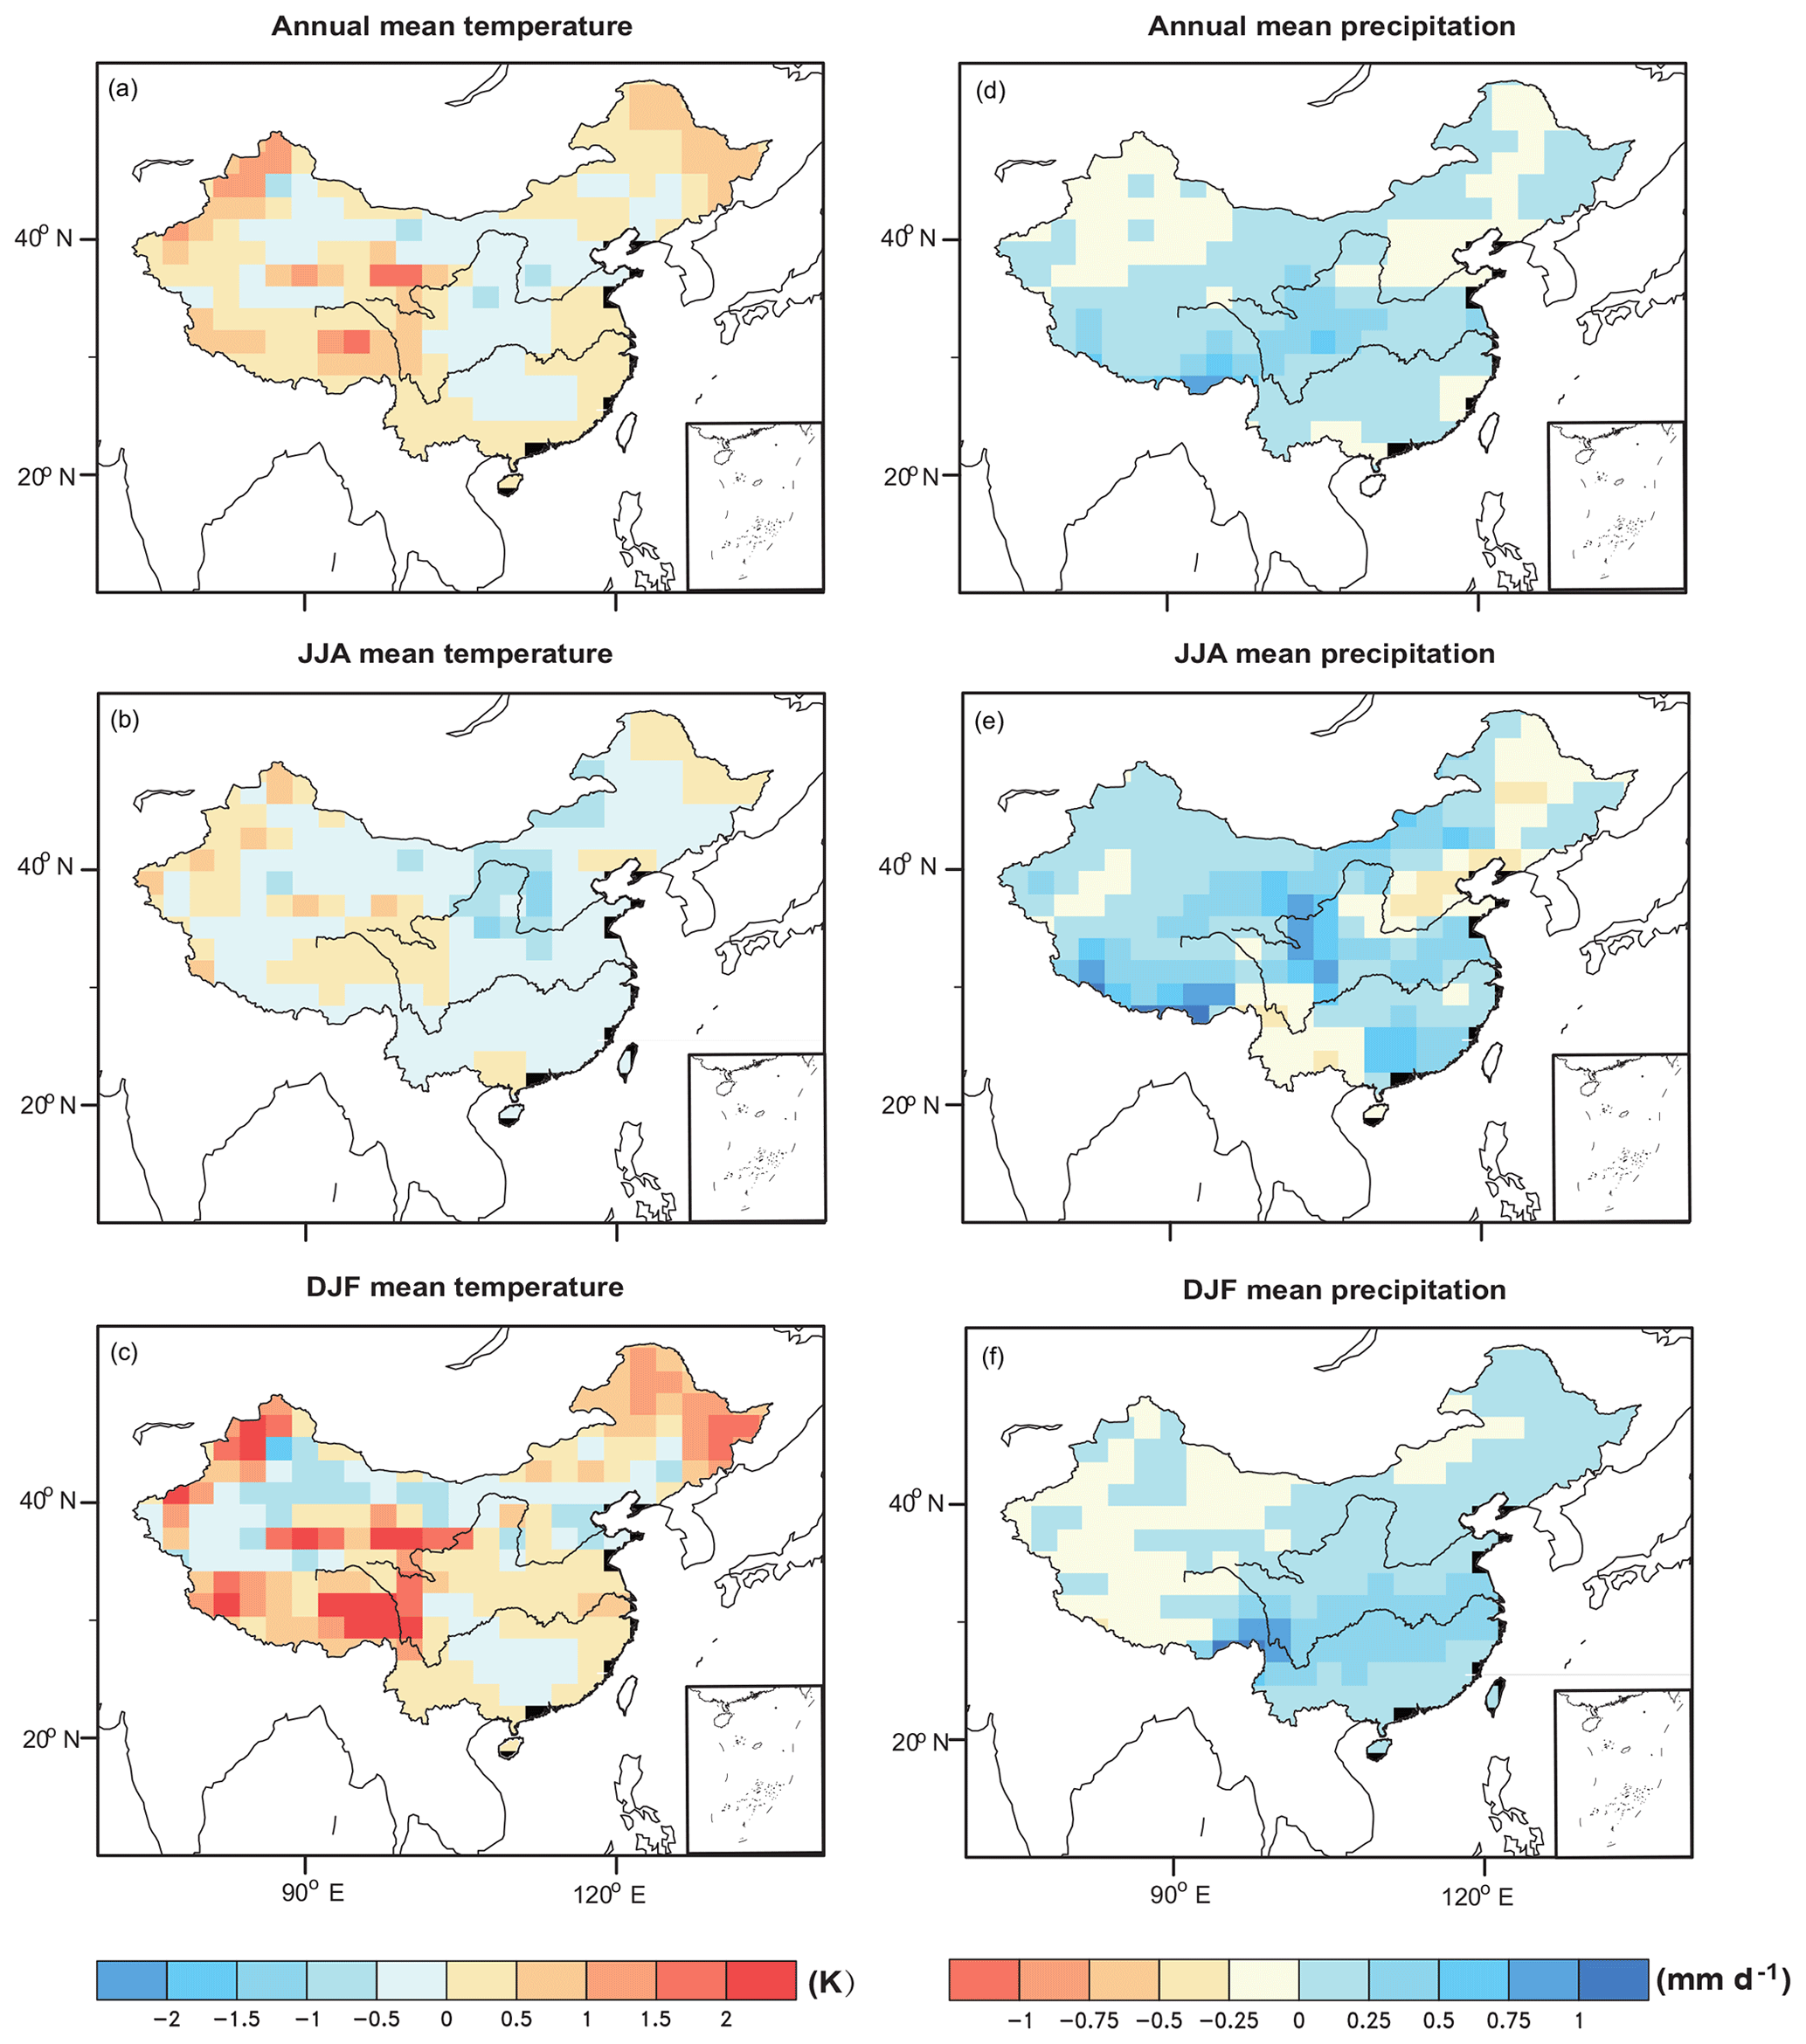
Figure 11Climate anomalies between the two experiments (6 ka and 6 ka_VEG) conducted in CESM version 1.0.5. The anomalies (6 ka_VEG-6 ka) of temperature and precipitation at both the annual and seasonal scale are presented, and all these climate variables are calculated as the last 50-year means from two simulations.
However, the vegetation patterns produced by BIOME4 in Fig. 5 are not used in the PMIP3 experimental set-up. They are only determined by the input variables from models. Therefore, the disagreements on the MH vegetation pattern are possibly inherited from the PI. To better quantify the vegetation–climate feedback, two experiments were conducted in CESM version 1.0.5, including a mid-Holocene (MH) experiment (6 ka) with the original vegetation setting (prescribed as PI vegetation for the MH) and an MH experiment with reconstructed vegetation (6 ka_VEG). Figure 11 shows the climate anomalies (6 ka_VEG minus 6 ka) between two simulations for both the annual and seasonal scale. For temperature, it is clear that the 6 ka_VEG simulation reproduces a warmer annual mean climate (∼0.3 K on average) as well as an obviously warmer winter (∼0.6 K on average). For precipitation, the reconstructed vegetation leads to more annual and seasonal precipitation, which can also reconcile the model–data discrepancy of an increased amplitude for precipitation during the MH (the data reproduced a larger amplitude than the model, as revealed by our study). So the mismatch between models and data in terms of MH vegetation could partly account for the discrepancy in climate due to the interaction between vegetation and climate through radiative and hydrological forcing with albedo. These results highlight the value of building a new generation of models able to capture not only the atmosphere and ocean response, but also the non-linear responses of vegetation and hydrology to climate change.
In this study, we compare the annual and seasonal outputs from the PMIP3 models with an updated synthesis of climate reconstructions over China, including, for the first time, the seasonal cycle of temperature and precipitation. In response to the seasonal insolation change prescribed in PMIP3 for the MH, all models produce similar large-scale patterns for seasonal temperature and precipitation (higher than present July precipitation and MTWA, lower than present MTCO). The main discrepancy emerging from the model–data comparison occurs for the mean annual temperature and MTCO; data show an increased value and most models simulate the opposite except CNRM-CM5 and HadGEM2-ES, which reproduced the higher-than-present MH annual temperature. By conducting simulations with BIOME4 and CESM, we show that surface processes are the key factors explaining the discrepancies between models and data. These results show the importance of including the non-linear responses of the surface water and energy balance related to vegetation changes. However, it should also be noted that prescribing the vegetation with reconstructed biomes would reduce the power of the biome-based climate reconstruction owing to the potential circularity (prescribe the vegetation to get the vegetation). Moreover, besides the vegetation influence, the impact of rough topography, soil type and other possible factors on model–data discrepancy remains to be investigated in future work.
The PMIP3 output is publicly available on the PMIP website (http://pmip3.lsce.ipsl.fr/, last access: 21 June 2019). The 65 pollen biomization results are provided by the Members of the China Quaternary Pollen Database (CQPD). Table 1 shows the information (including references) on the 91 collected pollen records and 3 original ones in our study; the biome scores of these 94 pollen records derived from IVM are listed in Table S4, and the digitized data on pollen can be requested from Qin Li (liqin@mail.iggcas.ac.cn). All the reconstructed climate values at each pollen site from IVM are provided in Table S5. For the data from CQPD, the basic information (location, data supporter, age control and biome type of each site) can be found in CQPD (2000), while the original data are not publicly available yet. These data can be requested from Yunli Luo (lyl@ibcas.ac.cn; Institute of Botany, Chinese Academy of Sciences, Beijing, 100093, China), a core member and academic secretary of the CQPD.
The supplement related to this article is available online at: https://doi.org/10.5194/cp-15-1223-2019-supplement.
YL carried out the model–data analysis and prepared the first draft, GR contributed a lot to the paper's structure and content, and HW provided the reconstruction results from IVM and contributed the paper's structure and content. RRS conducted the BIOME4 simulations. RZ carried out the simulation in CESM. PB, MK and ZG contributed great ideas on model–data comparison work. QL and YL provided pollen data. All co-authors helped to improve the paper.
The authors declare that they have no conflict of interest.
We acknowledge the Paleoclimate Modelling Intercomparison Project and World Climate Research Program's Working Group on Coupled Modelling, which is responsible for PMIP–CMIP, and we thank the climate modelling groups for producing and making available their model output. We are grateful to Marie-France Loutre, Patrick Bartlein and three anonymous reviewers for constructive comments. This research has been supported by the Sino-French Caiyuanpei Program, the Bairen Programs of the Chinese Academy of Sciences and the JPI-Belmont PACMEDY project (grant no. ANR-15-JCLI-0003-01). We also acknowledge Labex L-IPSL, funded by the French Agence Nationale de la Recherche (grant no. ANR-10-LABX-0018), for its support for the biome modelling based on the PMIP database.
This research has been supported by the National Basic Research Program of China (grant no. 2016YFA0600504) and the National Science Foundation of China (grant nos. 41572165, 41690114 and 41125011).
This paper was edited by Marie-France Loutre and reviewed by Patrick Bartlein and three anonymous referees.
An, C., Zhao, J., Tao, S., Lv, Y., Dong, W., Li, H., Jin, M., and Wang, Z.: Dust variation recorded by lacustrine sediments from arid Central Asia since ∼15 cal ka BP and its implication for atmospheric circulation, Quaternary Res., 75, 566–573, 2011.
Bao, Q., Lin, P., Zhou, T., Liu, Y., Yu, Y., Wu, G., He, B., He, J., Li, L., Li, J., Li, Y., Liu, H., Qiao, F., Song, Z., Wang, B., Wang, J., Wang, P., Wang, X., Wang, Z., Wu, B., Wu, T., Xu, Y., Yu, H., Zhao, W., Zheng, W., and Zhou, L.: The flexible global ocean-atmosphere-land system model, spectral version 2: FGOALS-s2, Adv. Atmos. Sci., 30, 561–576, 2013.
Bartlein, P. J., Harrison, S. P., Brewer, S., Connor, S., Davis, B. A. S., Gajewski, K., Guiot, J., Harrison-Prentice, T. I., Henderson, A., Peyron, O., Prentice, I. C., Scholze, M., Seppä, H., Shuman, B., Sugita, S., Thompson, R. S., Viau, A. E., Williams, J., and Wu, H. B.: Pollen-based continental climate reconstructions at 6 and 21 ka: a global synthesis, Clim. Dynam., 37, 775–802, 2011.
Berger, A.: Long-Term Variations of Daily Insolation and Quaternary Climatic Changes, J. Atmos. Sci., 35, 2362–2367, 1978.
Betts, R. A.: Offset of the potential carbon sink from boreal forestation by decreases in surface albedo, Nature, 408, 187–190, 2000.
Bigelow, N. H., Brubaker, L. B., Edwards, M. E., Harrison, S. P., Prentice, I. C., Anderson, P. M., Andreev, A. A., Bartlein, P. J., Christensen, T. R., Cramer, W., Kaplan, J. O., Lozhkin, A. V., Matveyeva, N. V., Murray, D. F., David McGuire, A., Razzhivin, V. Y., Ritchie, J. C., Smith, B., Walker, A. D., Gajewski, K., Wolf, V., Holmqvist, B. H., Igarashi, Y., Kremenetskii, K., Paus, A., Pisaric, M. F. J., and Volkova, V. S.: Climate change and Arctic ecosystems: 1. Vegetation changes north of 55∘ N between the last glacial maximum, mid-Holocene and present, J. Geophys. Res., 108, 1–25, 2003.
Bonan, G. B.: Forests and Climate Change: Forcings, Feedbacks, and the Climate Benefits of Forests, Science, 320, 1444–1449, 2008.
Bonfils, C., de Noblet-Ducoudré, N., Braconnot, P., and Joussaume, S.: Hot Desert Albedo and Climate Change: Mid-Holocene Monsoon in North Africa, J. Climate, 14, 3724–3737, 2001.
Braconnot, P. and Kageyama, M.: Shortwave forcing and feedbacks in Last Glacial Maximum and Mid-Holocene PMIP3 simulations, Philos. T. R. Soc. A, 373, 2054–2060, 2015.
Braconnot, P., Otto-Bliesner, B., Harrison, S., Joussaume, S., Peterchmitt, J.-Y., Abe-Ouchi, A., Crucifix, M., Driesschaert, E., Fichefet, Th., Hewitt, C. D., Kageyama, M., Kitoh, A., Laîné, A., Loutre, M.-F., Marti, O., Merkel, U., Ramstein, G., Valdes, P., Weber, S. L., Yu, Y., and Zhao, Y.: Results of PMIP2 coupled simulations of the Mid-Holocene and Last Glacial Maximum – Part 1: experiments and large-scale features, Clim. Past, 3, 261–277, https://doi.org/10.5194/cp-3-261-2007, 2007a.
Braconnot, P., Otto-Bliesner, B., Harrison, S., Joussaume, S., Peterchmitt, J.-Y., Abe-Ouchi, A., Crucifix, M., Driesschaert, E., Fichefet, Th., Hewitt, C. D., Kageyama, M., Kitoh, A., Loutre, M.-F., Marti, O., Merkel, U., Ramstein, G., Valdes, P., Weber, L., Yu, Y., and Zhao, Y.: Results of PMIP2 coupled simulations of the Mid-Holocene and Last Glacial Maximum – Part 2: feedbacks with emphasis on the location of the ITCZ and mid- and high latitudes heat budget, Clim. Past, 3, 279-296, https://doi.org/10.5194/cp-3-279-2007, 2007b.
Braconnot, P., Harrison, S. P., Kageyama, M., Bartlein, P. J., Masson-Delmotte, V., Abe-Ouchi, A., Otto-Bliesner, B., and Zhao, Y.: Evaluation of climate models using palaeoclimatic data, Nat. Clim. Change, 2, 417–421, 2012.
Cai, Y.: Study on environmental change in Zoige Plateau: Evidence from the vegetation record since 24000 a B.P., Chinese Academy of Geological Sciences, Mater Dissertation, 2008 (in Chinese with English abstract).
Caudill, M. and Bulter, C.: Understanding Neural Networks, Basic Networks, 1, 309–331, 1992.
Chapin, F. S., Sturm, M., Serreze, M. C., McFadden, J. P., Key, J. R., Lloyd, A. H., McGuire, A. D., Rupp, T. S., Lynch, A. H., Schimel, J. P., Beringer, J., Chapman, W. L., Epstein, H. E., Euskirchen, E. S., Hinzman, L. D., Jia, G., Ping, C.L., Tape, K. D., Thompson, C. D. C., Walker, D. A., and Welker, J. M.: Role of Land-Surface Changes in Arctic Summer Warming, Science, 310, 657–660, 2005.
Chen, F., Cheng, B., Zhao, Y., Zhu, Y., and Madsen, D. B.: Holocene environmental change inferred from a high-resolution pollen record, Lake Zhuyeze, arid China, The Holocene, 16, 675–684, 2006.
Chen, F., Xu, Q., Chen, J., Birks, H. J. B., Liu, J., Zhang, S., Jin, L., An, C., Telford, R. J., Cao, X., Wang, Z., Zhang, X., Selvaraj, K., Lu, H., Li, Y., Zheng, Z., Wang, H., Zhou, A., Dong, G., Zhang, J., Huang, X., Bloemendal, J., and Rao, Z.: East Asian summer monsoon precipitation variability since the last deglaciation, Sci. Rep., 5, 1–11, 2015.
Cheng, B., Chen, F., and Zhang, J.: Palaeovegetational and Palaeoenvironmental Changes in Gonghe Basin since Last Deglaciation, Ac. Geogr. Sin., 11, 1336–1344, 2010 (in Chinese with English abstract).
Cheng, H., Edwards, R. L., Sinha, A., Spötl, C., Yi, L., Chen, S., Kelly, M., Kathayat, G., Wang, X., Li, X., Kong, X., Wang, Y., Ning, Y., and Zhang, H.: The Asian monsoon over the past 640,000 years and ice age terminations, Nature, 534, 640–646, 2016.
Cheng, Y.: Vegetation and climate change in the north-central part of the Loess Plateau since 26,000 years, China University of Geosciences, Master Dissertation, 2011 (in Chinese with English abstract).
Collins, W. J., Bellouin, N., Doutriaux-Boucher, M., Gedney, N., Halloran, P., Hinton, T., Hughes, J., Jones, C. D., Joshi, M., Liddicoat, S., Martin, G., O'Connor, F., Rae, J., Senior, C., Sitch, S., Totterdell, I., Wiltshire, A., and Woodward, S.: Development and evaluation of an Earth-System model – HadGEM2, Geosci. Model Dev., 4, 1051–1075, https://doi.org/10.5194/gmd-4-1051-2011, 2011.
Cui, M., Luo, Y., and Sun, X.: Paleovegetational and paleoclimatic changed in Ha'ni Lake, Jilin since 5 ka BP, Mar. Geol. Quatern. Geol., 26, 117–122, 2006 (in Chinese with English abstract).
Dallmeyer, A., Claussen, M., Ni, J., Cao, X., Wang, Y., Fischer, N., Pfeiffer, M., Jin, L., Khon, V., Wagner, S., Haberkorn, K., and Herzschuh, U.: Biome changes in Asia since the mid-Holocene – an analysis of different transient Earth system model simulations, Clim. Past, 13, 107–134, https://doi.org/10.5194/cp-13-107-2017, 2017.
Davis, B. A. S., Brewer, S., Stevenson, A. C., and Guiot, J.: The temperature of Europe during the Holocene reconstructed from pollen data, Quaternary Sci. Rev., 22, 1701–1716, 2003.
Diffenbaugh, N. S., Sloan, L. C., Snyder, M. A., Bell, J. L., Kaplan, J., Shafer, S. L., and Bartlein, P. J.: Vegetation sensitivity to global anthropogenic carbon dioxide emissions in a topographically complex region, Global Biogeochem. Cy., 17, 1067, https://doi.org/10.1029/2002GB001974, 2003.
Dufresne, J. L., Foujols, M. A., Denvil, S., Caubel, A., Marti, O., Aumont, O., Balkanski, Y., Bekki, S., Bellenger, H., Benshila, R., Bony, S., Bopp, L., Braconnot, P., Brockmann, P., Cadule, P., Cheruy, F., Codron, F., Cozic, A., Cugnet, D., Noblet, N., Duvel, J.P., Ethe, C., Fairhead, L., Fichefet, T., Flavoni, S., Friedlingstein, P., Grandpeix, J. Y., Guez, L., Guilyardi, E., Hauglustaine, D., Hourdin, F., Idelkadi, A., Ghattas, J., Joussaume, S., Kageyama, M., Krinner, G., Labetoulle, S., Lahellec, A., Lefevre, M.-F., Lefevre, F., Levy, C., Li, Z. X., Lloyd, J., Lott, F., Madec, G., Mancip, M., Marchand, M., Masson, S., Meurdesoif, Y., Mignot, J., Musat, I., Parouty, S., Polcher, J., Rio, C., Schulz, M., Swingedouw, D., Szopa, S., Talandier, C., Terray, P., Viovy, N., and Vuichard, N.: Climate change projections using the IPSL-CM5 Earth system model: from CMIP3 to CMIP5, Clim. Dynam., 40, 2123–2165, 2013.
EPICA Community Members: Eight glacial cycles from an Antarctic ice core, Nature, 429, 623–628, 2004.
Food and Agricultural Organization: Soil Map of the World 1 : 5 000 000, FAO, 1995.
Farrera, I., Harrison, S. P., Prentice, I. C., Ramstein, G., Guiot, J., Bartlein, P. J., Bonnefille, R., Bush, M., Cramer, W., von Grafenstein, U., Holmgren, K., Hooghiemstra, H., Hope, G., Jolly, D., Lauritzen, S. E., Ono, Y., Pinot, S., Stute, M., and Yu, G.: Tropical climates at the Last Glacial Maximum: a new synthesis of terrestrial palaeoclimate data. I. Vegetation, lake-levels and geochemistry, Clim. Dynam., 15, 823–856, 1999.
Fischer, N. and Jungclaus, J. H.: Evolution of the seasonal temperature cycle in a transient Holocene simulation: orbital forcing and sea-ice, Clim. Past, 7, 1139–1148, https://doi.org/10.5194/cp-7-1139-2011, 2011.
Ganopolski, A., Kubatzki, C., Claussen, M., Brovkin, V., and Petoukhov, V.: The Influence of Vegetation-Atmosphere-Ocean Interaction on Climate during the Mid-Holocene, Science, 280, 1916–1919, 1998.
Gent, P. R., Danabasoglu, G., Donner, L. J., Holland, M. M., Hunke, E. C., Jayne, S. R., Lawrence, D. M., Neale, R. B., Rasch, P. J., Vertenstein, M., Worley, P. H., Yang, Z., and Zhang, M.: The community climate system model version 4, J. Climate, 24, 4973–4991, 2011.
Giorgetta, M. A., Jungclaus, J., Reick, C. H., Legutke, S., Bader, J., Bottinger, M., Brovkin, V., Crueger, T., Esch, M., Fieg, K., Glushak, K., Gayler, V., Haak, H., Hollweg, H. D., Ilyina, T., Kinne, S., Kornblueh, L., Matei, D., Mauritsen, T., Mikolajewicz, U., Mueller, W., Notz, D., Pithan, F., Raddatz, T. J., Rast, S., Redler, R., Roeckner, E., Schmidt, H., Schnur, R., Segschneider, J., Six, K. D., Stockhause, M., Timmreck, C., Wegner, J., Widmann, H., Wieners, K. H., Claussen, M., Marotzke, J., and Stevens, B.: Climate and carbon cycle changes from 1850 to 2100 in MPI-ESM simulations for the Coupled Model Intercomparison Project phase 5, J. Adv. Model. Earth Syst., 5, 572–597, 2013.
Gong, X.: High-resolution paleovegetation reconstruction from pollen in Jiachuanyuan, Baoji, Capital Normal University, Master Dissertation, 2006 (in Chinese with English abstract).
Guiot, J. and Goeury, C.: PPPBASE, a software for statistical analysis of paleoecological and paleoclimatological data, Dendrochronologia, 14, 295–300, 1996.
Guiot, J., Harrison, S., and Prentice, I. C.: Reconstruction of Holocene precipitation patterns in Europe using pollen and lake level data, Quaternary Res., 40, 139–149, 1993.
Guiot, J., Torre, F., Jolly, D., Peyron, O., Boreux, J. J., and Cheddadi, R.: Inverse vegetation modeling by Monte Carlo sampling to reconstruct palaeoclimates under changed precipitation seasonality and CO2 conditions: application to glacial climate in Mediterranean region, Ecol. Model., 127, 119–140, 2000.
Guo, L., Feng, Z., Lee, X., Liu, L., and Wang, L.: Holocene climatic and environmental changes recorded in Baahar Nuur Lake in the Ordos Plateau, Southern Mongolia of china, Chinese Sci. Bull., 52, 959–966, 2007.
Hargreaves, J. C., Annan, J. D., Ohgaito, R., Paul, A., and Abe-Ouchi, A.: Skill and reliability of climate model ensembles at the Last Glacial Maximum and mid-Holocene, Clim. Past, 9, 811–823, https://doi.org/10.5194/cp-9-811-2013, 2013.
Harrison, S. P., Bartlein, P. J., Brewer, S., Prentice, I. C., Boyd, M., Hessler, I., Holmgren, K., Izumi, K., and Willis, K.: Climate model benchmarking with glacial and mid-Holocene climates, Clim. Dynam., 43, 671–688, 2014.
Harrison, S. P., Bartlein, P. J., K., Izumi, Li, G., Annan, J., Hargreaves, J., Braconnot, P., and Kageyama, M.: Evaluation of CMIP5 paleo-simulations to improve climate projections, Nat. Clim. Change, 5, 735–743, 2015.
Harrison, S., P., Braconnot, P., Hewitt, C., and Stouffer, R., J.: Fourth International Workshop of the Palaeoclimate Modelling Intercomparison Project (PMIP): Lauching PMIP2 Phase II, EOS, 83, 447–457, 2002.
Herzschuh, U., Kramer, A., Mischke, S., and Zhang, C.: Quantitative climate and vegetation trends since the late glacial on the northeastern Tibetan Plateau deduced from Koucha Lake pollen spectra, Quaternary Res., 71, 162–171, 2009.
Herzschuh, U., Kürschner, H., and Mischke, S.: Temperature variability and vertical vegetation belt shifts during the last ∼ 50,000 yr in the Qilian mountains (NE margin of the Tibetan Plateau, China), Quaternary Res., 66, 133–146, 2006.
Huang, C., Elis, V. C., and Li, S.: Holocene environmental changes of Western and Northern Qinghai-Xizang Plateau Based on pollen analysis, Ac. Micropalaeontol. Sin., 4, 423–432, 1996 (in Chinese with English abstract).
Jeffrey, S. J., Rotstayn, L. D., Collier, M., Dravitzki, S. M., Hamalainen, C., Moeseneder, C., Wong, K. K., and Syktus, J. I.: Australia' s CMIP5 submission using the CSIRO-Mk3.6 model, Aust. Meteorol. Ocean., 63, 1–13, 2013.
Jia, L. and Zhang, Y.: Studies on Palynological assemblages and paleoenvironment of late Quaternary on the east margin of the Chanjiang (Yangtze) river delta, Ac. Micropalaeontol. Sin., 23, 70–76, 2006 (in Chinese with English abstract).
Jiang, D., Lang, X., Tian, Z., and Wang, T.: Considerable Model–Data Mismatch in Temperature over China during the Mid-Holocene: Results of PMIP Simulations, J. Climate, 25, 4135–4153, 2012.
Jiang, D., Tian, Z., and Lang, X.: Mid-Holocene net precipitation changes over China: model-data comparison, Quaternary Sci. Rev., 82, 104–120, 2013.
Jiang, D., Tian, Z., and Lang, X.: Reliability of climate models for China through the IPCC Third to Fifth Assessment Reports, Int. J. Climatol., 36, 1114–1133, 2016.
Jiang, Q. and Piperno, R. D.: Environmental and archaeological implications of a late Quaternary palynological sequence, Poyang lake, Southern China, Quaternary Res., 52, 250–258, 1999.
Jiang, W., Guiot, J., Chu, G., Wu, H., Yuan, B., Hatté, C., and Guo, Z.: An improved methodology of the modern analogues technique for palaeoclimate reconstruction in arid and semi-arid regions, Boreas, 39, 145–153, 2010.
Jiang, W., Guo, Z., Sun, X., Wu, H., Chu, G., Yuan, B., Hatte, C., and Guiot, J.: Reconstruction of climate and vegetation changes of Lake Bayanchagan (Inner Mongolia): Holocene variability of the East Asian monsoon, Quaternary Res., 65, 411–420, 2006.
Jiang, W., Leroy, S. G., Ogle, N., Chu, G., Wang, L., and Liu, J.: Natural and authropogenic forest fires recorded in the Holocene pollen record from a Jinchuan peat bog, northeastern China, Palaeogeogr. Palaeocl., 261, 47–57, 2008.
Joussaume, S. and Taylor, K. E.: Status of the paleoclimate modeling intercomparison project (PMIP), World Meteorological Organization-Publications-WMO TD, 425–430, 1995.
Joussaume, S., Taylor, K. E., Braconnot, P., Mitchell, J. F. B., Kutzbach, J. E., Harrison, S. P., Prentice, I. C., Broccoli, A. J., Abe-Ouchi, A., Bartlein, P. J., Bonfils, C., Dong, B., Guiot, J., Herterich, K., Hewitt, C. D., Jolly, D., Kim, J. W., Kislov, A., Kitoh, A., Loutre, M. F., Masson, V., McAvaney, B., McFarlane, N., de Noblet, N., Peltier, W. R., Peterschmitt, J. Y., Pollard, D., Rind, D., Royer, J. F., Schlesinger, M. E., Syktus, J., Thompson, S., Valdes, P., Vettoretti, G., Webb, R. S., and Wyputta, U.: Monsoon changes for 6000 years ago: Results of 18 simulations from the Paleoclimate Modeling Intercomparison Project (PMIP), Geophys. Res. Lett., 26, 856–862, 1999.
Kaplan, J. O., Bigelow, N. H., Bartlein, P. J., Christensen, T. R., Cramer, W., Harrison, S. P., Matveyeva, N. V., McGuire, A. D., Murray, D. F., Prentice, I. C., Razzhivin, V. Y., Smith, B., Anderson, P. M., Andreev, A. A., Brubaker, L. B., Edwards, M. E., and Lozhkin, A. V.: Climate change and Arctic ecosystems: 2. Modeling, palaeodata-model comparisons, and future projections, J. Geophys. Res.-Atmos., 108, 8171, https://doi.org/10.1029/2002JD002559, 2003.
Kohfeld, K. E. and Harrison, S.: How well we can simulate past climates? Evaluating the models using global palaeoenvironmental datasets, Quaternary Sci. Rev., 19, 321–346, 2000.
Kong, Z., Xu, Q., Yang, X., Sun, L., and Liang, W.: Analysis of sporopollen assemblages of Holocene alluvial deposits in the Yinmahe River Basin, Hebei Province, and preliminary study on temporal and spatial changes of vegetation, Ac. Phytoecol. Sin., 24, 724–730, 2000 (in Chinese with English abstract).
Lee, Y. and Liew, M.: Pollen stratigraphy, vegetation and environment of the last glacial and Holocene-A record from Toushe Basin, central Taiwan, Palaeogeogr. Palaeocl., 287, 58–66, 2010.
Li, B. and Sun, J.: Vegetation and climate environment during Holocene in Xi'an region of Loess Plateau, China, Mar. Geol. Quatern. Geol., 3, 125–132, 2005 (in Chinese with English abstract).
Li, C., Wu, Y., and Hou, X.: Holocene vegetation and climate in Northeast China revealed from Jingbo Lake sediment, Quatern. Int., 229, 67–73, 2011.
Li, L., Lin, P., Yu, Y., Wang, B., Zhou, T., Liu, L., Liu, J., Bao, Q., Xu, S., Huang, W., Xia, K., Pu, Y., Dong, L., Shen, S., Liu, Y., Hu, N., Liu, M., Sun, W., Shi, X., Zheng, W., Wu, B., Song, M., Liu, H., Zhang, X., Wu, G., Xue, W., Huang, X., Yang, G., Song, Z., and Qiao, F.: The flexible global ocean-atmosphere-land system model, Grid-point Version 2: FGOALS-g2, Adv. Atmos. Sci., 30, 543–560, 2013.
Li, Q., Wu, H., Guo, Z., Yu, Y., Ge, J., Wu, J., Zhao, D., and Sun, A.: Distribution and vegetation reconstruction of the deserts of northern China during the mid-Holocene, Geophys. Res. Lett., 41, 2184–5191, 2014.
Li, X. and Liu, J.: Holocene vegetational and environmental changes at Mt. Luoji, Sichuan, Ac. Geogr. Sin., 1, 44–51, 1988 (in Chinese with English abstract).
Li, X., Zhao, K., Dodson, J., and Zhou, X.: Moisture dynamics in central Asia for the last 15 kyr: new evidence from Yili Valley, Xinjiang, NW China, Quaternary Sci. Rev., 30, 23–34, 2011.
Li, X., Zhou, J., and Dodson, J.: The vegetation characteristics of the “yuan” area at Yaoxian on the loess plateau in china over the last 12?000 years, Rev. Palaeobot. Palyno., 124, 1–7, 2003.
Li, X., Zhou, W., An, Z., and Dodson, J.: The vegetation and monsoon variations at the desert-loess transition belt at Midiwan in northern China for the last 13 ka, Holocene, 13, 779–784, 2003.
Li, Z., Hai, Y., Zhou, Y., Luo, R., and Zhang, Q.: Pollen Component of Lacustrain Deposit and its Palaeo-environment Significance in the Downstream Region of Urumqi Riever since 30 Ka BP, Arid Land Geogr., 24, 201–205, 2001 (in Chinese with English abstract).
Liu, H., Cui, H., Tian, Y., and Xu, L.: Temporal-spatial variances of Holocene precipitation at the Marginal area of the East Monsoon influences from pollen evidence, Ac. Botan. Sin., 44, 864–871, 2002 (in Chinese with English abstract).
Liu, H., Tang, X., Sun, D., and Wang, K.: Palynofloras of the Dajiuhu Basin in Shennongjia mountains during the last 12.5 ka, Ac. Micropalaeontol. Sin., 1, 101–109, 2001 (in Chinese with English abstract).
Liu, J., Zhao, S., Cheng, J., Bao, J., and Yin, G.: A study of vegetation and climate evolution since the Holocene near the banks of the Qiangtang River in Hangzhou Bay, Earth Sci. Front., 5, 235–245, 2007 (in Chinese with English abstract).
Liu, M., Huang, Y., and Kuo, M.: Pollen stratigraphy, vegetation and environment of the last glacial and Holocene-A record from Toushe Basin, central Taiwan, Quatern. Int., 14, 16–33, 2006.
Liu, Y., Liu, J., and Han, J.: Pollen record and climate changing since 12.0 ka BP in Erlongwan Maar Lake, Jilin province, Journal of Jilin University (Earth Science Edition), 39, 93–98, 2009 (in Chinese with English abstract).
Liu, Y., Zhang, S., Liu, J., You, H., and Han, J.: Vegetation and environment history of erlongwan Maar lake during the late Pleistocene on pollen record, Ac. Micropalaeontol. Sin., 25, 274–280, 2008 (in Chinese with English abstract).
Liu, Z., Harrison, S. P., Kutzbach, J. E., and Otto-Bliesner, B.: Global monsoons in the mid-Holocene and oceanic feedback, Clim. Dynam., 22, 157–182, 2004.
Liu, Z., Wang, Y., Gallimore, R., Gasse, F., Johnson, T., deMenocal, P., Adkins, J., Notaro, M., Prentice, I. C., Kutzbach, J., Jacob, R., Behling, P., Wang, L., and Ong, E.: Simulating the transient evolution and abrupt change of Northern Africa atmosphere–ocean–terrestrial ecosystem in the Holocene, Quaternary Sci. Rev., 26, 1818–1837, 2007.
Liu, Z., Zhu, J., Rosenthal, Y., Zhang, X., Otto-Bliesner, B. L., Timmermann, A., Smith, R. S., Lohmann, G., Zheng, W., and Elison Timm, O.: The Holocene temperature conundrum, P. Natl. Acad. Sci. USA, 111, E3501–E3505, 2014.
Lu, H., Wu, N., Liu, K.-b., Zhu, L., Yang, X., Yao, T., Wang, L., Li, Q., Liu, X., Shen, C., Li, X., Tong, G., and Jiang, H.: Modern pollen distributions in Qinghai-Tibetan Plateau and the development of transfer functions for reconstructing Holocene environmental changes, Quaternary Sci. Rev., 30, 947–966, 2012.
Luo, H.: Characteristics of the Holocene sporopollen flora and climate change in the Coqên area, Tibet, Chengdu University of Technology, Master Dissertation, 2008 (in Chinese with English abstract).
Mann, M. E., Zhang, Z., Hughes, M. K., Bradley, R. S., Miller, S. K., Rutherford, S., and Ni, F.: Proxy-based reconstructions of hemispheric and global surface temperature variations over the past two millennia, P. Natl. Acad. Sci., 105, 13252–13256, 2008.
Marchant, R., Cleef, A., Harrison, S. P., Hooghiemstra, H., Markgraf, V., van Boxel, J., Ager, T., Almeida, L., Anderson, R., Baied, C., Behling, H., Berrio, J. C., Burbridge, R., Björck, S., Byrne, R., Bush, M., Duivenvoorden, J., Flenley, J., De Oliveira, P., van Geel, B., Graf, K., Gosling, W. D., Harbele, S., van der Hammen, T., Hansen, B., Horn, S., Kuhry, P., Ledru, M.-P., Mayle, F., Leyden, B., Lozano-García, S., Melief, A. M., Moreno, P., Moar, N. T., Prieto, A., van Reenen, G., Salgado-Labouriau, M., Schäbitz, F., Schreve-Brinkman, E. J., and Wille, M.: Pollen-based biome reconstructions for Latin America at 0, 6000 and 18 000 radiocarbon years ago, Clim. Past, 5, 725–767, https://doi.org/10.5194/cp-5-725-2009, 2009.
Marcott, S., Shakun, J., U Clark, P., and Mix, A.: A Reconstruction of Regional and Global Temperature for the Past 11,300 Years, Science, 1198–1201, 2013.
Marsicek, J., Shuman, B. N., Bartlein, P. J., Shafer, S. L., and Brewer, S.: Reconciling divergent trends and millennial variations in Holocene temperatures, Nature, 554, 92–96, 2018.
Mauri, A., Davis, B. A. S., Collins, P. M., and Kaplan, J. O.: The climate of Europe during the Holocene: a gridded pollen-based reconstruction and its multi-proxy evaluation, Quaternary Sci. Rev., 112, 109–127, 2015.
Ma, Y., Zhang, H., Pachur, H., Wunnemann, B., Li, J., and Feng, Z.: Late Glacial and Holocene vegetation history and paleoclimate of the Tengger Desert, northwestern China, Chinese Sci. Bull., 48, 1457–1463, 2003.
Members of the China Quaternary Pollen Data Base (CQPD): Pollen-based Biome reconstruction at Middle Holocene (6 ka BP) and Last Glacial Maximum (18 ka BP) in China, Ac. Botan. Sin., 42, 1201–1209, 2000 (in Chinese with English abstract).
MARGO Project Members: Constraints on the magnitude and patterns of ocean cooling at the Last Glacial Maximum, Nat. Geosci., 2, 127–130, 2009.
Meng, X., Zhu, D., Shao, Z., Han, J., Yu, J., Meng, Q., Lv, R., and Luo, P.: Paleoclimatic and Plaeoenvironmental Evolution Since Holocene in the Ningwu Area, Shanxi Province, Ac. Geol. Sin., 3, 316–323, 2007 (in Chinese with English abstract).
Ni, J., Sykes, M. T., Prentice, I. C., and Cramer, W.: Modelling the vegetation of China using the process-based equilibrium terrestrial biosphere model BIOME3, Global Ecol. Biogeogr., 9, 463–479, 2000.
Ni, J., Yu, G., Harrison, S. P., and Prentice, I. C.: Palaeovegetation in China during the late Quaternary: Biome reconstructions based on a global scheme of plant functional types, Palaeogeogr. Palaeocl., 289, 44–61, 2010.
Oguntunde, P. G., Ajayi, A. E., and Giesen, N.: Tillage and surface moisture effects on bare-soil albedo of a tropical loamy sand, Soil Till. Res., 85, 107–114, 2006.
O'ishi, R., Abe-Ouchi, A., Prentice, I. C., and Sitch, S.: Vegetation dynamics and plant CO2 responses as positive feedbacks in a greenhouse world, Geophys. Res. Lett., 36, L11706, https://doi.org/10.1029/2009GL038217, 2009.
Otto, J., Raddatz, T., Claussen, M., Brovkin, V., and Gayler, V.: Separation of atmosphere-ocean-vegetation feedbacks and synergies for mid-Holocene climate, Geophys. Res. Lett., 36, L09701, https://doi.org/10.1029/2009GL037482, 2009.
Peyron, O., Guiot, J., Cheddadi, R., Tarasov, P., Reille, M., De Beaulieu, J. L., Bottema, S., and Andrieu, V.: Climatic reconstruction in Europe for 18,000 YR B.P. from pollen data, Quaternary Res., 49, 183–196, 1998.
Peyron, O., Jolly, D., Bonnefille, R., Vincens, A., and Guiot, J.: Climate of East Africa 6000 14C yr B.P. as Inferred from Pollen Data, Quaternary Res., 54, 90–101, 2000.
Pickett, E. J., Harrison, S. P., Hope, G., Harle, K., Dodson, J. R., Peter Kershaw, A., Colin Prentice, I., Backhouse, J. , Colhoun, E. A., D'Costa, D., Flenley, J., Grindrod, J., Haberle, S., Hassell, C., Kenyon, C., Macphail, M., Martin, H., Martin, A. H., McKenzie, M., Newsome, J. C., Penny, D., Powell, J., Ian Raine, J., Southern, W., Stevenson, J., Sutra, J., Thomas, I., Kaars, S., and Ward, J.: Pollen-based reconstructions of biome distributions for Australia, Southeast Asia and the Pacific (SEAPAC region) at 0, 6000 and 18,000 14C yr BP, J. Biogeogr., 31, 1381–1444, https://doi.org/10.1111/j.1365-2699.2004.01001.x, 2004.
Prentice, I. C., Guiot, J., Huntley, B., Jolly, D., and Cheddadi, R.: Reconstructing biomes from palaeoecological data: A general method and its application to European pollen data at 0 and 6 ka, Clim. Dynam., 12, 185–194, 1996.
Prentice, I. C. and Jolly, D.: Mid-Holocene and glacial-maximum vegetation geography of the northern continents and Africa, J. Biogeogr., 27, 507–519, 2000.
Reimer, P. J., Bard, E., Bayliss, A., Beck, J. W., Blackwell, P. G., Ramsey, C. B., Buck, C. E., Cheng, H., Edwards, R. L., Friedrich, M., Grootes, P. M., Guilderson, T. P., Haflidason, H., Hajdas, I., Hatté, C., Heaton, T. J., Hoffmann, D. L., Hogg, A. G., Hughen, K. A., Kaiser, K. F., Kromer, B., Manning, S. W., Niu, M., Reimer, R. W., Richards, D. A., Scott, E. M., Southon, J. R., Staff, R. A., Turney, C. S. M., and van der Plicht, J.: IntCal13 and Marine13 Radiocarbon Age Calibration Curves 0–50,000 Years cal BP, Radiocarbon, 55, 1869–1887, https://doi.org/10.2458/azu_js_rc.55.16947, 2013.
Schmidt, G. A., Annan, J. D., Bartlein, P. J., Cook, B. I., Guilyardi, E., Hargreaves, J. C., Harrison, S. P., Kageyama, M., LeGrande, A. N., Konecky, B., Lovejoy, S., Mann, M. E., Masson-Delmotte, V., Risi, C., Thompson, D., Timmermann, A., Tremblay, L.-B., and Yiou, P.: Using palaeo-climate comparisons to constrain future projections in CMIP5, Clim. Past, 10, 221–250, https://doi.org/10.5194/cp-10-221-2014, 2014a.
Schmidt, G. A., Kelley, M., Nazarenko, L., Ruedy, R., Russell, G. L., Aleinov, I., Bauer, M., Bauer, S. E., Bhat, M. K., Bleck, R., Canuto, V., Chen, Y., Cheng, Y., Clune, T.L., Del Genio, A., de Fainchtein, R., Faluvegi, G., Hansen, J. E., Healy, R. J., Kiang, N. Y., Koch, D., Lacis, A. A., Legrande, A. N., Lerner, J., Lo, K. K., Matthews, E. E., Menon, S., Miller, R. L., Oinas, V., Oloso, A. O., Perlwitz, J. P., Puma, M. J., Putman, W. M., Rind, D., Romanou, A., Sato, M., Shindell, D. T., Sun, S., Syed Rahman, A., Tausnev, N., Tsigaridis, K., Under, N., Voulgarakis, A., Yao, M., and Zhang, J.: Configuration and assessment of the GISS ModelE2 contributions to the CMIP5 archive, J. Adv. Model. Earth Syst., 6, 141–184, 2014b.
Shakun, J. D., Clark, P. U., He, F., Marcott, S. A., Mix, A. C., Liu, Z., Otto-Bliesner, B., Schmittner, A., and Bard, E.: Global warming preceded by increasing carbon dioxide concentrations during the last deglaciation, Nature, 484, 49–55, 2012.
Shen, C., Liu, K., Tang, L., and Overpeck, J. T.: Quantitative relationships between modern pollen rain and climate in the Tibetan Plateau, Rev. Palaeobot. Palyno., 140, 61–77, 2006.
Shen, J., Jones, R. T., Yang, X., Dearing, J. A., and Wang, S.: The Holocene vegetation history of lake Erhai, Yunnan province southwestern china: the role of climate and human forcings, The Holocene, 16, 265–276, 2006.
Shen, J., Liu, X., Matsumoto, R., Wang, S., Yang, X., Tang, L., and Shen, C.: Multi-index high-resolution paleoclimatic evolution of sediments in Qinghai Lake since the late glacial period, Sci. China Ser. D, 6, 582–589, 2004 (in Chinese with English abstract).
Shu, J., Wang, W., and Chen, Y.: Holocene vegetation and environment changes in the NW Taihu Plain, Jiangsu Province, East China, Ac. Micropalaeontologica Sin., 2, 210–221, 2007 (in Chinese with English abstract).
Shu, Q., Xiao, J., Zhang, M., Zhao, Z., Chen, Y., and Li, J.: Climate Change in Northern Jiangsu Basin since the Last Interglacial, Geological Science and Technology Information, 5, 59–64, 2008 (in Chinese with English abstract).
Song, M., Zhou, C., and Ouyang, H.: Simulated distribution of vegetation types in response to climate change on the Tibetan Plateau, J. Veg. Sci., 16, 341–350, 2005.
Sun, A. and Feng, Z.: Holocene climate reconstructions from the fossil pollen record at Qigai Nuur in the southern Mongolian Plateau, The Holocene, 23, 1391–1402, 2013.
Sun, L., Xu, Q., Yang, X., Liang, W., Sun, Z., and Chen, S.: Vegetation and environmental changes in the Xuanhua Basin of Hebei Province since Postglacial, J. Geomech., 4, 303–308, 2001 (in Chinese with English abstract).
Sun, Q., Zhou, J., Shen, J., Cheng, P., Wu, F., and Xie, X.: Mid-Holocene environmental characteristics recorded in the sediments of the Bohai Sea in the northern environmental sensitive zone, Sci. China Ser. D, 9, 838–849, 2006 (in Chinese with English abstract).
Sun, X. and Xia, Z.: Paleoenvironment Changes Since Mid-Holocene Revealed by a Palynological Sequence from Sihenan Profile in Luoyang, Henan Province, Acta Scientiarum Naturalium Universitatis Pekinensis, 2, 289–294, 2005 (in Chinese with English abstract).
Sun, X., Wang, F., and Sun, C.: Pollen-climate response surfaces of selected taxa from Northern China, Sci. China Ser. D, 39, 486–493, 1996.
Swann, A. L., Fung, I. Y., Levis, S., Bonan, G. B., and Doney, S. C.: Changes in Arctic vegetation amplify high-latitude warming through the greenhouse effect, P. Natl. Acad. Sci. USA, 107, 1295–1300, 2010.
Sykes, M. T., Prentice, I. C., and Laarif, F.: Quantifying the impact of global climate change on potential natural vegetation, Clim. Change, 41, 37–52, 1999.
Tang, L. and An, C.: Holocene vegetation change and pollen record of drought events in the Loess Plateau, Prog. Nat. Sci., 10, 1371–1382, 2007 (in Chinese with English abstract).
Tang, L. and Shen, C.: Holocene pollen records of the Qinghai-Xizang Plateau, Ac. Micropalaeontol. Sin., 4, 407–422, 1996 (in Chinese with English abstract).
Tang, L., Shen, C., Kong, Z., Wang, F., and Liao, K.: Pollen evidence of climate during the last glacial maximum in Eastern Tibetan Plateau, J. Glaciol., 2, 37–44, 1998 (in Chinese with English abstract).
Tang, L., Shen, C., Li, C., Peng, J., and Liu, H.: Pollen-inferred vegetation and environmental changes in the central Tibetan Plateau since 8200 yr B.P., Sci. China Ser. D, 5, 615-625, 2009 (in Chinese with English abstract).
Tao, S., An, C., Chen, F., Tang, L., Wang, Z., Lv, Y., Li, Z., Zheng, T., and Zhao, J.: Vegetation and environment since the 16.7 cal ka BP in Balikun Lake, Xinjiang, China, Chinese Sci. Bull., 11, 1026–1035, 2010 (in Chinese with English abstract).
Taylor, K. E., Crucifix, M., Braconnot, P., Hewitt, C. D., Doutriaux. C., Broccoli, A. J., Mitchell, J. F. B., and Webb, M. J.: Estimating shortwave radiative forcing and response in climate models, J. Climate, 20, 2530–2543, 2007.
Taylor, K. E., Stouffer, R. J., and Meehl, G. A.: An overview of CMIP5 and the experiment design, B. Am. Meteorol. Soc., 93, 485–498, 2012.
Voldoire, A., Sanchez-Gomez, E., Salas y Melia, D., Decharme, B., Cassou, C.,Senesi, S., Valcke, S., Beau, I., Alias, A., Chevallier, M., Deque, M., Deshayes, J., Douville, H., Fernandez, E., Madec, G., Maisonnave, E., Moine, M., Planton, S., Saint-Martin, D., Szopa, S., Tyteca, S., Alkama, R., Belamari, S., Braun, A., Coquart, L., and Chauvin, F.: The CNRM-CM5.1 global climate model: description and basic evaluation, Clim. Dynam., 40, 2091–2121, 2012.
Wang, H., Liu, H., Zhu, J., and Yin, Y.: Holocene environmental changes as recorded by mineral magnetism of sediments from Anguli-nuur Lake, southeastern Inner Mongolia Plateau, China, Palaeogeogr. Palaeocl., 285, 30–49, 2010.
Wang, S., Lv, H., and Liu, J.: Environmental characteristics of the early Holocene suitable period revealed by the high-resolution sporopollen record of Huguangyan Lake, Chinese Sci. Bull., 11, 1285–1291, 2007 (in Chinese with English abstract).
Wang, X., Wang, J., Cao, L., Yang, J., Yang, X., Peng, Z., and Jin, G.: Late Quaternary Pollen Records and Climate Significance in Guangzhou, Acta Scientiarum Naturalium Universitatis Sunyatseni, 3, 113–121, 2010 (in Chinese with English abstract).
Wang, X., Zhang, G., Li, W., Zhang, X., Zhang, E., and Xiao, X.: Environmental changes during early-middle Holocene from the sediment record of the Chaohu Lake, Anhui Province, Chinese Sci. Bull., 53, 153–160, 2008.
Wang, Y., Wang, S., Jiang, F., and Tong, G.: Palynological records in Xipu section, Yangyuan, J. Geomech., 2, 171–175, 2003 (in Chinese with English abstract).
Wang, Y., Wang, S., Zhao, Z., Qin, Y., Ma, Y., Sun, J., Sun, H., and Tian, M.: Vegetation and Environmental Changes in Hexiqten Qi of Inner Mongolia in the Past 16000 Years, Ac. Geosci. Sin., 5, 449–453, 2005 (in Chinese with English abstract).
Wang, Y., Zhao, Z., Qiao, Y., Wang, S., Li, C., and Song, L.: Paleoclimatic and paleoenvironmental evolution since the late glacial epoch as recorded by sporopollen from the Hongyuan peat section on the Zoigê Plateau, northern Sichuan, China, Geol. Bull. China, 7, 827–832, 2006 (in Chinese with English abstract).
Watanabe, S., Hajima, T., Sudo, K., Nagashima, T., Takemura, T., Okajima, H., Nozawa, T., Kawase, H., Abe, M., Yokohata, T., Ise, T., Sato, H., Kato, E., Takata, K., Emori, S., and Kawamiya, M.: MIROC-ESM 2010: model description and basic results of CMIP5-20c3m experiments, Geosci. Model Dev., 4, 845–872, https://doi.org/10.5194/gmd-4-845-2011, 2011.
Webb III., T.: Global paleoclimatic data base for 6000 yr BP, Brown Univ., Providence, RI (USA), Dept. of Geological Sciences, DOE/EV/10097-6; Other: ON: DE85006628 United States Other: ON: DE85006628 NTIS, PC A08/MF A01, HEDB English, 1985.
Wen, R., Xiao, J., Chang, Z., Zhai, D., Xu, Q., Li, Y., and Itoh, S.: Holocene precipitation and temperature variations in the East Asian monsoonal margin from pollen data from Hulun Lake in northeastern Inner Mongolia, China, Boreas, 39, 262–272, 2010.
Weninger, B., Jöris, O., and Danzeglocke, U.: CalPal-2007, Cologne Radiocarbon Calibration and Palaeoclimate Research Package, available at: http://www.calpal.de/ (last access: 21 June 2019), 2007.
Wischnewski, J., Mischke, S., Wang, Y., and Herzschuh, U.: Reconstructing climate variability on the northeastern Tibetan Plateau since the last Lateglacial – a multi-proxy, dual-site approach comparing terrestrial and aquatic signals, Quaternary Sci. Rev., 30, 82–97, 2011.
Wohlfahrt, J., Harrison, S. P., and Braconnot, P.: Synergistic feedbacks between ocean and vegetation on mid- and high-latitude climates during the mid-Holocene, Clim. Dynam., 22, 223–238, 2004.
Wu, H., Guiot, J., Brewer, S., and Guo, Z.: Climatic changes in Eurasia and Africa at the last glacial maximum and mid-Holocene: reconstruction from pollen data using inverse vegetation modeling, Clim. Dynam., 29, 211–229, 2007.
Wu, H., Luo, Y., Jiang, W., Li, Q., Sun, A., and Guo, Z.: Paleoclimate reconstruction from pollen data using inverse vegetation approach: Validation of model using modern data, Quaternary Sci., 36, 520–529, 2016 (in Chinese with English abstract).
Wu, H., Ma, Y., Feng, Z., Sun, A., Zhang, C., Li, F., and Kuang, J.: A high resolution record of vegetation and environmental variation through the last ∼ 25,000 years in the western part of the Chinese Loess Plateau, Palaeogeogr. Palaeocl., 273, 191–199, 2009.
Xia, Y.: Preliminary study on vegetational development and climatic changes in the Sanjiang Plain in the last 12000 years, Sci. Geogr. Sinica, 8, 241–249, 1988 (in Chinese with English abstract).
Xia, Z., Chen, G., Zheng, G., Chen, F., and Han, J.: Climate background of the evolution from Paleolithic to Neolithic cultural transition during the last deglaciation in the middle reaches of the Yellow River, Chinese Sci. Bull., 47, 71–75, 2002.
Xiao, J., Lv, H., Zhou, W., Zhao, Z., and Hao, R.: Pollen Vegetation and Environmental Evolution of the Great Lakes in Jiangxi Province since the Last Glacial Maximum, Sci. China Ser. D, 6, 789–797, 2007 (in Chinese with English abstract).
Xiao, J., Xu, Q., Nakamura, T., Yang, X., Liang, W., and Inouchi, Y.: Holocene vegetation variation in the Daihai Lake region of north-central China: a direct indication of the Asian monsoon climatic history, Quaternary Sci. Rev., 23, 1669–1679, 2004.
Xiao, X., Haberle, S. G., Shen, J., Yang, X., Han, Y., Zhang, E., and Wang, S.: Latest Pleistocene and Holocene vegetation and climate history inferred from an alpine lacustrine record, northwestern Yunnan Province, southwestern China, Quaternary Sci. Rev., 86, 35–48, 2014.
Xie, Y., Li, C., Wang, Q., and Yin, H.: Climatic Change since 9 ka BP: Evidence from Jiangling Area, Jianghan Plain, China, Sci. Geogr. Sinica, 2, 199–204, 2006 (in Chinese with English abstract).
Xin, X., Wu, T., and Zhang, J.: Introduction of CMIP5 experiments carried out with the climate system models of Beijing climate Center, Adv. Clim. Change Res., 4, 41–49, 2013.
Xu, J.: Analysis of the Holocene Loess Pollen in Xifeng Area and its Vegetation Evolution, Capital Normal University, Master Dissertation, 2006 (in Chinese with English abstract).
Xu, Q., Chen, S., Kong, Z., and Du, N.: Preliminary discussion of vegetation succession and climate change since the Holocene in the Baiyangdian Lake district, Ac. Phytoecol. Geobotan. Sin., 2, 65–73, 1988 (in Chinese with English abstract).
Xu, Q., Yang, Z., Cui, Z., Yang, X., and Liang.: A Study on Pollen Analysis of Qiguoshan Section and Ancestor Living Environment in Chifeng Area, Nei Mongol, Sci. Geogr. Sinica, 4, 453–456, 2002 (in Chinese with English abstract).
Xu, Y.: The assemblage of Holocene spore pollen and its environment in Bosten Lake area Xinjiang, Arid Land Geogr., 2, 43–49, 1998 (in Chinese with English abstract).
Xue, S. and Li, X.: Holocene vegetation characteristics of the southern Loess Plateau in the Weihe River valley in China, Rev. Palaeobot. Palyno., 160 46–52, 2010.
Yang, J., Cui, Z., Yi, Zhao., Zhang, W., and Liu, K.: Glacial Lacustrine Sediment's Response to Climate Change since Holocene in Diancang Mountain, Ac. Geogr. Sin., 4, 525–533, 2004 (in Chinese with English abstract).
Yang, X., Wang, S., and Tong, G.: Character of anology and changes of monsoon climate over the last 10000 years in Gucheng Lake, Jiangsu province, J. Integr. Plant Biol., 7, 576–581, 1996 (in Chinese with English abstract).
Yang, Y. and Wang, S.: Study on mire development and paleoenvironment change since 8.0 ka BP in the northern part of the Sangjiang Plain, Sci. Geogr. Sinica, 23, 32–38, 2003 (in Chinese with English abstract).
Yang, Y., Huang, C., Wang, S., and Kong, Z: Study on the mire development and palaeogeographical environment change since the early period of the Holocene in the east part of the Xiliaohe Plain, Sci. Geogr. Sinica, 21, 242–249, 2001 (in Chinese with English abstract).
Yang, Z.: Reconstruction of climate and environment since the Holocene in Diaojiaohaizi Lake Area, Daqing Mountains,Inner Mongolia, Ac. Ecol. Sin., 4, 538–543, 2001 (in Chinese with English abstract).
Yu, L., Wang, N., Cheng, H., Long, H., and Zhao, Q.: Holocene environmental change in the marginal area of the Asian monsoon: a record from Zhuye Lake, NW china, Boreas, 38, 349–361, 2009.
Yukimoto, S., Adachi, Y., Hosaka, M., Sakami, T., Yoshimura, H., Hirabara, M., Tanaka, T. Y., Shindo, E., Tsujino, H., Deushi, M., Mizuta, R., Yabu, S., Obata, A., Nakano, H., Koshiro, T., Ose, T., and Kitoh, A.: A new global climate model of the meteorological research institute: MRI-CGCM3-model description and basic performance, J. Meterol. Soc. Jpn., 90, 23–64, 2012.
Zhang, W., Mu, K., Cui, Z., Feng, J., and Yang, J.: Record of the environmental change since Holocene in the region of Gongwang mountain, Yunan Province, Earth Environ., 4, 343–350, 2007 (in Chinese with English abstract).
Zhang, Y. G., Pagani, M., and Liu, Z.: A 12-Million-Year Temperature History of the tropical Pacific Ocean, Science, 344, 84–87, 2014.
Zhang, Y. and Yu, S.: Palynological assemblages of late Quaternary from the Shenzhen region and its paleoenvironment evolution, Mar. Geol. Quatern. Geol., 2, 109–114, 1999 (in Chinese with English abstract).
Zhang, Y., Jia, L., and Lyu, B.: Studies on Evolution of Vegetation and Climate since 7000 Years ago in Estuary of Changjiang River Region, Mar. Sci. Bull., 3, 27–34, 2004 (in Chinese with English abstract).
Zhang, Y., Song, M., and Welker, J. M.: Simulating Alpine Tundra Vegetation Dynamics in Response to Global Warming in China, in: Global Warming, edited by: Harris, S. A., InTech, 11, 221–250, 2010.
Zhang, Z., Xu, Q., Li, Y., Yang, X., Jin, Z., and Tang, J.: Environmental changes of the Yin ruins area based on pollen analysis, Quaternary Sci., 27, 461–468, 2007 (in Chinese with English abstract).
Zhao, J., Hou, Y., Du, J., and Chen, Y.: Holocene environmental changes in the Guanzhong Plain, Arid Land Geogr., 1, 17–22, 2003 (in Chinese with English abstract).
Zhao, Y., Yu, Z., Chen, F., Ito, E., and Zhao, C.: Holocene vegetation and climate history at Hurleg Lake in the Qaidam Basin, northwest China, Rev. Palaeobotany Palynology, 145, 275–288, 2007.
Zheng, R., Xu, X., Zhu, J., Ji, F., Huang, Z., and Li, J.: Division of late Quaternary strata and analysis of palaeoenvironment in Fuzhou Basin, Seismol. Geol., 4, 503–513, 2002 (in Chinese with English abstract).
Zheng, X., Zhang, H., Ming, Q., Chang, F., Meng, H., Zhang, W., Liu, M., and Shen, C.: Vegetational and environmental changes since 15ka B.P. recorded by lake Lugu in the southwest monsoon domain region, Quaternary Sci., 6, 1314–1326, 2014 (in Chinese with English abstract).
Zhou, J., Liu, D., Zhuang, Z., Wang, Z., and Liu, L.: The sediment layers and the records of the Paleoenvironment in the Chaoyanggang Lagoon,Rongcheng City of Shandong Province Since Holocene Transgression, Periodical of Ocean University of China, 38, 803–808, 2008 (in Chinese with English abstract).
Zhu, C., Ma, C., Zhang, W., Zheng, C., Tan, L., Lu, X., Liu, K., and Chen, H.: Pollenrecord from Dajiuhu Basin of Shennongjia and environmental changes since 15.753 ka BP, Quaternary Sci., 5, 814–826, 2006 (in Chinese with English abstract).
Zou, S., Cheng, G., Xiao, H., Xu, B., and Feng, Z.: Holocene natural rhythms of vegetation and present potential ecology in the western Chinese Loess Plateau, Quatern. Int., 194, 55–67, 2009.