the Creative Commons Attribution 4.0 License.
the Creative Commons Attribution 4.0 License.
 | 29 Aug 2019
The longest homogeneous series of grape harvest dates, Beaune 1354–2018, and its significance for the understanding of past and present climate
Thomas Labbé
Christian Pfister
Stefan Brönnimann
Daniel Rousseau
Jörg Franke
Benjamin Bois
Records of grape harvest dates (GHDs) are the oldest and the longest continuous phenological data in Europe. However, many available series, including the well-known (Dijon) Burgundy series, are error prone because scholars so far have uncritically drawn the data from 19th century publications instead of going back to the archives. The GHDs from the famous vine region of Beaune (Burgundy) were entirely drawn from the archives and critically cross-checked with narrative evidence. In order to reconstruct temperature, the series was calibrated against the long Paris temperature series comprising the 360 years from 1659 to 2018. The 664-year-long Beaune series from 1354 to 2018 is also significantly correlated with tree-ring and documentary proxy evidence as well as with the central European temperature series (from 1500). The series is clearly subdivided into two parts. From 1354 to 1987 grapes were on average picked from 28 September on, whereby during the last 31-year-long period of rapid warming from 1988 to 2018 harvests began 13 d earlier. Early harvest dates are shown to be accompanied by high pressure over western–central Europe and atmospheric blocking over Denmark. The 33 extremely early harvests comprising the fifth percentile bracket of GHDs are unevenly distributed over time; 21 of them occurred between 1393 and 1719, while this is the case for just 5 years between 1720 and 2002. Since the hot summer of 2003, 8 out of 16 spring–summer periods were outstanding according to the statistics of the last 664 years, no less than 5 among them within the last 8 years. In the Paris temperature measurements since 1659, April-to-July temperature reached the highest value ever in 2018. In sum, the 664-year-long Beaune GHD series demonstrates that outstanding hot and dry years in the past were outliers, while they have become the norm since the transition to rapid warming in 1988.
- Article
(5853 KB) -
Supplement
(301 KB) - BibTeX
- EndNote


Since the Middle Ages the opening day of the grape harvest each year in a given territory is the outcome of a collective decision. Both in pre-industrial history, when authorities set an official ban after which it was permitted for everybody to pick up the grapes, and in recent history, the opening day of grape harvest has always produced an important amount of documentary data. Records of grape harvest dates (GHDs) provide the longest continuous series of phenological data in Europe and have been repeatedly used for estimating spring–summer temperatures (Chuine et al., 2004; Guiot et al., 2005; Menzel, 2005; Le Roy Ladurie et al., 2006; Meier et al., 2007; Krieger et al., 2011; Garcia de Cortázar-Atauri et al., 2010; Daux et al., 2012; Rousseau, 2015). In the literature, the GHD series (1385–1905) from the town of Dijon, situated in Burgundy (France; see Fig. 1), is the longest available series. Going back to the late 14th century, it constitutes the backbone of all the reconstructions of Burgundian GHD series. The most widely quoted article published by Chuine et al. (2004) in Nature provides a “Burgundian” GHD dataset (1370–2003) in which Dijon GHDs constitute the reference series.
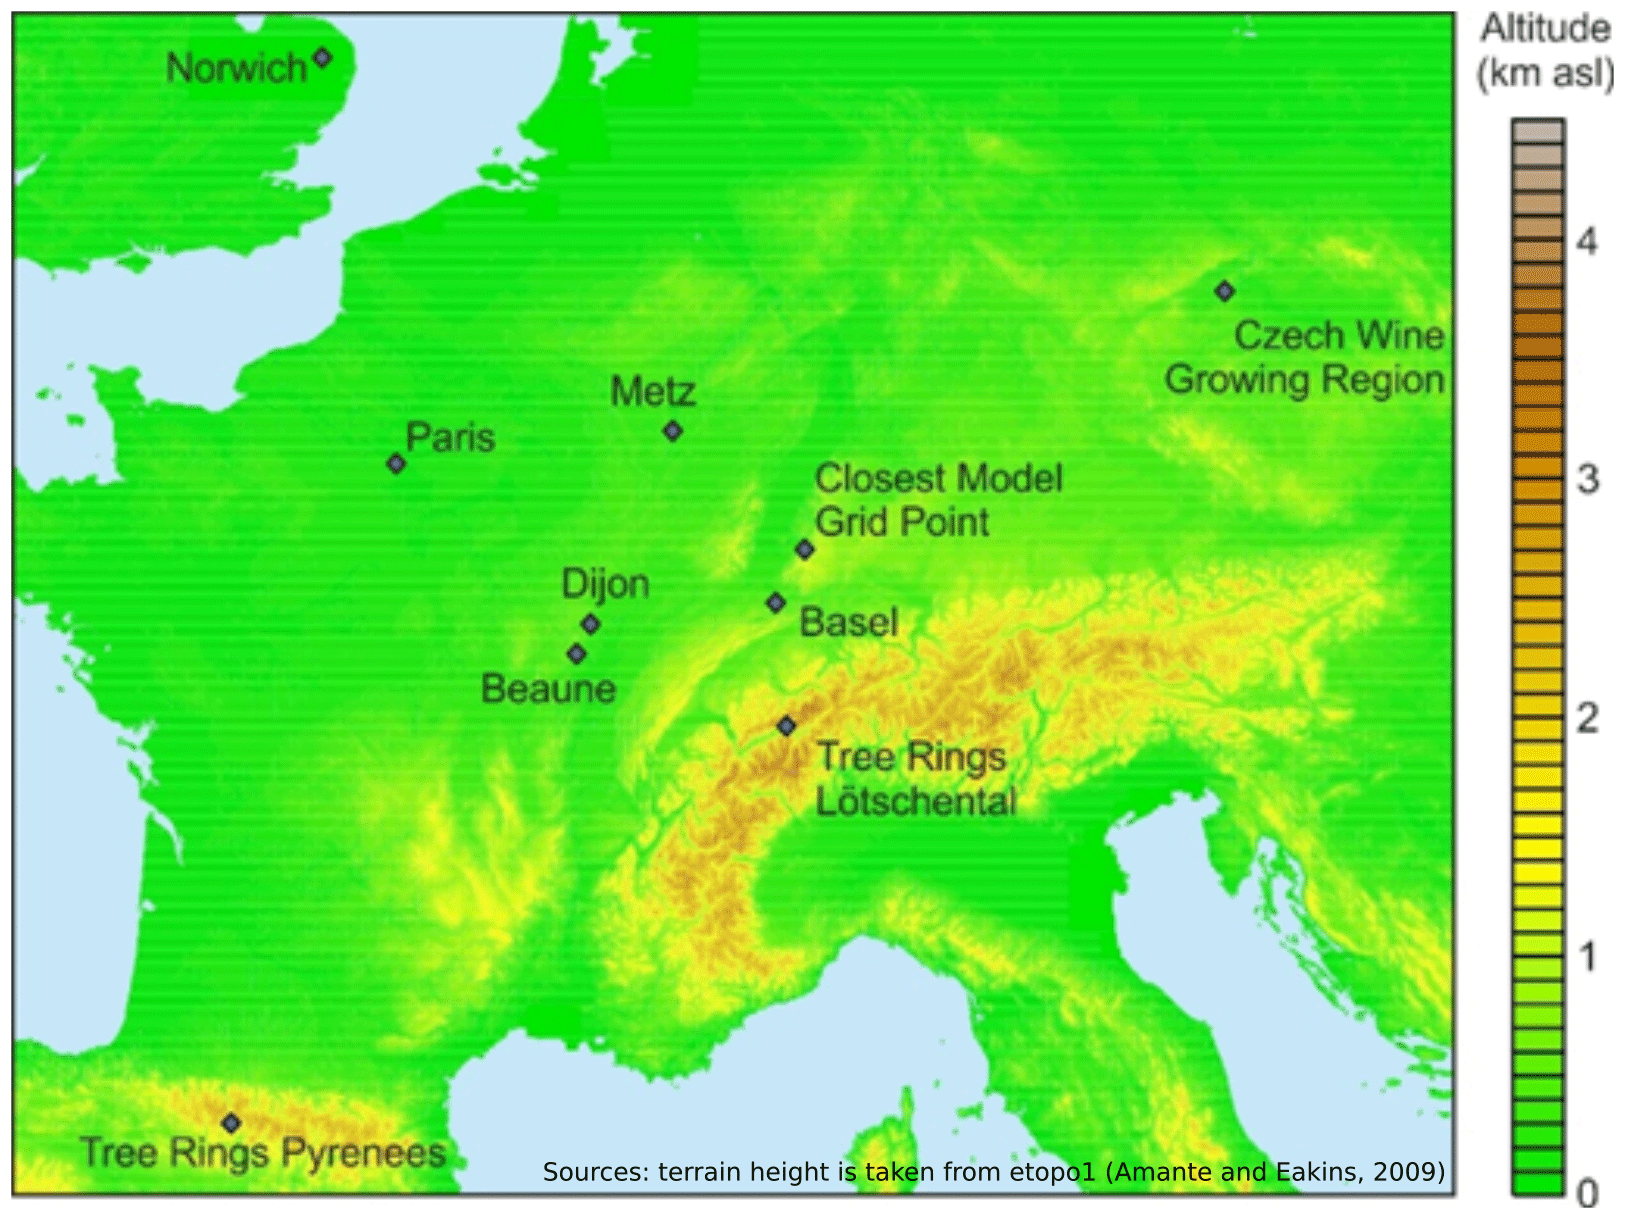
Figure 1Geographical area of the study (taken from Amante and Eakins, 2019).
However, two biases affect the reliability of this dataset. First, scholars have until now uncritically drawn on the data from 19th century publications. The original data of the Dijon series have been recently revisited directly in the local archives (Labbé and Gaveau, 2011), and this reassessment makes it obvious that the formerly published “Dijon series” is thoroughly unreliable due to compilation errors. Secondly, the available Burgundian GHD dataset is not homogeneous. Due to a lack of information concerning Dijon, where the vineyard slowly disappeared starting in the 19th century because of urbanisation, the series is complemented for the 18th–20th centuries by a mix of data taken from different locations disseminated throughout the vineyard region of Burgundy.
An entirely unedited series based on manuscript material discovered in the archives of the town of Beaune, situated 45 km south of Dijon, has recently been collected for the period 1371–2010 (Labbé and Gaveau, 2013a). Unlike Dijon, Beaune is still surrounded with vineyards situated at altitudes between 220 and 300 m (Fig. 2). Since the end of the Middle Ages the territory of the city has been dominated by the cultivating of grapes. The region produces labelled wines certified by the Appellation d'Origine Contôlée system. In this paper, we have extended the series back to 1354 and updated it to 2018. It is validated using the long Paris temperature series that goes back to 1658 (Rousseau, 2009, 2013, updated to 2018) and used to assess April-to-July temperatures from 1354 to 2018. The phenological data are available on the Euro-Climhist data platform: http://www.euroclimhist.unibe.ch/en/, last access: 15 July 2019), while reconstructed temperatures are included in the Supplement.
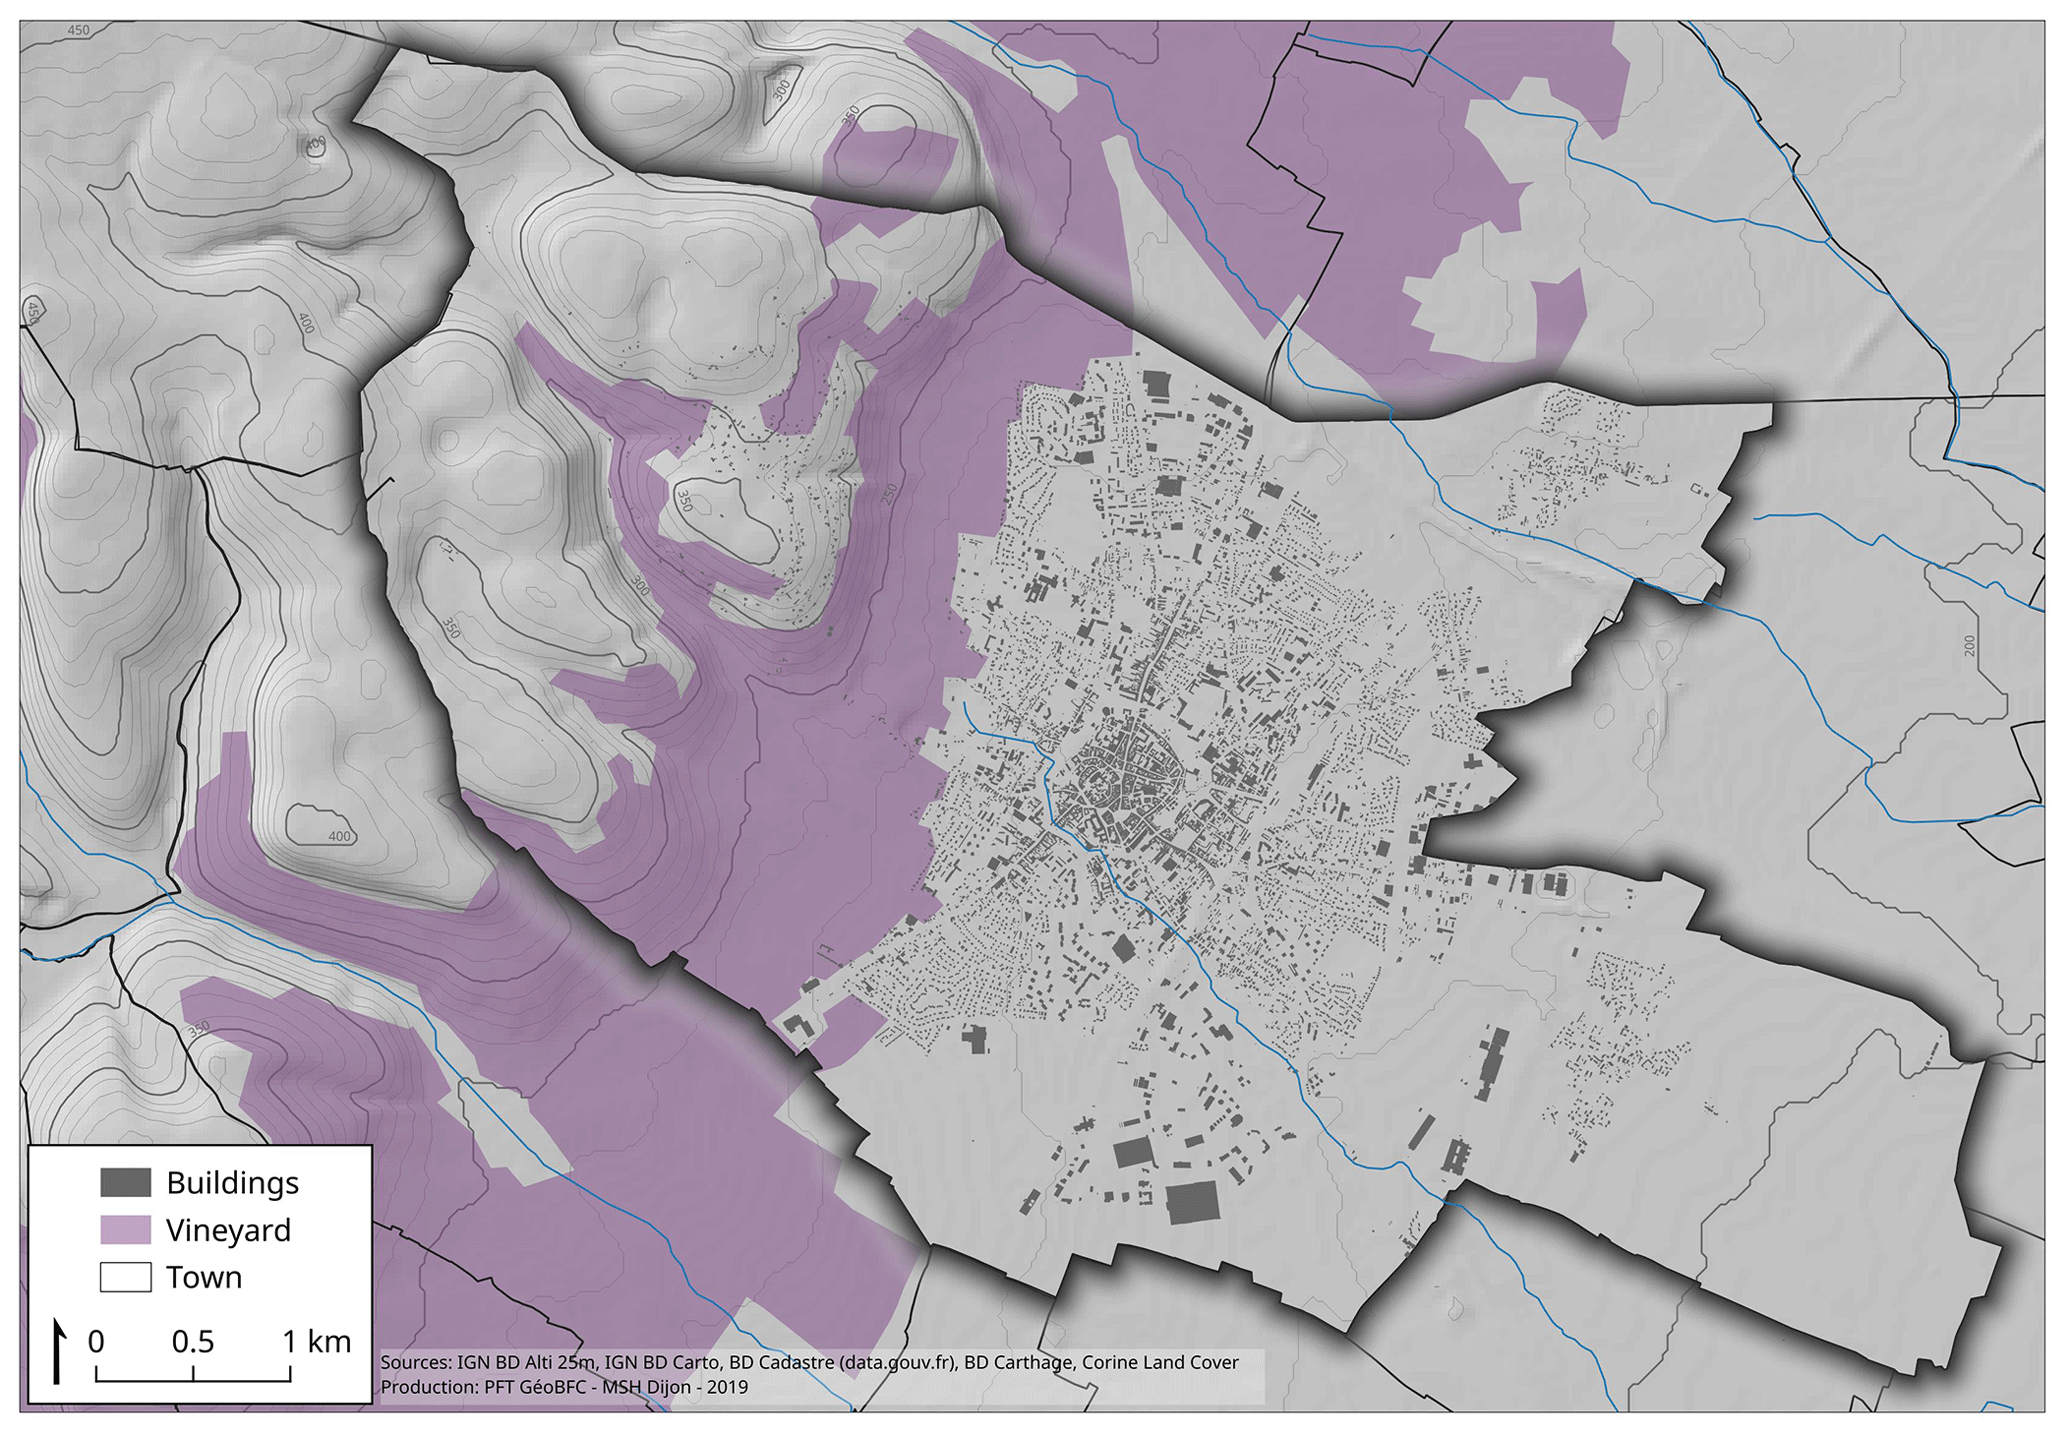
Figure 2The vineyard of the city of Beaune.
The study is organised as follows. The first section reviews the former Burgundian GHD series, highlighting its inadequacies. The second section presents the generation of the new Beaune series. Section 3 outlines the methodological steps used for reconstructing April-to-July temperatures from 1354 to 2018 and for checking the reliability of the data. In Sect. 4 the Beaune series is presented and compared to other GHD series, other documentary data series, and tree-ring evidence. This section also provides the reconstruction of April-to-July temperatures from 1354 to 2018 and a detailed analysis of two extremely early years. In the last section we summarise the main conclusions that can be drawn from the study, in particular in view of comparing isolated outliers in the remote past with the increasing frequency of such events in the last 3 decades of rapid warming.
2.1 The inadequacies of the “Dijon–Burgundian” GHD series
Etienne Noirot, a land surveyor in Dijon, is one the first scientists who showed some interest in long GHD time series. In 1836, he gathered a Dijon GHD series from 1385 to his time, mainly to demonstrate that climate had not changed significantly for 500 years (Noirot, 1836). In the course of the cold fluctuation leading to the glacier maximum around 1850 (Nussbaumer and Zumbühl, 2018), GHDs became important for scientists as indicators of past climate (Labbé and Gaveau, 2013b). In this context Lavalle (1855) republished the same dataset for the period 1366–1842. His series forms the backbone of all further publications using the Dijon evidence. In the early 1880s Alfred Angot, Director of the Paris Meteorological Research Office, instructed the meteorological commissions of the departments to extract grape harvest dates from documentary sources and assembled a compilation of 606 GHD series from France, Switzerland and Germany. This publication was a milestone in the field. The Dijon series, continued up to 1879, constitutes the longest series of his data compilation (Angot, 1885). The German geographer Eduard Brückner, son of a historian, attempted an analysis of GHDs based on Angot's data in his 1890 study on climatic change since 1700 (Stehr and von Storch, 2000). The French historian Emmanuel Le Roy Ladurie evaluated the Angot data for his synthesis on climate changes since 1000 CE (Le Roy Ladurie, 1971, 2004).
Subsequently, three main sources of inhomogeneity have to be addressed concerning available Burgundian GHDs.
2.2 Flawed data
First, the “Dijon series” is riddled with printing, typing and copying errors. The investigation of the original archives from the city council in Dijon shows 132 differences with the Angot series for the period 1385 to 1879 (Labbé and Gaveau, 2011). The mismatches reach 5–10 d for 17 years, 10–20 d on nine occasions, and more than 20 d in 1448, 1522, 1523, 1540, 1659, 1660 and 1842. A serious mismatch concerns the year 1540. According to the available material on the internet (Chuine et al., 2004), the GHD in this year is estimated to be 4 October (day of year (DOY) 278), whereas the correct date found in the archive is 3 September (DOY 247; Labbeé and Gaveau, 2011). This flaw is the main reason why the outstanding extreme spring–summer temperature of this year (Wetter and Pfister, 2013; Wetter et al., 2014) was overlooked in the Nature article by Chuine et al. (2004). In particular, Angot's series is especially not reliable prior to 1420, in the first half of the 16th century, around 1840 and for several isolated years (Fig. 3).
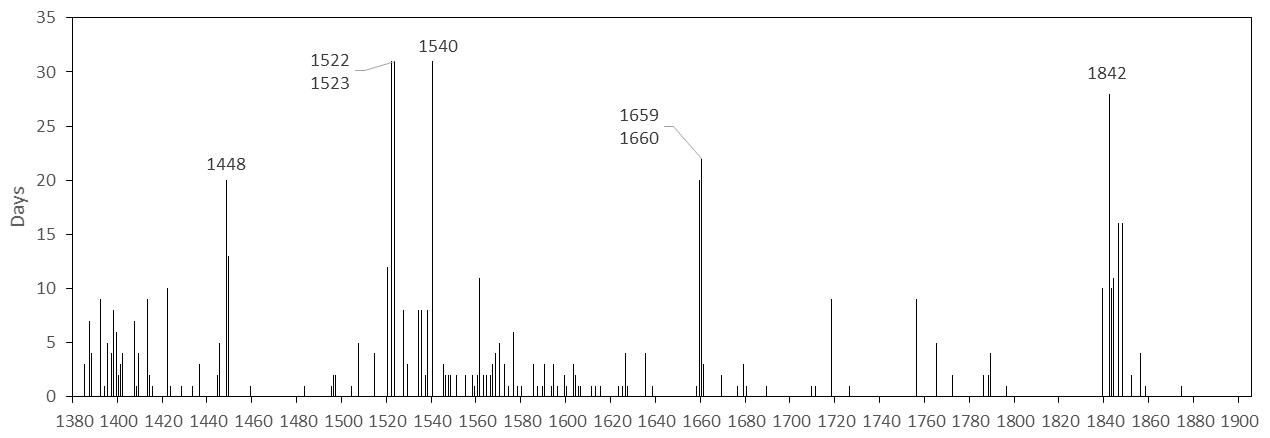
Figure 3Mismatches between the Angot 1885 and Labbé-Gaveau 2011 Dijon GHD series (1385–1905).
2.3 Lack of homogeneity
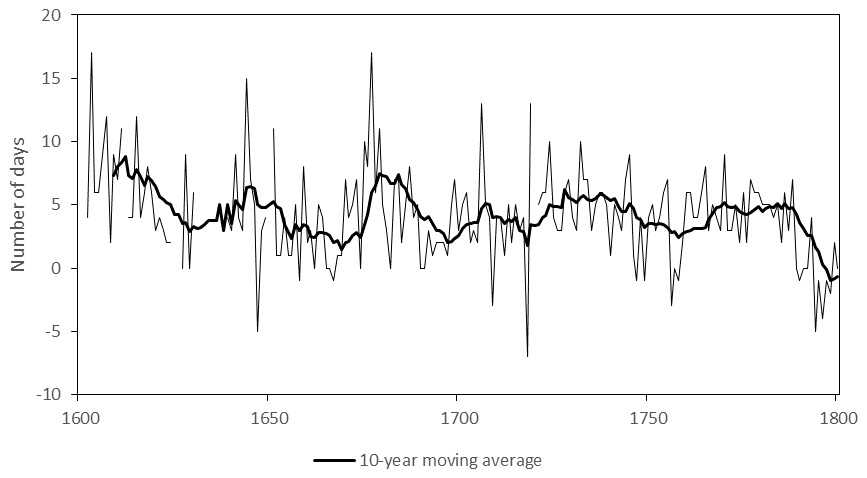
The vineyards around Dijon were built over starting from the early 19th century. As of 1906 the city council no longer set an official ban date. For the 19th and 20th century the Dijon series was thus complemented with data from the southern part of the Burgundian vine-growing area without, however, taking into account the resulting differences in mean grape ripening. It needs to be known that Dijon is situated at the northernmost point of the Burgundian wine region (Fig. 1), which involves a delay in the mean date of grape harvest compared to other locations along the latitudinal (north–south) orientation of the Burgundian wine area. Grapes in Dijon between 1600 and 1800 were picked on average 5 d after those in the town of Beaune (Fig. 4). In fact, the Burgundian series used by Chuine et al. (2004) indiscriminately combines the pre-1800 Dijon series with the 19th and 20th century evidence from the southern part of the Burgundian vine area.
2.4 Assembling a 664-year-long GHD series for Beaune
To correct for the above-mentioned inadequacies we constructed a new 664-year-long almost homogenous and nearly uninterrupted series of GHDs, focussing the archival study on the Beaune vine-growing area (available on the Euro-Climhist data platform; https://echdb.unibe.ch/, last access: 15 July 2019). Thereby, we used different kinds of archival information.
Wage payment data (1354–1506). Late medieval accounts can be used as a source of day-specific information about the actual start and end of agricultural work (Brázdil and Kotyza, 1999; Wetter and Pfister, 2011, 2013; Pribyl et al., 2012).
In the case of Beaune, data on daily wage payments made to day labourers for picking grapes are available from 1354 to 1506. The oldest accounts were kept for a ca. 18 ha domain owned by the dukes of Burgundy. The start dates of the harvest (1354–1426) on these estates have already been published (Guerreau, 1995). Nevertheless, the most detailed and numerous series of accounts refers to the ca. 10 ha domain of the church chapter of Notre-Dame in Beaune, for which we could find, almost without any lacunae, unedited GHDs from 1371 to 1506. The parcels documented in these accounts have been continuously planted with vines since the late Middle Ages. Thus, these GHDs are related to the maturity of grapes in domains such as Corton Clos-du-Roi, Beaune–Sanvignes, Beaune–Tuvillains and Beaune–Bressandes, among others, which today produce first-class red wines designated as Grand cru, Premier cru or Beaune village. The “Beaune” wine produced in these domains already had a reputation for quality in the 13th century (Dion, 1959). The chapter of Notre-Dame sold, for example, barrels of wine to the merchants of the king of France and to other key persons. It is, however, not known which grape varieties were grown on these estates. Fine red and “clairet” (almost rosé) wines, massively produced during the Middle Ages, were made with varieties of Pinot noir, while Gamay was rated second class. In 1395 the duke of Burgundy even prohibited the cultivation of Gamay vines around the cities of Dijon, Beaune and Chalon-sur-Saône. But in reality his direction never became effective (Dion, 1959). In any case, the documentation on grape harvests never refers to the varieties cultivated in the domains. Nonetheless, these data are very reliable and even identify in which parcel the grapes were picked on a specific day and how many male and female labourers were at work.
Meetings of the Notre-Dame Church chapter (1507–1699). In 1506 both aforementioned estates were leased out to tenants, so precise information on their cultivation was no longer kept in the accounting documentation. At the same time, the deliberations of the city council on the vintage ban are fragmentary prior to 1700. The books of deliberations of the Notre-Dame Church chapter of Beaune offer an acceptable substitute. This documentation provides the date of the last meeting before the vacation of the chapter that had to organise the harvest. As church chapter meetings took regularly place twice a week, 3 d were added to the date of the last meeting to assess the harvest date. Since 1583, the books of deliberation indicate at what time the members of the chapter had to organise the food supply needed to feed the day labourers during the harvest. With regard to getting perishable food such as cheese and meat, it was assumed that the harvest began 8 d later. The accuracy of these estimations, though we must admit some uncertainties, is confirmed by the comparison of fragmentary preserved official ban dates set by the city of Beaune for a few years within this period, as summarised in Table S1 in the Supplement.
Deliberations of the city council (1700 to 1965). From 1700 onwards the books of deliberation of the city council are continuously preserved, and the opening date of the harvest can be easily deduced. However, setting the vintage ban is a social outcome and does not depend only on the observation of the full maturity of grapes. It resulted from a consensus between vine growers and the local town administration. In practice, experts inspected the maturity of the grapes and proposed a ban date to the city council. The city council then took a decision, also considering the availability of day labourers coming from outside for harvesting as well as eventual military threats and plague outbreaks, as Garnier et al. (2011) have shown for Besançon (eastern France). In the case of Beaune, the main bias that potentially affects the date of setting the ban in the long run is nonetheless different. After the French Revolution, the reorganisation of the territory into administrative districts called “arrondissements” induced a change in the decision-making process. The dates of the ban now resulted from a consensus among the mayors of all villages contained in the Beaune arrondissements. Though Beaune continues to play a major role in the decision process, the lifting of the harvest ban subsequently concerned a larger area than before, extending more to the south. Furthermore, the outbreak of the phylloxera disease after 1870 induced a new organisation of the vine sector in Burgundy in which local institutions lost further influence in regulating the harvest on their territory. From the second half of the 20th century up to 2007, prefects promulgated a uniform harvest ban which no longer considered local conditions. Moreover, to avoid dealing with requests for harvesting prior to the official date, the prefectoral ban tended to be artificially early, which affected the value for 2003 in the Dijon series (Chuine et al., 2004). Therefore, another kind of information was used after 1965.
Newspaper reports (1966 to 2018). From 1966 articles in the local newspaper “Le Bien Public” are used. Every year an article reports the date when vine growers start the harvest in the town vineyard. These dates are closer to reality than the official bans set by prefectoral decrees. Between 1980 and 2007 the Pearson correlation coefficient r between the Beaune “newspaper” GHDs and mean April-to-July (AMJJ) temperatures of Paris is stronger () than with the official administrative GHD (). In 2007, the official opening of GHD was set on 13 August, whereas winegrowers actually began the harvest in the territory of Beaune on 1 September according to the newspapers.
2.5 Interpolations
Despite an exhaustive investigation in the local archives, 61 dates for Beaune are still missing before 1645. To fill in these lacunae, when possible we used the evidence of the corrected Dijon series (Labbé and Gaveau, 2011), taking into account the mean difference of days between the two raw series.
The dates from 1358 to 1364 have been taken from the Torino GHD series (Rotelli, 1973), taking into account the mean differences of days between the two series.
Certain dates are affected by regional political and military biases and need to be interpolated with an extra-regional series, e.g. the corrected Swiss series (Wetter and Pfister, 2013). The political situation was particularly critical in the region of Beaune and Dijon in the context of the Thirty Years' War (1618–1648). As in the nearby city of Besançon, documentary records are sketchy in the second quarter of the 17th century because troop movements often prevented winegrowers from properly organising the harvest (Garnier et al., 2011). In Beaune, the archives do not provide any data from 1631 to 1638, which constitutes the longest undocumented period of the series. We interpolated these data from the Dijon series, but the dates for 1636 (4 September) and 1637 (3 September) still turned out to be artificially early in comparison with the series from the Swiss Mittelland, respectively 5 October and 1 October (Wetter and Pfister 2013). In 1636, the city council deliberations of Beaune inform us that the region was actually threatened by both enemy troops and by an outbreak of plague, which certainly disorganised the harvest process. For 1636 and in 1637, we have then interpolated the dates with the Swiss series.
2.6 Homogenisation
A comparison of Beaune GHD times series with the GHDs from nearby regions in Switzerland (Wetter and Pfister, 2013), the Czech lands (Možný et al., 2016), and Salins and Aubonne in France (Angot, 1885) makes it obvious that the Beaune GHDs are artificially early before ca. 1718 (Fig. 5). In the period 1599–1875, for which we can compare the four time series without lacunae, the stability of the mean GHD is stronger in Switzerland, in the Czech lands, in Salins and in Aubonne (Jura, France), whereas in Beaune the average GHD occurred 7 d earlier before 1718 (21 September) than after this date (28 September) (Table 1).
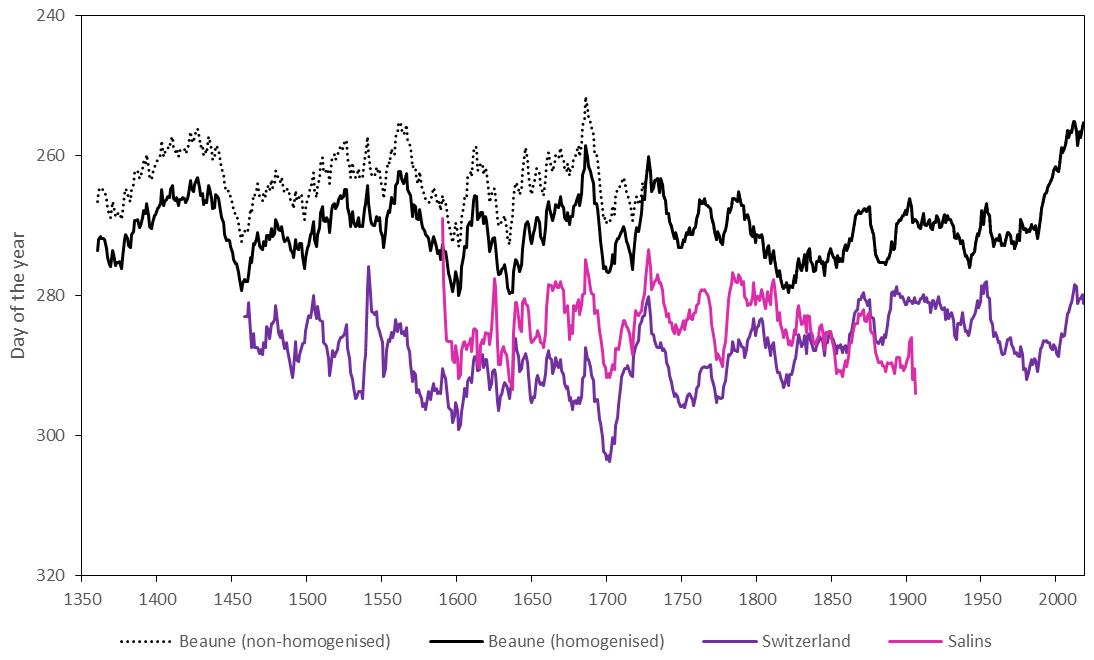
Figure 5An 11-year low-pass-filtered GHD series of Beaune (homogenised and non-homogenised), Switzerland (Wetter and Pfister, 2013) and Salins (Angot, 1885).
Table 1Comparison of mean GHD time series in Beaune (this article), Aubonne (Angot, 1885), Salins (Angot, 1885), Switzerland (Wetter and Pfister, 2013) and Czech lands (Možný et al., 2016).
In the perspective of reconstructing past spring–summer temperatures, this bias must be taken into account. Otherwise it would have mean April-to-July GHD temperature-based reconstructions with maxima and minima ca. 1 ∘C warmer before 1718 than afterwards on the decadal scale, even though temperature measurements available in France since 1658 do not provide any evidence of such a warming during the period 1658–1718. To homogenise the Beaune GHD series we have then added 7 d to raw data prior to 1718. The Pearson correlation with April-to-July mean temperature in Paris for the period 1658–2018 is stronger with the homogenised Beaune GHD time series (r=0.76) than with the non-homogenised one (r=0.74).
Anthropogenic changes in winemaking are the most likely explanation. This break is actually synchronous with a very important change in Burgundian practices of grape cultivation. The early 18th century is a turning point in wine history. The production and commercialisation of wines shifted to a new model distinguishing between ordinary and fine wines and focussing upon more coloured and longer-keeping red wines (Dion, 1959; Lachiver, 1988). In Burgundy, the turnaround is described in a treatise written in 1728 by Claude Arnoux, who referred to the emerging distinction between short- and long-keeping wines (Arnoux, 1728). Unlike the production of the common clairet wines produced in premodern Burgundy, the manufacturing of stronger wines called for harvesting more mature grapes (Lachiver, 1988). In the course of the 18th century, agronomists all underlined the fact that more mature grapes favour the process of fermentation and can prevent the acidification of wines. The works of Jean-Antoine Chaptal (Chaptal, 1807), who gave his name to the process of chaptalisation, i.e. the addition of sugar to grape must, illustrate this evolution. A similar retardation of mean harvest dates is also known from the region of Montpellier and Beziers in the same period (Blanchemanche, 2009).
Our homogenisation approach is based on arguments of viticulture history. Statistical homogenisation might reveal further inhomogeneities. Based on simple visual tests (Craddock, 1979) we estimate a remaining error of 7 d or less.
The new Beaune GHD series was first compared with other grape harvest series as well as with other climate-related proxy time series to test its robustness. Then it was used to reconstruct April-to-July temperature back to 1354. Furthermore, years with extremely early GHDs in Beaune were analysed climatologically, with a special emphasis on atmospheric blocking.
3.1 Comparison with other time series
The quality of the improved series was first tested, involving the long Swiss GHD series from 1444 to 2012 (Wetter and Pfister, 2013) and the long series of the Czech lands (from 1499 to 2015) (Možný et al., 2016). Additionally, we have investigated the similarity between the grape harvest dates and tree-ring-based temperature reconstructions. Two tree-ring-based temperature reconstructions are chosen from the N-TREND dataset (Wilson et al., 2016). This is a global dataset containing the best tree-ring-based temperature reconstructions selected by experts in the field. The spatially closest reconstructions in N-TREND are from the Spanish Pyrenees (Dorado Liñán et al., 2012) and from the Swiss Alps (Büntgen et al., 2006).
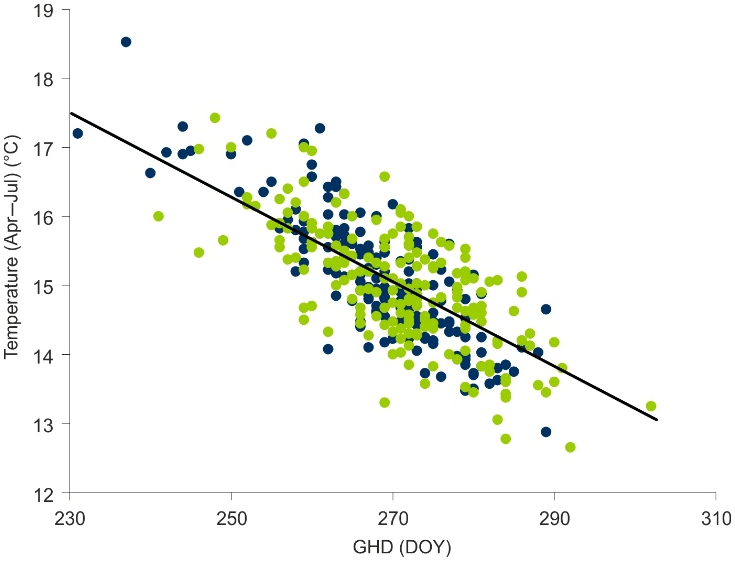
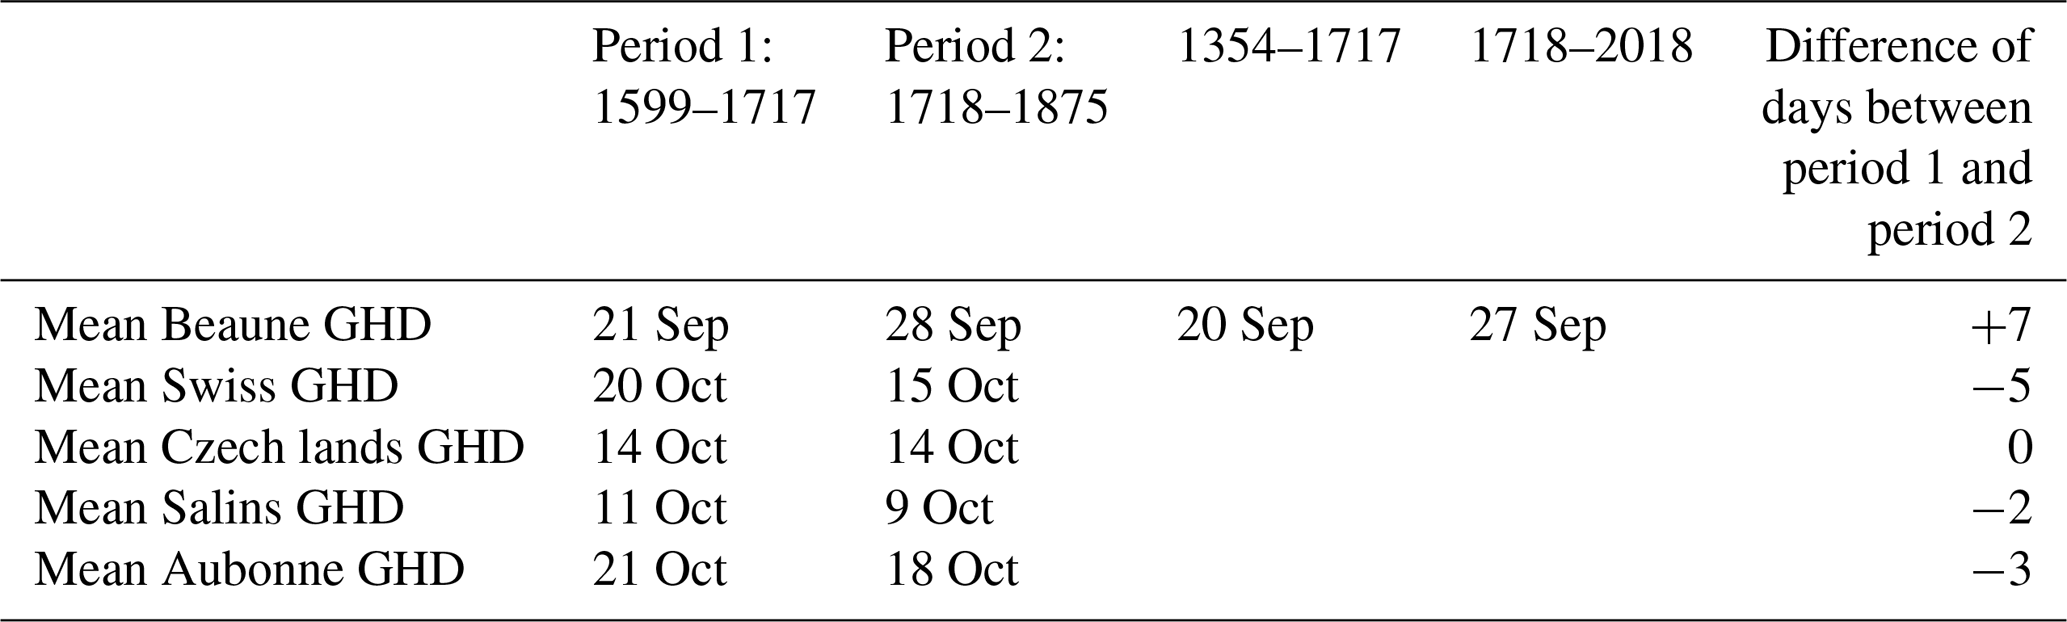
Figure 6Relation between April-to-July mean temperature (∘C) in Paris and Beaune GHDs. Green dots indicate the calibration period, and blue dots the evaluation period. The linear regression line is shown.
The first part of the Beaune series (1354 to 1431) was compared with estimated April-to-July temperatures in Norfolk (southeast England) obtained from the first dates of wages paid to grain harvest workers (Pribyl, 2017). The second part of the series was compared with the detailed GHDs obtained for the period 1420 to 1537 in Metz (France) (Litzenburger, 2015). The last part was correlated with the estimated April-to-July temperatures in central Europe from 1500 to 1759 that are based on Pfister indices from Germany, the Czech lands and Switzerland (Dobrovolný et al., 2010). Likewise, the Beaune GHDs were compared with the series for Switzerland and the Czech lands (Fig. 7).
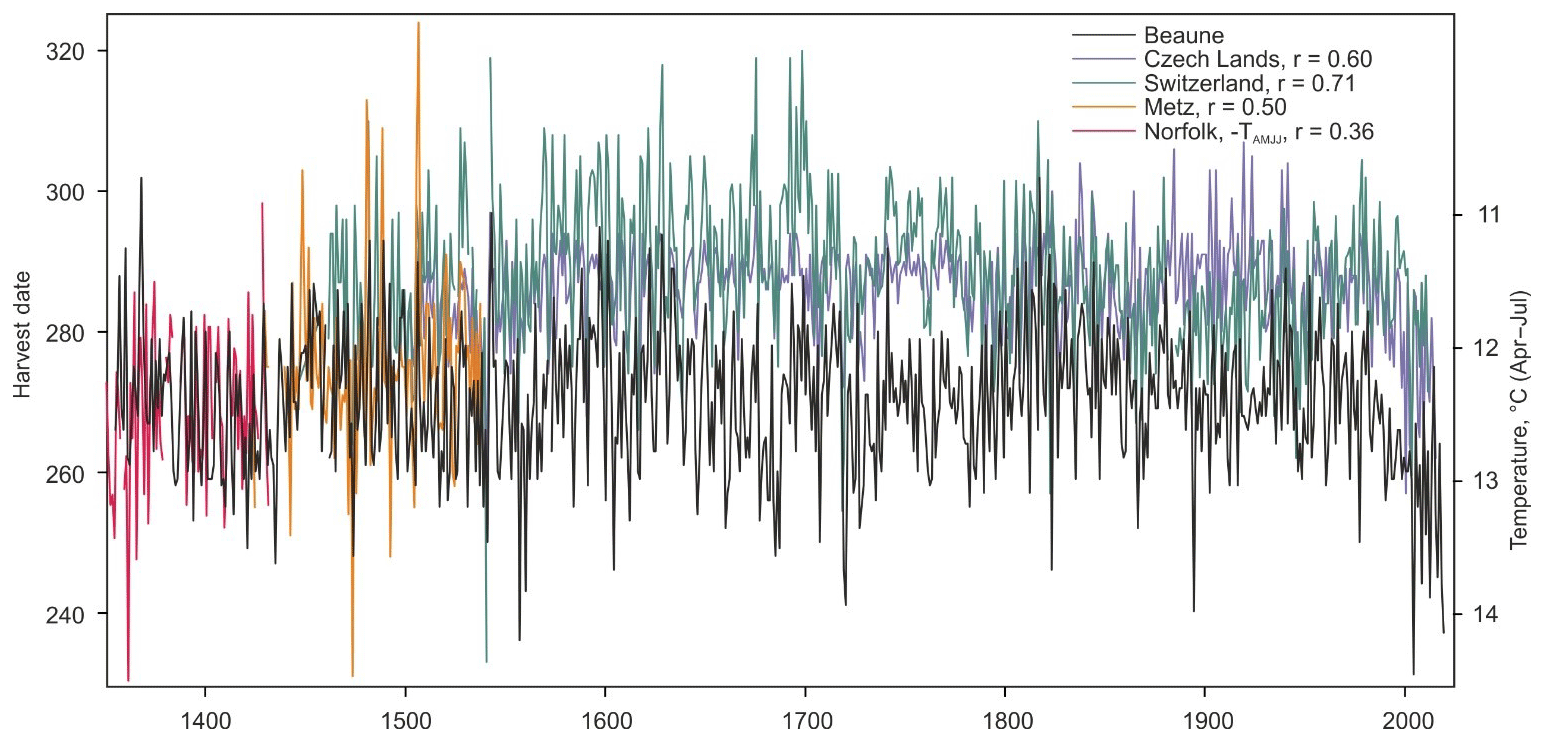
Figure 7Comparison of times series of GHDs from Beaune (this work), Czech lands (Možný et al., 2016), Switzerland (Wetter and Pfister, 2013), and Metz (Litzenburger, 2015), as well as temperature reconstructions for Norfolk (Pribyl et al., 2012; right scale, inverted). The number indicates the correlation between the series prior to 1850.
3.2 Statistical models
We compared the GHD series not only with indirect climate observations, but also directly with temperature (Fig. 6). Both forward (i.e. reconstruction of GHDs from temperatures, denoted F) and backward (i.e. reconstruction of temperatures from GHDs, denoted B) reconstruction models were used. Correlating GHDs month by month with Paris mean temperature from 1659 to 2018 (Rousseau, 2009, updated to 2018), we found statistically significant correlations between GHD and temperature for all months from March to September. Enologically, using August and September is questionable, in line with the results of stepwise regression analysis attempted by Legrand (1979), Pfister (1984) and Guerreau (1995), especially as in Beaune harvest sometimes starts in late August. Therefore, we excluded August and September.
We modelled harvest dates in Beaune from Paris monthly temperature (i.e. the forward approach), starting in 1659, using two multiple linear regression models relating GHD to temperature in March, April, May, June and July, as well as fitting with ordinary least squares. Model Flinear is linear, while model Ftransformed used transformed variables. Since the relation between grape growth and temperature is assumed to be non-linear, all temperatures were logit transformed in the model such that curves flatten out for very low and very high temperatures and have the steepest slope at 18 ∘C (the same transformation was used for all calendar months).
Further, the harvest date was log-transformed such that a difference in harvest date of 1 d obtains more weight at the beginning of September than at the end of October:
where ln denotes the natural logarithm. Both models were calibrated in the period 1659–1850, while the period 1851–2018 was used for evaluation.
The calibrated model Flinear reads
and the calibrated model Ftransformed reads
For analysing atmospheric circulation conducive to early harvest dates, climate simulations can be used if they are able to reproduce harvest dates. We therefore applied model Ftransformed (without recalibration) to the global monthly ensemble climate reconstruction EKF400 back to 1603 (termed Ftransformed.EKF400), which is based on assimilating instrumental data, documentary data and tree-ring proxies into an ensemble of 30 global climate model simulations (Franke et al., 2017a). It was also applied to the underlying model simulation CCC400 (Bhend et al., 2012), termed Ftransformed.CCC400. The closest grid point to Beaune was extracted, and the data were debiased according to the calibration period mean value of each calendar month.
April-to-July mean temperatures were reconstructed from GHDs (i.e. the backward approach) using two models, again calibrated for the period 1659–1850 and evaluated for 1851–2018. Model Blinear is a simple linear regression yielding the relation
Additionally, we defined a model Bweighted.simulations starting from the simulated GHD in the CCC400 simulations (Ftransformed.CCC400). We simulated all pre-phylloxera years (1603–1850; before the phylloxera outbreak that destroyed European cultivars and the subsequent reconstruction of the vineyard with American rootstocks) in the 30-member ensemble after debiasing, yielding 7440 years. We assume that any of these years may serve as an analogue provided its GHD is close to the observed one. The reconstruction xrec,j for year j is then
where i refers to the 7440 model years, xi is the variable to be reconstructed (here April–July mean temperature, but the same equation could be used for other variables or other definitions of the warm season) in the model simulation for year i and wi,j is the weight of model year i, taken as the density of a normal distribution at the location of the modelled GHDi. GHDj is the observed GHD and rEKF is the standard deviation of EKF400 residuals (see above).
Note that this procedure is equivalent to a Bayesian approach, in which the modelled April–July mean temperatures from all (equally likely) 7440 years serve as the prior for the distribution xj. According to Bayes' theorem,
where f(GHDj|xj) is the conditional density of GHDj given xj, which corresponds to the weights wj. The expectation value is then equivalent to Eq. (6).
3.3 Atmospheric circulation blocking
To address anomalous atmospheric circulation causing early or late harvest dates, we analyse 500 hPa geopotential height (GPH) and atmospheric blocking. The blocks were defined based on 500 hPa GPH according to the algorithm of Tibaldi and Molteni (1990) (see also Tibaldi et al., 1994; Scherrer et al., 2006, for more details). For the period after 1850 we use version 2c of the Twentieth Century Reanalysis (20CRv2c; Compo et al., 2011). It provides an ensemble of 56 realisations of an atmospheric reanalyses with 6-hourly time steps. To analyse blocking for early harvest dates prior to 1850, we used CCC400. The performance of blocking algorithms for 20CRv2c and CCC400 has been evaluated in Rohrer et al. (2018). To address the latest summer season (2018), we used the ERA5 reanalysis (Hersbach and Dee, 2016).
Using Eq. (6), 500 hPa GPH and blocking were reconstructed, with x denoting April–July mean fields of 500 hPa GPH and blocking. This gives atmospheric circulation statistics that are consistent with the corresponding harvest date.
4.1 Presentation of the Beaune GHD series
The 664-year-long Beaune series is quite homogeneous, showing nearly identical averages and standard deviations over the four sub-periods mentioned in Sect. 2 prior to 1988 (Table 3). It is significantly correlated at with April-to-July mean temperatures in Paris over the 360-year-long period 1659–2018 (Table 2).
Table 2Pearson correlation (r) between Beaune GHD time series and March-to-September mean Paris temperatures (1659–2018).

Table 3Mean GHD and standard deviation for various sub-periods of the Beaune GHD homogenised time series.
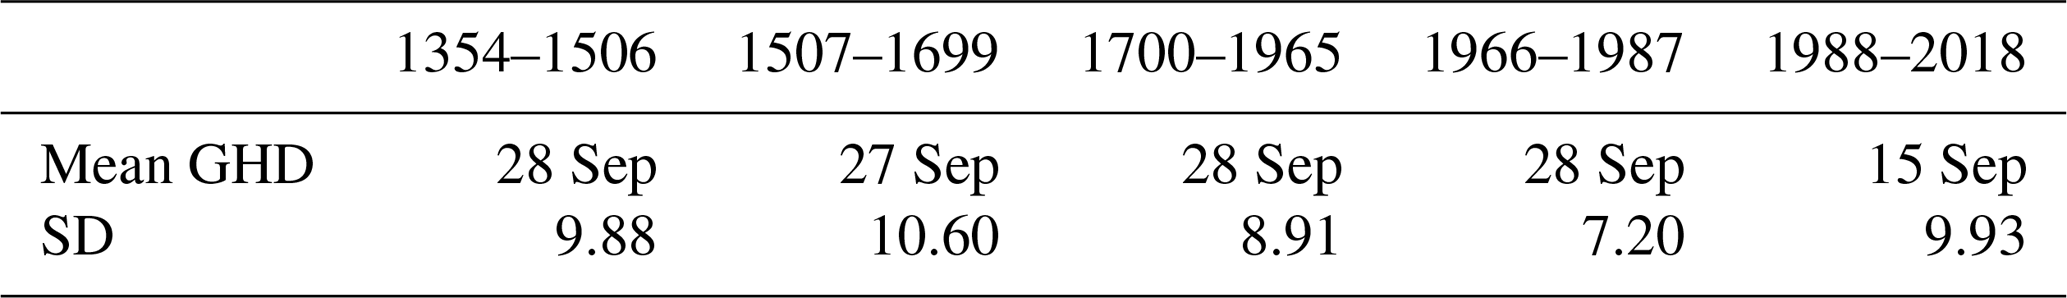
The curve is clearly divided in two parts. Grapes were on average picked on 28 September from 1354 to 1987, comprising most of the Little Ice Age and the 20th century period of slow warming. In contrast, GHDs were 13 d earlier (15 September) during the last 31-year-long period of rapid warming from 1988 to 2018 (Table 3). The main phenological phases in the development of grapes (Vitis vinifera) – bud break, flowering, veraison (colour change and softening of the berries) – were in step with the harvest dates (Jüstrich, 2018).
Besides the climatic shift in 1988 several warm (positive) and cold (negative) fluctuations stand out: GHDs were 6.5 d earlier between 1383 and 1435 than between 1354 and 1382. These fluctuations agree with those of glacier length. The Gorner Glacier (Canton Valais, Switzerland) advance since the 1340s culminated in 1385 on its first Little Ice Age maximum, which corresponds to the position of the glacier in 1859. Then the glacier melted back to a low level, which cannot exactly be established (Holzhauser, 2010). Likewise, the GHD curve mirrors the well-known 1520–1560 and 1720–1739 warm phases as well as the cold ca. 1600, ca. 1640 and 1820–1860 phases documented through the waxing and waning of Alpine glaciers (Nussbaumer and Zumbühl, 2018). In 1520–1560 grapes were on average harvested 4 d earlier (24 September) than the mean value prior to 1988 and 6 d earlier (22 September) in the period 1720–1739. Between 1820 and 1860, in contrast, GHD occurred 4 d later (2 October) than the mean value. This phase is strongly influenced by multiple volcanic eruptions from which the climate system only recovered slowly (Brönnimann et al., 2019).
4.2 Correlation with other proxy time series
Correlations between documentary-based proxy series and the Beaune GHD series turned out to be significant (Fig. 7). We focussed on the period prior to 1850, and significant Pearson correlation was found between wheat harvest dates in Norfolk and grape harvest dates in Beaune despite the considerable distance between the two locations and the different nature of the proxy. The GHDs available for Metz from 1420 to 1537 are well correlated with Beaune GHDs as well (r=0.60). On the other hand, the coefficient is surprisingly high between the GHDs from the Czech lands and the Beaune series despite the distance of 900 km between Beaune and the region northwest of Prague.
Tree-ring-based temperature reconstructions were used to investigate the similarity with the grape harvest dates. Both have annual resolution and are influenced by the summer growing season. The closest tree-ring reconstructions are found at a distance of a few hundred kilometres from Beaune, similar to the long instrumental measurements from Paris. Nevertheless, seasonal average temperatures should be highly correlated over regions of several hundred kilometres.
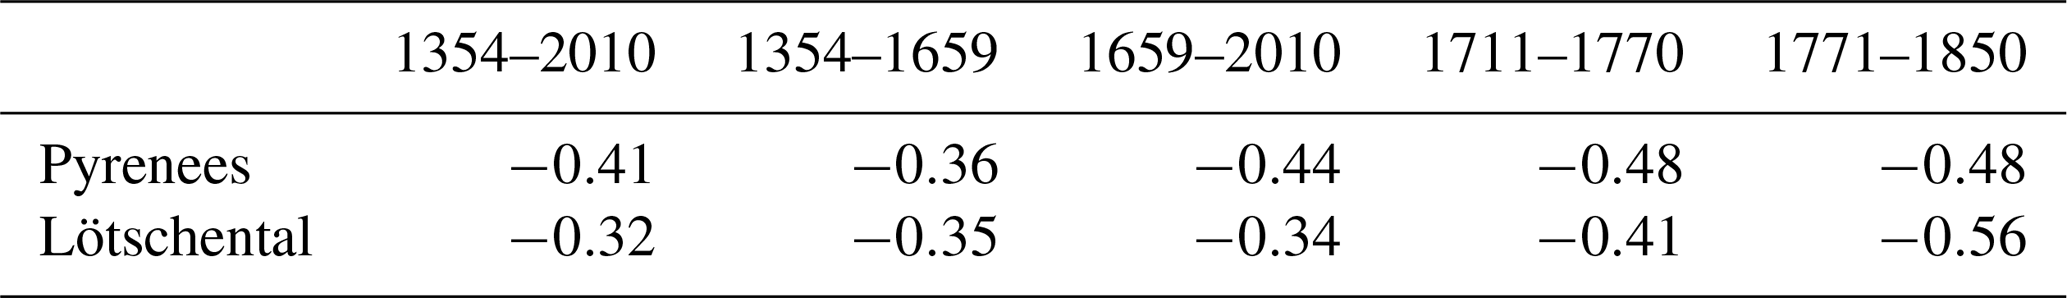
Pearson correlation coefficients are expected to be negative because the warmer a growing season is, the earlier the harvest date and the thicker the tree ring or the denser the latewood. Correlation coefficients for both sites are high and clearly significant (p<0.05), through they are obviously not as high as with instrumental temperature because tree-ring proxies include additional noise from non-climatic influences. Correlation coefficients are robust and remain constant throughout all the tested sub-periods (Table 4).
Table 4Pearson correlation coefficients (r) for various sub-periods between wine harvest dates and tree-ring-based temperature reconstructions. All correlations are statistically significant (p<0.05).
4.3 Statistical model for harvest dates
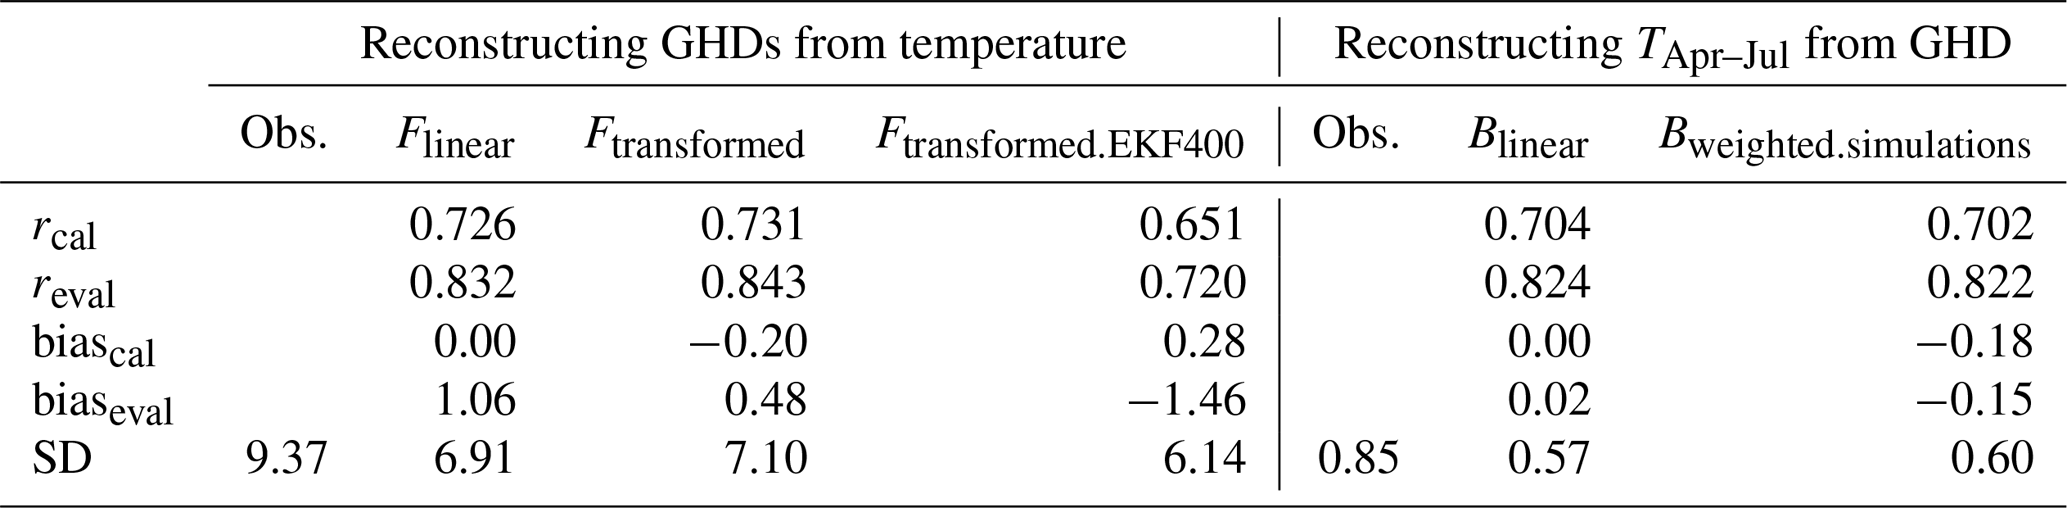
GHDs can be well reconstructed from temperature using either model Flinear or Ftransformed (see Table 5, Fig. 8; scatterplots are shown in Fig. S1 in the Supplement). Interestingly, both models produce a better correlation (>0.8) in the evaluation period (1851–2018) than in the calibration period (1659–1850), probably due to the strong and well-reproduced trend of GHDs in the evaluation period. Given the fact that the observed temperature refers to a location more than 300 km away and is based on early instruments with presumably substantial errors, a correlation coefficient of r=0.8 over the entire period is indeed surprising.

Figure 8(a) Harvest dates in observations and modelled from observed and reconstructed (EKF400) temperatures. (b) April-to-July mean temperature from observations and reconstructed from models Blinear and Bweighted.simulations. Blue shading denotes the 95 % prediction interval for Blinear.
Table 5Reconstruction statistics for the forward (F) and backward (B) models. “Obs.” denotes observations. All models were calibrated against observations in the 1659–1850 period (Bweighted.simulations is not calibrated but uses the calibrated model Ftransformed.CCC400) and evaluated in the period 1851–2018. Ftransformed.EKF400 denotes the application of the calibrated model Ftransformed to EKF400. “Calib.” and “Eval.” indicate the model statistics in the calibration and evaluation periods, respectively, and SD indicates the standard deviation (in days and degrees Celsius, respectively) for the common period (1659–2004). Numbers for EKF400 refer to the ensemble mean of 30 reconstructions.
Correlations are still high when applying model Ftransformed to EKF400 (Table 5 shows the range over the entire ensemble; see also the scatterplots in Fig. S1). This suggests that GHDs can be modelled from climate simulation output, which is important for the analogue reconstruction approach.
The reconstruction of April-to-July mean temperature from GHDs using models Blinear and Bweigthed.simulations yields similar statistics as the forward approach (Table 5, Fig. 8). In the observations, April-to-July temperature reached the highest value ever in 2018. No year in the past was warmer in the observations (although there were two years with an earlier harvest).
The autocorrelation structure of the Beaune GHD-based temperature reconstruction (black in Fig. S2; models Blinear and Bweigthed.simulations lead to equal results) is very similar to the tree-ring reconstruction from the Pyrenees (blue) but has clearly less autocorrelation than the tree-ring reconstruction from the Lötschental, Switzerland (red). The Lötschental time series experiences much more low-frequency variability than the Beaune and Pyrenees records. However, it is hard to argue that one of them should be the correct one. All have uncertainties with regard to their low-frequency behaviour, which could be due to age detrending, temporally inconsistent tree-age distributions and other factors. On the other hand, documentary data for GHDs are also not free of issues concerning low-frequency variability. In the case of vines there may be adaptation, breeding and/or gene (de)activation processes over the decades that may dampen low-frequency variability. There may also be changes in taste altering harvest dates in both directions.
Another point worth mentioning in comparison with tree-ring reconstructions is that the Beaune temperature reconstruction rather underestimates interannual variability (SD = 0.58 K, period 1659–2007) compared to the Paris observations (SD = 0.87 K), whereas both tree-ring reconstructions overestimate it (both SD = 1.10 K).
4.4 Role of atmospheric blocking
What atmospheric conditions are conducive to early GHDs? Using the analogue approach we can analyse the April-to-July averaged 500 GPH and blocking statistics over the North Atlantic–European region for past years. Figure 9 shows GPH (anomalies in contours) and blocking (anomalies in colour, climatology in contours) fields that are consistent with the GHD of 1556, the second earliest on record after 2003. For comparison, we also show a composite of summer blocking for the 10 earliest GHDs in the period 1851 to 1980 from the 20CRv2c reanalysis (we excluded the last decades due the strong anthropogenic warming effect) relative to the average over that period. Finally, we also show blocking anomalies for summer 2018 relative to the average for 2000–2018 from the ERA5 reanalysis.
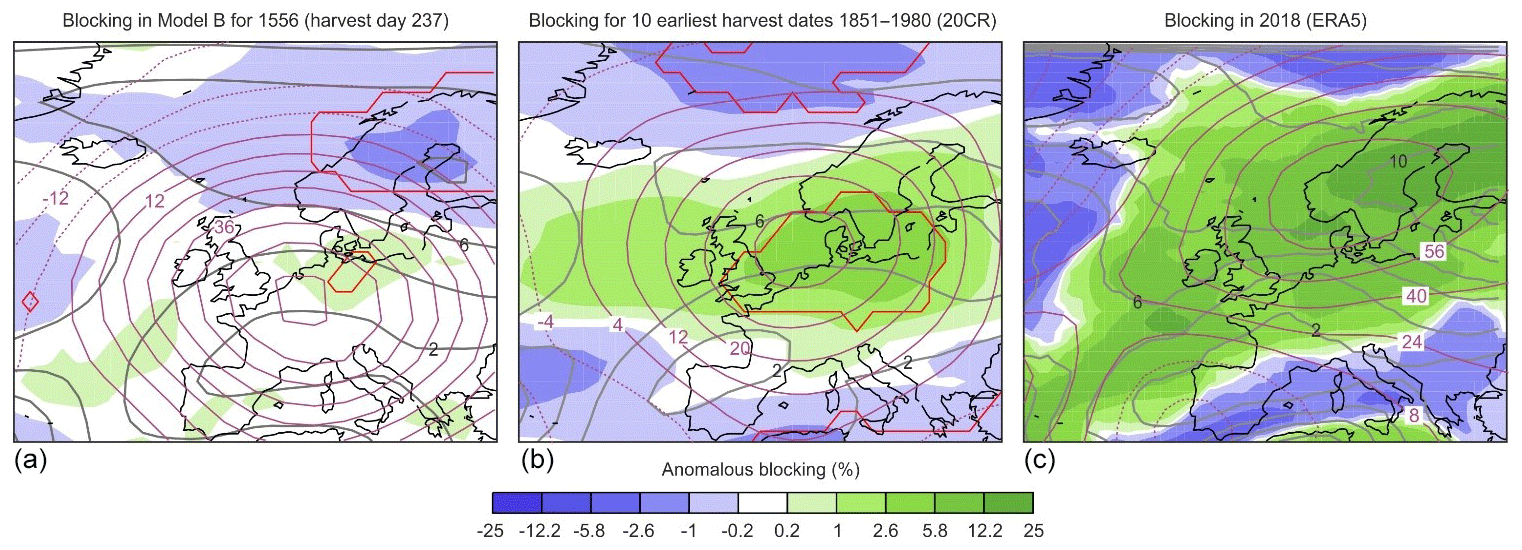
Figure 9Anomalies in April-to-July 500 hPa GPH (purple contours in geopotential metres) and blocking frequency (in percentage of time steps blocked, note the non-linear scale) in (a) model Bweighted.simulations for 1556 (relative to all years prior to 1850) as well as (b) averaged for the 10 earliest harvest dates in 1851 to 1980 in 20CRv2c (relative to 1851–1980). Panel (c) shows anomalous 500 hPa GPH and blocking in April to July 2018 in ERA5 (relative to 2000–2018). Grey solid contours give the corresponding blocking climatologies (in percentage of time steps blocked). Red lines indicate where the 5 % to 95 % confidence interval for anomalous blocking is exceeded based on 1000 repetitions of a Monte Carlo sampling of the weights (for model B) or years in 20CRv2c, respectively.
Early GHDs are related to high-pressure anomalies centred over western or northern central Europe. High-pressure situations are accompanied by increased radiation and high temperatures. With respect to blocking, anomalies are weak over the study area (central–western Europe). Rather, blocking during early GHD years occurred more frequently over Denmark (less frequently over northern Scandinavia). In such situations the study area lies to the southwest of the block and receives dry and warm continental air masses. A similar blocking pattern is also found for the 10 earliest GHD years in the 20CR reanalysis. The year 2018 follows a similar pattern. Early harvest dates are thus related to blocking over Denmark. Late harvest dates (not shown) do not imprint significantly onto blocking.
4.5 Grape ripening in extremely hot and dry years
The 33 extremely warm events comprising the fifth percentile bracket of GHDs are unevenly distributed over time (Fig. 10); 21 of them occurred between 1393 and 1719, i.e. one out of the 15 years included a hot spring–summer period. In contrast, this is the case for just 5 years between 1720 and 2002, i.e. one out of 56. Under those circumstances, the memory of outstandingly warm years faded. No wonder that the hot summer of 2003 came as a surprise. Since then 8 out of 16 spring–summer periods were outstanding according the statistics of the last 664 years, no less than 5 among them within the last 8 years. This implies that the extremes in the past have now become normal. The acceleration of extreme temperatures in the last decade went along with an increased melting back or decay of Alpine glaciers, which lost about 20 % of their remaining volume (Swiss Glaciers, 2017).
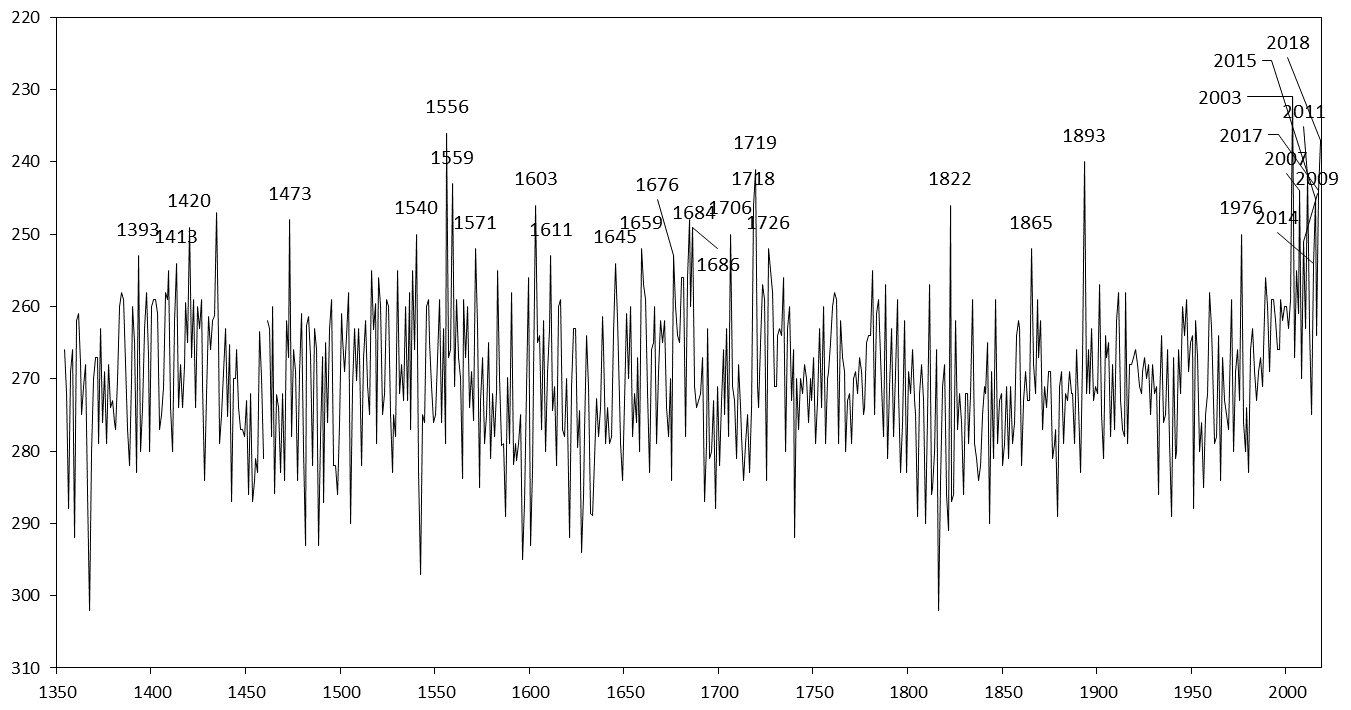
Figure 10Beaune GHD time series (1354–2018) with an indication of most of the 5 % earliest dates.
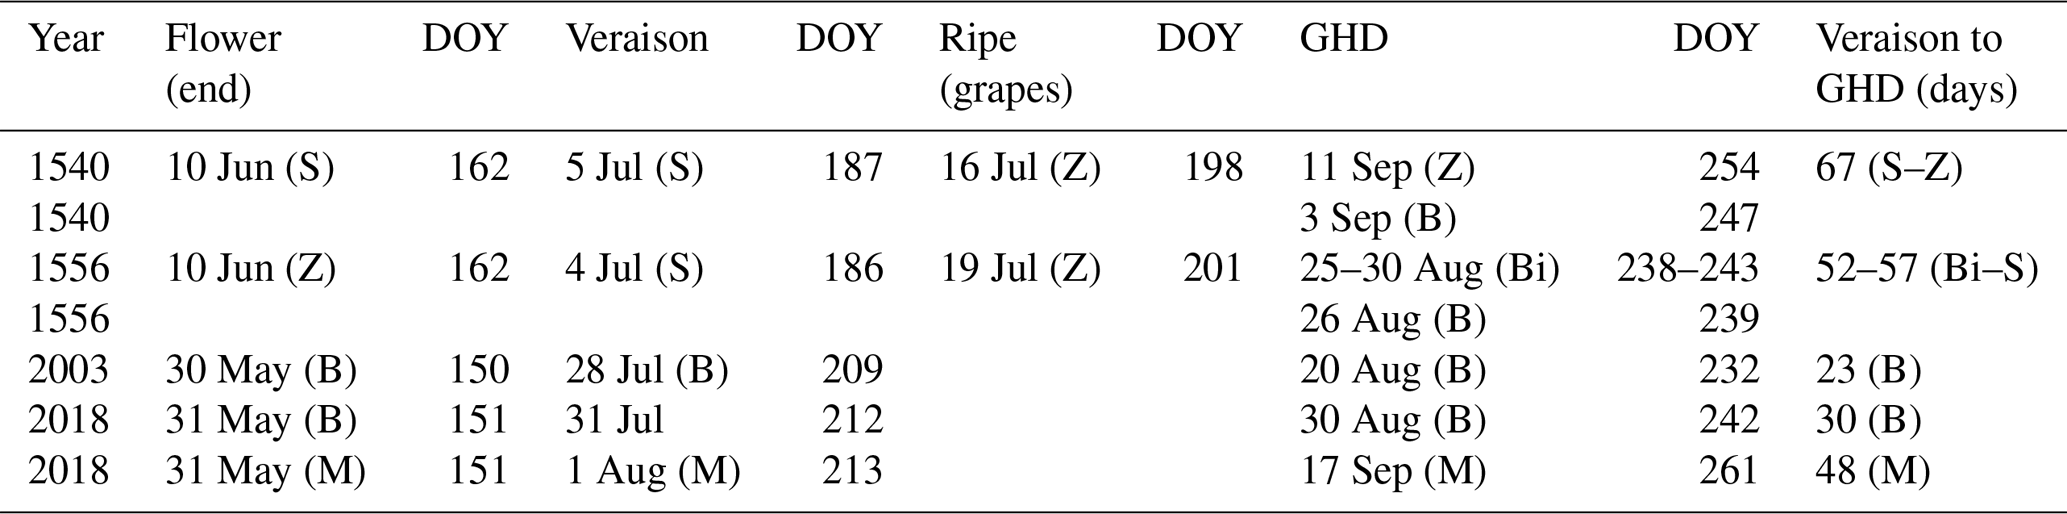
Subsequently, conditions in two outstanding years – 1540 and 1556 – are considered in more detail. First of all, it is puzzling that the exceptional heat and drought in 1540 ranks only 19th in the statistics of Beaune GHDs. Possible reasons to de-emphasise this event based on tree-ring evidence were brought forward by Büntgen et al. (2015). However, their arguments are thought to be questionable (Pfister et al., 2015). An interpretation of this paradox is attempted using vine phenological evidence available from vineyards around Biel–Bienne, Zürich and Schaffhausen (Switzerland) in 1540 and 1556 in comparison with the Beaune evidence. Source references are provided on the Euro-Climhist data platform (https://echdb.unibe.ch/, last access: 15 July 2019). Elevation matters for the comparison: the three Swiss vine-growing areas are located at altitudes of about 430 m a.s.l., i.e. about 130 to 200 m higher than those of Beaune region vineyards. Vine cultivars (CVs), i.e. varieties, need to be considered in addition to altitude. In Biel–Bienne CV Chasselas used to be grown, while in Zürich and Schaffhausen CV Räuschling was cultivated, which survives in a few vineyards today. The maturity of the Chasselas and Räuschling cultivars is 10 to 14 d earlier than that of Pinot noir grown in the Beaune area (Altwegg, 2018). Table 6 lists the main phenological grapevine stages – end of flowering, beginning of veraison (colour change and softening of the berries), and harvest dates for the years 1540, 1556, 2003 and 2018. Gladstones (2011) refers to the widely observed fact that “the date of flowering, can usually predict quite closely the dates of veraison (colour change and softening of the berries) and maturity to follow […]. The later phenological intervals show little response to temperature and tend to be constant from year to year”. His assessment is confirmed by Chuine et al. (2004) and Jüstrich (2018). In 1540, however, the interval between veraison and harvest took 67 d in the Zürich area, i.e. 27 d longer than usual, while this interval was somewhat shorter in 1556. In both years the grapes were harvested some time after full ripening. For 1540 this assumption is confirmed by the sources. Vine growers in Schaffhausen (Switzerland) were “long waiting for rain to begin the harvest”, as chronicler Oswald Huber relates. He writes, however, that they “finally tackled the work nevertheless, because the plants withered.” Likewise, vine growers at the shores of Lake Constance and in the Upper Alsace interrupted the vintage after picking a few juicy grapes because the remaining ones were somewhat dried out. The vintage was then resumed after a 2 d spell of rain. At harvest time grapes in many vineyards had become raisins. They yielded a sweet sherry-like wine which made people more rapidly drunk than usual (Wetter and Pfister, 2013). It needs to be stressed that meteorological conditions were almost matchless in 1540. This mega-drought described in documentary data offers a broad spectrum of evidence on past weather and climate and their societal impacts. It is described in a sample of 312 first-hand documentary weather reports originating from continental Europe (Wetter and Pfister, 2013). The hot and dry period in 1540 lasted from April to the end of the year. The heatwave peaked at the end of a 46 d long rainless period between 23 June and 7 August during which many forests and settlements in a large area from the Ardennes to Poland went up in flames (Pfister, 2018). Maximum temperatures from late July may have exceeded 40 ∘C (Orth et al., 2016). Vagrants and homeless people were hunted down for starting town and forest fires (Pfister, 2017). The heatwave of 1540 undoubtedly struck the region of Burgundy. The church of Notre-Dame of Beaune organised eight processions to call for rains from the beginning of May to the end of August (Labbé and Gaveau, 2011). In the near city of Besançon (ca. 100 km eastwards) a chronicler wrote that warm temperatures lasted from April to November and that the heatwave was hardly bearable by humans during summer (Wetter et al., 2014). The possibility cannot be excluded that even the date of veraison was also somewhat delayed due to drought stress. Research in grapevine biology has established that under conditions of extreme heat and drought the development of grapes is slowed down or stopped (Keller, 2016). When occurring before veraison, extreme hydric stress alters grape quality and the onset of ripening, possibility because it induces leaf defoliation and therefore carbon assimilation limitation (Basile et al., 2012; Girona et al., 2009; Ollat and Gaudillere, 1998). In fact, this phenomenon was observed during the temperature peak in the hot summer of 1947 in Schaffhausen (Amtsblatt, 1947).
Table 6Phenological stages (flowering, veraison, ripening of the grapes and harvest dates) of the vine during extremely early years. S (Schaffhausen, white Räuschling cultivar); Z (Zürich, white Räuschling); Bi (Biel–Bienne, white Chasselas), M (Malans, red Pinot noir), B (Beaune, red Pinot noir).
In 1556 grapes in Beaune were harvested on 16 August. In central France, the 1556 heat and drought began in mid-April, i.e. about 45 d later than in 1540, following a wet winter. The heatwave to mid-June spurred vegetation growth. In the Loir-et-Cher region, a variety of red Pinot noir cultivar called Auvernat was already blossoming around 25 April (Nouel, 1878, 235). Not a drop of rain fell during this period. On 14 June, it poured down for 3 to 4 h, which visibly refreshed the vegetation. Before 10 July the first grapes were ripe. In July the ground became so hot that it burnt people's feet walking barefoot. Like in 1540 the heat and drought peaked in early August (Bourquelot, 1857, 30–31; Hiver, 1867, 81 and 90; Nouel, 1878, 235–237). Following the deliberation protocols of the chapter of Notre-Dame of Beaune, seven processions for obtaining rain were held in the city from 15 June to 15 August (Arch. Dep. Côte d'Or, G 2499).
The 1556 harvest of Chasselas grapes in Biel–Bienne was estimated to have occurred between 25 and 30 August, i.e. at about the same time as that of Pinot noir in Beaune, considering the chronicler's remark that the abundant harvest had already ended on 10 September (Gregorian style). Like in the Beaune area, the preceding winter of 1556 had been very wet considering the daily weather observations by Wolfgang Haller in Zürich. Disregarding June, which was completely rainless, the spring–summer period included seven precipitation days in April, three in May and five in July (Haller in Pfister, Rohr; https://echdb.unibe.ch/, last access: 15 October 2018). A hot and almost rainless period began on 29 July and lasted to 11 September, i.e. more than a month later than in 1540.
The heatwave in summer 2003 was reassessed by Pfister (2018). The water deficit was not sufficiently strong to “block” grape ripening through extremely limited photosynthesis. Obviously, ripening made its course quickly. Additionally, winegrowers harvested soon to maintain sufficient acidity in wines (and in some cases avoid excessively high alcohol content in wines).
Since the early 21st century, higher temperatures combined with increasing control of grape sanitary status (grey mould disease mostly) has made the ripening duration (i.e. the lag during veraison and harvest) more winemaker dependent. Winemaker choices depend on both cultivar and the style of wine. For instance, the number of days between veraison and harvest for CV Cabernet–Sauvignon has nearly been doubled in a famous Château in the appellation Margaux near Bordeaux (Van Leeuwen and Destrac-Irvine, 2017)
In sum, the decline by 13 d of the average date of GHD since 1988 went along with a large increase in the number of extreme spring to summer seasons. These include situations such as in 1540 when both human and ecological systems behaved non-linearly outside the normal range of biological and probability laws. Documentary data may be helpful to describe such conditions in the necessary detail.
Time series of documentary proxy data such as GHDs need to be critically evaluated by historians prior to statistical analysis. In particular, 19th century publications need to be cautiously examined before being used, and in any case first-hand documentary material should be preferred, which takes a lot of meticulous detail work in the archives.
The 664-year-long Beaune GHD series assembled from the archives of the city is significantly correlated with the long Paris temperature series from 1659 to 2018 and with documentary and tree-ring proxy data from 1354 to 1658. Statistical models describe Beaune GHDs very well, with Pearson correlations around 0.8. The climate shift of 1988 divides the series in two different parts. Over the period of the Little Ice Age and the “warm 20th century” up to 1987, grapes in the Beaune area were picked on 28 September on average. After the climate shift in 1988 the harvest date declined by 13 d to an average of 15 September during the last 31-year-long period of rapid warming from 1988 to 2018. It is noteworthy that the 33 values below the fifth percentile are unevenly distributed over time. While 21 of them occurred between 1354 and 1719, only 4 of them were registered between 1720 and 1987. In contrast, eight outstanding extremes occurred within the last 30 years: three between 2000 and 2010 and five between 2011 and 2018, which probably witnessed the warmest warm season temperatures since 1354.
Early harvest dates coincide with high-pressure influence and increased blocking over Denmark. Conversely, the most outstanding heat and drought years were not necessarily the earliest in the ranking of harvest dates. It is concluded that grape development slowed down or even stopped during very long rainless periods and extreme maximum temperatures such as in 1540 and 1473 (Camenisch et al., 2019). In sum, the long homogenised Beaune series visually demonstrates that warm extremes in the past were outliers, while they have become the norm in the present time.
All the data used to perform the analysis in this study are described and properly referenced in the paper. Most of the GHD time series used are alternatively available on the Euro-Climhist database (https://www.euroclimhist.unibe.ch/en/, last access: 15 July 2019). The Beaune GHD times series from 1354 to 2018 and the Paris April-to-July temperature times series from 1659 to 2018 are accessible on this platform as well. The April-to-July GHD-based temperature reconstruction from the Beaune GHD time series is furnished in the Supplement to this article. The tree-ring chronologies can be found in the N-TREND collection (https://www.ncdc.noaa.gov/paleo-search/study/19743; Wilson et al., 2016). The CCC400 model simulations and the EKF 400 Reanalysis can be found at DKRZ (http://cera-www.dkrz.de/WDCC/ui/Compact.jsp?acronym=EKF400_v1.1; Franke et al., 2017b). The 20CR data can be downloaded from NOAA PSD or from NCAR, and ERA5 from Copernicus Climate Change Services.
The supplement related to this article is available online at: https://doi.org/10.5194/cp-15-1485-2019-supplement.
TL provided the Beaune GHD dataset from archival research and wrote Sects. 1 and 2, as well as Sect. 4.1, together with CP.
CP wrote Sect. 1 and Sect. 4.1 together with TL, Sect. 4.5 together with BB, and Sects. 4.2 and 5.
SB and JF performed the statistical reconstructions and wrote Sects. 3.2, 3.3, 4.3 and 4.4.
DR provided the updated Paris mean temperature series (1659–2018) and wrote Sect. 2.6.
BB provided information on vine phenology and helped write Sect. 4.5.
The authors declare that they have no conflict of interest.
Stefan Brönnimann and Jörg Franke were supported by the Swiss National Science Foundation (project RE-USE) and by the European Research Council (AdG 787574 “PALAEO-RA”). Simulations were performed at the Swiss National Supercomputing Centre CSCS. The Twentieth Century Reanalysis Project datasets are supported by the U.S. Department of Energy (DOE) Office of Science Innovative and Novel Computational Impact on Theory and Experiment (INCITE) programme, the Office of Biological and Environmental Research (BER), and the National Oceanic and Atmospheric Administration Climate Program Office.
The authors thank the GEOBFC team of the Maison des Sciences de l'Homme of Dijon (USR 3516, UBFC – CNRS) for making Fig. 2.
This research has been supported by the Swiss National Science Foundation (project RE-USE) and by the European Commission, European Research Council (PALAEO-RA, grant no. 787574).
This paper was edited by Luke Skinner and reviewed by Tim Heaton and one anonymous referee.
Altwegg, A.: Weinlandschaft Zürichsee, Geschichte und Gesichter, Th. Gut editions, Stäge, 213 pp., 2018.
Amante, C. and Eakins, B. W.: ETOPO1 1 Arc-Minute Global Relief Model: Procedures, Data Sources and Analysis, NOAA Technical Memorandum NESDIS NGDC-24, National Geophysical Data Center, NOAA, https://doi.org/10.7289/V5C8276M, 2009.
Amtsblatt: Amtsblatt des Kantons Schaffhausen 7/1947: 4, 1947.
Angot, A.: Études sur les vendanges en France, Annales du bureau central météorologique de France, année 1883, B29–B120, 1885.
Arnoux, C.: Dissertation sur la situation de la Bourgogne, sur les vins qu'elle produit, sur la manière de cultiver les vignes, de faire le vin et de l'éprouver, Londres, Samuel Jallason, 1728.
Basile, B., Girona, J., Behboudian, M. H., Mata, M., Rosello, J., Ferré, M., and Marsal, J.: Responses of “Chardonnay” to deficit irrigation applied at different phenological stages: vine growth, must composition, and wine quality, Irrigation Sci., 30, 397–406, https://doi.org/10.1007/s00271-012-0353-1, 2012.
Bhend, J., Franke, J., Folini, D., Wild, M., and Brönnimann, S.: An ensemble-based approach to climate reconstructions, Clim. Past, 8, 963–976, https://doi.org/10.5194/cp-8-963-2012, 2012.
Blanchemanche, P.: Crues historiques et vendanges en Languedoc méditerranéen oriental: la source, le signal et l'interprétation, Archéologie du Midi Médiéval, 27, 225–235, 2009 .
Bourquelot, F.: Mémoires de Claude Haton, contenant le récit des événements accomplis de 1553 à 1582, principalement dans la Champagne et la Brie, Vol. 1, Paris, Impr. Impériale, 1857.
Brázdil, R. and Kotyza, O.: History of Weather and Climate in the Czech Lands III, Daily Weather Records in the Czech Lands in the Sixteenth Century, Brno, Masaryk University, 1999.
Brázdil, R., Pfister, C., Wanner, H., Von Storch, H., and Luterbacher, J.: Historical Climatology in Europe – The State of the Art, Climatic Change, 70, 363–430, 2005.
Brönnimann, S., Franke, J., Nussbaumer, S. U., Zumbühl, H. J., Steiner, D., Trachsel, M., Hegerl, G. C., Schurer, A., Worni, M., Malik, A., Flückiger, J., and Raible, C. C.: Last phase of the Little Ice Age forced by volcanic eruptions, Nat. Geosci., in press, 2019.
Büntgen, U., Frank, D. C., Nievergelt, D., and Esper, J.: Summer temperature variations in the European Alps, AD 755–2004, J Climate, 19, 5606–5623, 2006.
Büntgen, U., Tegel, W., Carrer, M., Krusic, P. J., Hayes, M., and Esper, J.: Commentary to Wetter et al. (2014): Limited tree-ring evidence for a 1540 European “Megadrought”, Climatic Change, 131/2, 183–190, https://doi.org/10.1007/s10584-015-1423-1, 2015.
Camenisch, C., Brázdil, R., Kiss, A., Pfister, C., Wetter, O., Rohr, C., Contino, A., and Retsö, D.: Extreme heats and droughts of 1473 and their impacts in Europe in context of the early 1470s, Reg. Environ. Change, in review, 2019.
Chaptal, J. A.: L'art de faire le vin, Paris, Impr. de Crapelet, 1807.
Chuine, I., Yiou, P., Viovy, N., Seguin, B., Daux, V., and Le Roy Ladurie, E.: Grape ripening as a past climate indicator, Nature, 432, 89–290, 2004.
Compo, G. P., Whitaker, J. S., Sardeshmukh, P. D., Matsui, N., Allan, R. J., Yin, X., Gleason, B. E., Vose, R. S., Rutledge, G., Bessemoulin, P., Brönnimann, S., Brunet, M., Crouthamel, R. I., Grant, A. N., Groisman, P. Y., Jones, P. D., Kruk, M. C., Kruger, A. C., Marshall, G. J., Maugeri, M., Mok, H. Y., Nordli, Ø., Ross, T. F., Trigo, R. M., Wang, X. L., Woodruff, S. D., and Worley, S. J.: The Twentieth Century Reanalysis Project, Q. J. Roy. Meteor. Soc., 137, 1–28, https://doi.org/10.1002/qj.776, 2011.
Craddock, J. M.: Methods of comparing annual rainfall records for climatic purposes, Weather, 34, 332–346, 1979.
Daux, V., Garcia de Cortazar-Atauri, I., Yiou, P., Chuine, I., Garnier, E., Le Roy Ladurie, E., Mestre, O., and Tardaguila, J.: An open-access database of grape harvest dates for climate research: data description and quality assessment, Clim. Past, 8, 1403–1418, https://doi.org/10.5194/cp-8-1403-2012, 2012.
Dion, R.: Histoire de la vigne et du vin en France, des origines au XIXe siècle, Paris, chez l'auteur, 1959.
Dobrovolný, P., Moberg, A., Brázdil, R., Pfister, C., Glaser, R., Wilson, R., Van Engelen, A., Limanówka, D., Kiss, A., Halíčková, M., Macková, J., Riemann, D., Luterbacher, J., and Böhm, R.: Monthly, seasonal and annual temperature reconstructions for central Europe derived from documentary evidence and instrumental records since AD 1500, Climatic Change, 101, 69–107, 2010.
Dorado Liñán, I., Büntgen, U., González-Rouco, F., Zorita, E., Montávez, J. P., Gómez-Navarro, J. J., Brunet, M., Heinrich, I., Helle, G., and Gutiérrez, E.: Estimating 750 years of temperature variations and uncertainties in the Pyrenees by tree-ring reconstructions and climate simulations, Clim. Past, 8, 919–933, https://doi.org/10.5194/cp-8-919-2012, 2012.
Franke, J., Brönnimann, S., Bhend, J., and Brugnara, Y.: A monthly global paleo-reanalysis of the atmosphere from 1600 to 2005 for studying past climatic variations, Scientific Data, 4, 170076, https://doi.org/10.1038/sdata.2017.76, 2017a.
Franke, J., Brönnimann, S., Bhend, J., and Brugnara, Y.: Ensemble Kalman Fitting Paleo-Reanalysis Version 1.1, World Data Center for Climate (WDCC) at DKRZ, available at: http://cera-www.dkrz.de/WDCC/ui/Compact.jsp?acronym=EKF400_v1.1 (last access: 15 July 2019), 2017b.
Garcia de Cortázar-Atauri, I., Daux, V., Garnier, E., Yiou, P., Viovy, N., Seguin, B., Boursiquot, J.-M., Parker, A.-K., van Leeuwen, C., and Chuine, I.: Climate reconstructions from grape harvest dates: Methodology and uncertainties, Holocene, 20, 599–608, 2010.
Garnier, E., Daux, V., Yiou, P., and Garcia de Cortázar-Atauri, I.: Grapevine harvest dates in Besançon (France) between 1525 and 1847: social outcomes or climatic evidence?, Climatic Change, 104, 703–727, https://doi.org/10.1007/s10584-010-9810-0, 2011.
Girona, J., Marsal, J., Mata, M., Del Campo, J., and Basile, B.: Phenological sensitivity of berry growth and composition of Tempranillo grapevines (Vitis vinifera L.) to water stress, Aust. J. Grape Wine R., 15, 268–277, https://doi.org/10.1111/j.1755-0238.2009.00059.x, 2009.
Gladstones, J.: Wine, Terroir and Climate Change, Wakefield Press, Kent Towns, 2011.
Guerreau, A.: Climat et Vendanges: Révisions et compléments, Histoire et Mesure, 10, 89–147, 1995.
Guiot, J., Nicault, A., Rathgeber, C., Edouard, J.-L., Guibal, F., and Till, C.: Last-millenium summer-temperature variations in western Europe based on proxy data, Holocene, 15, 489–500, 2005.
Hersbach, H. and Dee, D.: ERA5 reanalysis is in production, ECMWF Newsletter, 147, p. 7, 2016.
Hiver, M. (Ed.): Journal de Jehan Glaumeau, Bourges, 1541–1562, Bourges, 1867.
Holzhauser, H.: Zur Geschichte des Gornergletschers. Ein Puzzle aus historischen Dokumenten und fossilen Hölzern aus dem Gletschervorfeld, Geographica Bernensia G84, Bern, 253 pp., 2010.
Jüstrich, H.: Klimawandel – Fakt oder Fiktion? Schweizer Z. für Obst- und Weinbau, 16/13, 1–7, 2018.
Keller, M.: The Science of Grapevines, Anatorny and Physiology Second Edition, Academic Press, Elsevier Inc., Amsterdam, 2016.
Krieger, M., Lohmann, G., and Laepple, T.: Seasonal climate impacts on the grape harvest date in Burgundy (France), Clim. Past, 7, 425–435, https://doi.org/10.5194/cp-7-425-2011, 2011.
Labbé, T. and Gaveau, F.: Les dates de vendange à Dijon: établissement critique et révision archivistique d'une série ancienne, Rev. Historique, 657, 19–51, 2011.
Labbé, T. and Gaveau, F.: Les dates de vendange à Beaune (1371–2010). Analyse et données d'une nouvelle série vendémiologique, Rev. Historique, 666, 333–367, 2013a.
Labbé, T. and Gaveau, F.: Deux cents ans de réflexion sur les bans de vendange: un bilan historiographique de la question, in: Météores et climats d'hier, Décrire et percevoir le temps qu'il fait de l'Antiquité au XIXe siècle, edited by: Ducos, J., Paris, Hermann, 179–203, 2013b.
Lachiver, M.: Vins, vignes et vignerons. Histoire du vignoble français, Paris, Fayard, 1988.
Lavalle, J.: Histoire et statistique de la vigne et des grands vins de la Côte d'Or, Paris, Dusacq, 1855.
Legrand, J.-P.: L'expression de la vigne au travers du climat depuis le Moyen-Age, Revue Francaise d'oenologie, 75, 23–52, 1979.
Le Roy Ladurie, E.: Times of Feast, Times of Famine: A History of Climate since the Year 1000, Allen & Unwin, London (Original: Histoire du climat depuis l'an mil, Paris, Flammarion, 1971.
Le Roy Ladurie, E.: Histoire humaine et comparée du Climat. Canicules et Glaciers (XIIIe à XVIIIe siècles), Paris, Fayard, 2004.
Le Roy Ladurie, E., Daux, V., and Luterbacher, J.: Le climat de Bourgogne et d'ailleurs, Histoire, Économie et Sociétés, 3, 421–436, 2006.
Litzenburger, L.: Une ville face au climat. Metz à la fin du Moyen Âge (1400–1530), Nancy, Presses Univ. de Nancy, 2015.
Meier, N., Rutishauser, T., Pfister, C., Wanner, H., and Lüterbacher, J.: Grape harvest dates as a proxy for Swiss April to August temperature reconstructions back to AD 1480, Geophys. Res. Lett., 34, L20705, https://doi.org/10.1029/2007GL031381, 2007.
Menzel, A.: A 500 year pheno-climatological view in the 2003 heatwave in Europe assessed by grape harvest dates, Meteorol. Z., 14, 75–77, 2005.
Možný, M., Brázdil, R., Dobrovolný, P., and Trnka, M.: April–August temperatures in the Czech Lands, 1499–2015, reconstructed from grape-harvest dates, Clim. Past, 12, 1421–1434, https://doi.org/10.5194/cp-12-1421-2016, 2016.
Noirot, E.: Recherches sur les époques de la maturité des raisins, Le Cultivateur, 18 août 1836, 1836.
Nouel, M. E. (Ed.): Chronique de Michel Garault, chanoine de Troo (1543–1598), Bulletin de la Société archéologique, scientifique et littéraire du Vendômois, 17, 222–257, 1878.
Nussbaumer, S. U. and Zumbühl, H. J.: Evidence from the Archives of Societies: Historical Sources in Glaciology, in: The Palgrave Handbook of Climate History, edited by: White, S., Pfister, C., and Mauelshagen, F., London, Palgrave Macmillan, 93–97, 2018.
Ollat, N. and Gaudillere, J. P.: The Effect of Limiting Leaf Area During Stage I of Berry Growth on Development and Composition of Berries of Vitis vinifera L. cv. Cabernet Sauvignon, Am. J. Enol. Viticult., 49, 251–258, 1998.
Orth, R., Vogel, M., Luerbacher, J., Pfister, C., and Seneviratne, S. I.: Did European Temperatures in 1540 Exceed Present-day Records?, Environ. Res. Lett., 11, 114021, https://doi.org/10.1088/1748-9326/11/11/114021, 2016.
Pfister, C.: Das Klima der Schweiz von 1525 bis 1860 und seine Bedeutung in der Geschichte von Bevölkerung und Landwirtschaft, 2 vols., Paul Haupt., Bern, 1984.
Pfister, C.: When Europe was burning. The multi-seasonal drought of 1540 and the arsonist paranoia, in: Disasters, Risks and Cultures. A Comparative and Transcultural Survey of Historical Disaster Experiences between Asia and Europe, edited by: Schenk, G. J., 155–185, Springer, Charm, 2017.
Pfister, C.: The “Black Swan” of 1540. Aspects of a European Megadrought, in: Climatic Change and Cultural Transition in Europe, edited by: Leggewie, K. and Mauelshagen, F., Leiden, Brill, 156–196, 2018.
Pfister, C., Wetter, O., Brázdil, R., Dobrovolný, P., Glaser, R., Luterbacher, J., Seneviratne, S. I., Zorita, E., Alcoforado, M.-J., Barriendos, M., Bieber, U., Burmeister, K. H., Camenisch, C., Contino, A., Grünewald, U., Herget, J., Himmelsbach, I., Labbé, T., Limanówka, D., Litzenburger, L., Kiss, A., Kotyza, O., Nordli, Ø., Pribyl, K., Restö, D., Riemann, D., Rohr, C., Werner, S., Spring, J.-L., Söderberg, J., Wagner, S., and Werner, J. P.: Tree-rings and people – different views on the 1540 Megadrought. Reply to Büntgen et al. 2015, Climatic Change, 131/2, 191–198, https://doi.org/10.1007/s10584-015-1429-8, 2015.
Pribyl, K.: Farming, Famine and Plague. The Impact of Climate in Late Medieval England, Cham, Springer, 2017.
Pribyl, K., Cornes, R., and Pfister, C.: Reconstructing Medieval April–July Mean Temperatures in East Anglia, 1256–1431, Climatic Change, 113, 393–412, 2012.
Rohrer, M., Brönnimann, S., Martius, O., Raible, C. C., Wild, M., and Compo, G. P.: Representation of cyclones, blocking anticyclones, and circulation types in multiple reanalyses and model simulations, J. Climate, 31, 3009–3031, 2018.
Rotelli, C.: Una campagna medievale. Storia agraria del Piemonte fra il 1250 e il 1450, Turin, Einaudi, 1973.
Rousseau, D.: Les températures mensuelles en région parisienne de 1676 à 2008, La météorologie, 67, 43–55, 2009.
Rousseau, D.: Les moyennes mensuelles de températures à Paris de 1658 à 1675, d'Ismael Boulliau à Louis Morin, La météorologie, 81, 11–22, 2013.
Rousseau, D.: Fluctuations des dates de vendanges bourguignonnes et fluctuations des températures d'avril à septembre de 1378 à 2010, XXVIIe Colloque de l'Association Internationale de Climatologie, 2–5 juillet 2014 – Dijon (France), 757–763, 2015.
Scherrer, S. C., Croci-Maspoli, M., Schwierz, C., and Appenzeller, C.: Two-dimensional indices of atmospheric blocking and their statistical relationship with winter climate patterns in the Euro-Atlantic region, Int. J. Climatol., 26, 233–249, 2006.
Stehr, N., von Storch, H., and Brückner, E.: The Sources and Consequences of Climate Change and Climate Variability in Historical Times, Dordrecht, Kluwer Academic Press, 2000.
Swiss Glaciers: The Swiss Glaciers Yearbook of the Cryospheric Commission of the Swiss Academy of Sciences (SCNAT), published since 1964 by the Laboratory of Hydraulics, Hydrology and Glaciology (VAW) of ETH Zürich, No. 136, available at: http://www.glamos.ch (last access: 15 July 2019), 2017.
Tibaldi, S. and Molteni, F.: On the operational predictability of blocking, Tellus A, 42, 343–365, 1990.
Tibaldi, S., Tosi, E., Navarra, A., and Pedulli, L.: Northern and Southern Hemisphere seasonal variability of blocking frequency and predictability, Mon. Weather Rev., 122, 1971–2003, 1994.
Van Leeuwen, C. and Destrac-Irvine, A.: Modified grape composition under climate change conditions requires adaptations in the vineyard, OENO One, 51, 147, https://doi.org/10.20870/oeno-one.2016.0.0.1647, 2017.
Wetter, O. and Pfister, C.: Spring-summer temperatures reconstructed for northern Switzerland and southwestern Germany from winter rye harvest dates, 1454–1970, Clim. Past, 7, 1307–1326, https://doi.org/10.5194/cp-7-1307-2011, 2011.
Wetter, O. and Pfister, C.: An underestimated record breaking event – why summer 1540 was likely warmer than 2003, Clim. Past, 9, 41–56, https://doi.org/10.5194/cp-9-41-2013, 2013.
Wetter, O., Pfister, C., Werner, J. P., Zorita, E., Wagner, S., Seneviratne, S. I., Herget, J., Grünewald, U., Luterbacher, J., Alcoforado, M. J., Barriendos, M., Bieber, U., Brázdil, R., Burmeister, K. H., Camenisch, C., Contino, A., Dobrovolný, P., Glaser, R., Himmelsbach, I., Kiss, A., Kotyza, O., Labbé, T., Limanówka, D., Litzenburger, L., Nordli, Ø., Pribyl, K., Retsö, D., Riemann, D., Rohr, C., Siegfried, W., Söderberg, J., and Spring, J. L.: The year-long unprecedented European heat and drought of 1540 – a worst case, Climatic Change, 125, 349–363, https://doi.org/10.1007/s10584-014-1184-2, 2014.
Wilson, R., Anchukaitis, K., Briffa, K. R., Büntgen, U., Cook, E., D'Arrigo, R., Davi, N., Esper, J., Frank, D., Gunnarson, B., Hegerl, G., Helama, S., Klesse, S., Krusic, P. J., Linderholm, H. W., Myglan, V., Osborn, T. J., Rydval, M., Schneider, L., Schurer, A., Wiles, G., Zhang, P., and Zorita, E.: Last millennium northern hemisphere summer temperatures from tree rings: Part I: The long term context, Quaternary Sci. Rev., 134, 1–18, https://doi.org/10.1016/j.quascirev.2015.12.005, 2016 (data available at: https://www.ncdc.noaa.gov/paleo-search/study/19743, last access: 15 July 2019).
Wilson, R., Anchukaitis. K., Briffa, K., Büntgen, U., Cook, E., D'Arrigo, R., Davi, N., Esper, J., Frank, D., Gunnarson, B., Hegerl, G., Helema, S., Klesse, S., Krusic, P., Linderholm, H. W., Myglan, V., Osborn, T., Rydval, M., Schneider, L., Schurer, A., Wiles, G., Zhang, P., and Zorita, E.: Last millennium Northern Hemisphere summer temperatures from tree rings: Part I: the long term context, Quaternary Sci. Rev., 134, 1–18, https://doi.org/10.1016/j.quascirev.2015.12.005, 2016.