the Creative Commons Attribution 4.0 License.
the Creative Commons Attribution 4.0 License.
 | 10 Jan 2019
Comparing the spatial patterns of climate change in the 9th and 5th millennia BP from TRACE-21 model simulations
Liang Ning
Jian Liu
Raymond S. Bradley
The spatial patterns of global temperature and precipitation changes, as well as corresponding large-scale circulation patterns during the latter part of the 9th and 5th millennia BP (4800–4500 versus 4500–4000 BP and 9200–8800 versus 8800–8000 BP) are compared through a group of transient simulations using the Community Climate System Model version 3 (CCSM3). Both periods are characterized by significant sea surface temperature (SST) decreases over the North Atlantic, south of Iceland. Temperatures were also colder across the Northern Hemisphere but warmer in the Southern Hemisphere. Significant precipitation decreases are seen over most of the Northern Hemisphere, especially over Eurasia and the Asian monsoon regions, indicating a weaker summer monsoon. Large precipitation anomalies over northern South America and adjacent ocean regions are related to a southward displacement of the Intertropical Convergence Zone (ITCZ) in that region. Climate changes in the late 9th millennium BP (the “8.2 ka event”) are widely considered to have been caused by a large freshwater discharge into the northern Atlantic, which is confirmed in a meltwater forcing sensitivity experiment, but this was not the cause of changes occurring between the early and latter halves of the 5th millennium BP. Model simulations suggest that a combination of factors, led by long-term changes in insolation, drove a steady decline in SSTs across the North Atlantic and a reduction in the North Atlantic Meridional Overturning Circulation (AMOC), over the past 4500 years, with associated teleconnections across the globe, leading to drought in some areas. Multi-century-scale fluctuations in SSTs and AMOC strength were superimposed on this decline. This helps explain the onset of neoglaciation around 5000–4500 BP, followed by a series of neoglacial advances and retreats during recent millennia. The “4.2 ka BP Event” appears to have been one of several late Holocene multi-century fluctuations that were embedded in the long-term, low-frequency change in climate that occurred after ∼4.8 ka. Whether these multi-century fluctuations were a response to internal centennial-scale ocean–atmosphere variability or external forcing (such as explosive volcanic eruptions and associated feedbacks) or a combination of such conditions is not known and requires further study.


It is well documented that the first-order driver of Holocene climate change was orbital forcing, with an overall decline in summer insolation in summer months, particularly at high latitudes. This led to a drop in temperatures at high latitudes and less rainfall throughout the monsoon regions of the Northern Hemisphere, as seen in many paleoclimatic records (Burns, 2011; Solomina et al., 2015). Shorter-term rainfall fluctuations superimposed on this long-term change in hydrological conditions are clearly seen in many speleothem and lacustrine sediment records (e.g., Wang et al., 2005; Kathayat et al., 2017). Abrupt hydrological changes around 4.2 ka have been documented for various regions of the world; it has been suggested that the major global monsoon and ocean–atmosphere circulation systems were deflected or weakened synchronously at this time, causing major century-scale precipitation disruptions (severe megadroughts) over different regions (Weiss, 2017). Other studies (Wang et al., 2005; Tan et al., 2018a) have also noted weakening of the Asian summer monsoon at around this time, resulting in drought over the northern part of eastern China and flooding over the southern part.
In recent years, a more comprehensive picture of the “4.2 ka BP Event” has been derived from analysis of new high-resolution proxy data from different regions, and the event has become the focus of symposia and research conferences (e.g., Weiss, 2015). This event is of particular interest as it is associated with societal collapse and regional abandonment in many different regions. For example, the collapse and abandonment of Akkadian imperial settlements in the Khabur Plains, and other communities in dry farming domains across the Aegean and west Asia, was in response to the abrupt nature with which the megadrought began (with its onset in less than 5 years), its magnitude (a precipitation reduction of 30 %–50 %), and its long duration (200–300 years) (Weiss, 2017).
Although a drought episode around 4.2 ka has been found in many proxy reconstructions, the mechanisms that brought this about are still unclear, though different hypotheses have been proposed. For example, Staubwasser and Weiss (2006) suggested that the abrupt climate change event at 4.2 ka, as well as other widespread droughts around 8.2 and 5.2 ka over the eastern Mediterranean, west Asia, and the Indian subcontinent, was caused by a change in subtropical upper-level flow over the eastern Mediterranean and Asia. Some studies have suggested that these large-scale circulation anomalies may reflect persistent modes of internal climate variability, though there is a wide range of other explanations. For example, Booth et al. (2005) indicated that the widespread midlatitude and subtropical drought around 4.2 ka was linked to a La Niña-like sea surface temperature (SST) pattern, possibly associated with amplification of this spatial mode by variations in solar irradiance or volcanism. On the other hand, Hong et al. (2005) analyzed a 12 000-year proxy record for the East Asian monsoon and concluded that such abnormal climate conditions could possibly result from frequent and severe El Niño activities. Using paired oxygen isotope records from North America, Liu et al. (2014b) indicated that there was a transition from a negative Pacific North American (PNA)-like pattern during the mid-Holocene to a positive PNA-like pattern during the late Holocene, which led to drier conditions in northwestern North America. A similar conclusion was reached by Finkenbinder et al. (2016) based on lake sediment records from Newfoundland. They argued that this transition took place around 4.3 ka, leading to wetter conditions across the Newfoundland region. In contrast, Bond et al. (2001) argued that North Atlantic SST anomalies around 4.2 ka were related to a negative North Atlantic Oscillation (NAO) pattern, linked to solar forcing. Deininger et al. (2017) also found that changes in the atmospheric circulation associated with northward and southward propagating westerlies (similar to the NAO but on a millennial instead of a decadal scale) could be a possible driver of coherency and cyclicity during the last 4.5 kyr, as seen in multiple speleothem δ18O records that span most of the European continent. Thus, although there have been many suggested mechanisms, the ultimate drivers for climatic anomalies at 4.2 ka remain unclear.
Wang (2009a) reviewed studies of Holocene cold events, and concluded that the most severe Holocene cold event, at ∼8.2 ka, was brought about by an outburst flood from proglacial Lake Agassiz. This large volume of freshwater drained into the North Atlantic extremely rapidly, leading to a brief reorganization of the Atlantic Meridional Overturning Circulation (AMOC) and a southward displacement of the ITCZ, resulting in dry conditions over many regions (Barber et al., 1999; Bianchi and McCave, 1999; Risebrobakken et al., 2003; McManus et al., 2004; Clarke et al., 2004). Potential external forcing factors for the 4.2 ka BP Event include non-linear responses to Milankovitch forcing, solar irradiance variations, and explosive volcanic eruptions, all of which may have brought about variations in the ocean–atmosphere system (Booth et al., 2005). Wang (2009a) concluded that solar irradiance minima were the main cause of cold events in the middle to late Holocene (including the 4.2 ka BP Event) and that internal oscillations within the climate system could possibly have intensified these cold events under certain circumstances (Wang, 2009b).
In summary, the 8.2 ka event and corresponding southward shift in the ITCZ were caused by glacial flooding of the North Atlantic and this can be reasonably simulated by coupled general circulation models (GCMs) with different boundary conditions and freshwater forcing (Alley and Agustsdottir, 2005; LeGrande et al., 2006). By contrast, the forcing mechanisms that brought about the 4.2 ka BP Event are currently uncertain. At 4.2 ka, the major global monsoon and ocean–atmosphere circulation systems may have been deflected or weakened synchronously, causing major century-scale precipitation disruptions, with severe megadroughts over many different regions (Weiss, 2017). As GCM simulations of the 4.2 ka BP Event have not received much attention, in this study, the spatial patterns and corresponding mechanisms relevant to the 4.2 ka BP Event are examined and compared to those associated with the 8.2 ka event.
Simulations of the last 21 kyr (TRACE-21) were used in this study (He, 2011; He et al., 2013; Wen et al., 2016). These transient simulations have been completed using version 3 of the Community Climate System Model (CCSM3), which is a coupled ocean–atmosphere general circulation model developed by the National Center for Atmospheric Research (NCAR). The atmosphere model in the CCSM3 is the Community Atmospheric Model 3 (CAM3) with a horizontal resolution of ∼3.75∘ (T31), and the ocean model is the Parallel Ocean Program (POP) with a longitudinal resolution of 3.6∘ and variable latitudinal resolution.
The “full-forcing” TRACE-21 simulation includes changes in orbital parameters, greenhouse gases, ice extent (based on the ICE 5G-VM2 configurations), and meltwater fluxes from the Northern Hemisphere and Antarctic ice sheets. The orbital forcing is based on transient variations of orbital configuration (Berger, 1978). The concentrations of greenhouse gases were adopted from Joos and Spahni (2008). The ice sheet data were modified from the reconstruction of Peltier (2004) and the meltwater scheme was adopted from Liu et al. (2009).
Simulations in which only one of these factors was included have also been carried out and are available in the TRACE-21 archive (Otto-Bliesner et al., 2006; Wen et al., 2016). These simulations can reproduce the timing and magnitude of many aspects of climate evolution during the last 21 ka, such as changes in SST (He et al., 2013). However, there are significant differences between the rate of temperature change in the model during the early Holocene and many paleoclimatic records (Liu et al., 2014a; Marcott et al., 2013; Marsicek et al., 2018). In this study, we do not address this enigma but use the transient model data to compare intervals within the Holocene when abrupt changes in climate are known to have occurred in some regions (∼8.2 and ∼4.2 ka). These times were recently adopted by the International Commission on Stratigraphy as the chronological boundaries of the early, middle, and late Holocene (Walker et al., 2012, 2018).
We examine mean annual surface temperature, annual precipitation, and SSTs from the full-forcing experiment, and also AMOC strength, defined as the maximum Atlantic stream function between 20 and 50∘ N between 500 and 5000 m depth (Ottera et al., 2010) from the full-forcing and orbital-forcing experiments.
First, we assess Holocene climate variability as simulated in the full-forcing experiment. Figure 1 shows the time series of surface temperature and precipitation over the last 13 kyr. It shows cooling associated with the Younger Dryas, followed by Holocene warming, but also a brief cooling episode from ∼8500 to 8000 BP. Thereafter, the record exhibits strong multi-century-scale variability. Temperature and precipitation are positively correlated at this global scale. It is tempting to associate the colder episodes with those identified by Wanner et al. (2011) or Bond et al. (2001) but only a few of these are coincident in time.
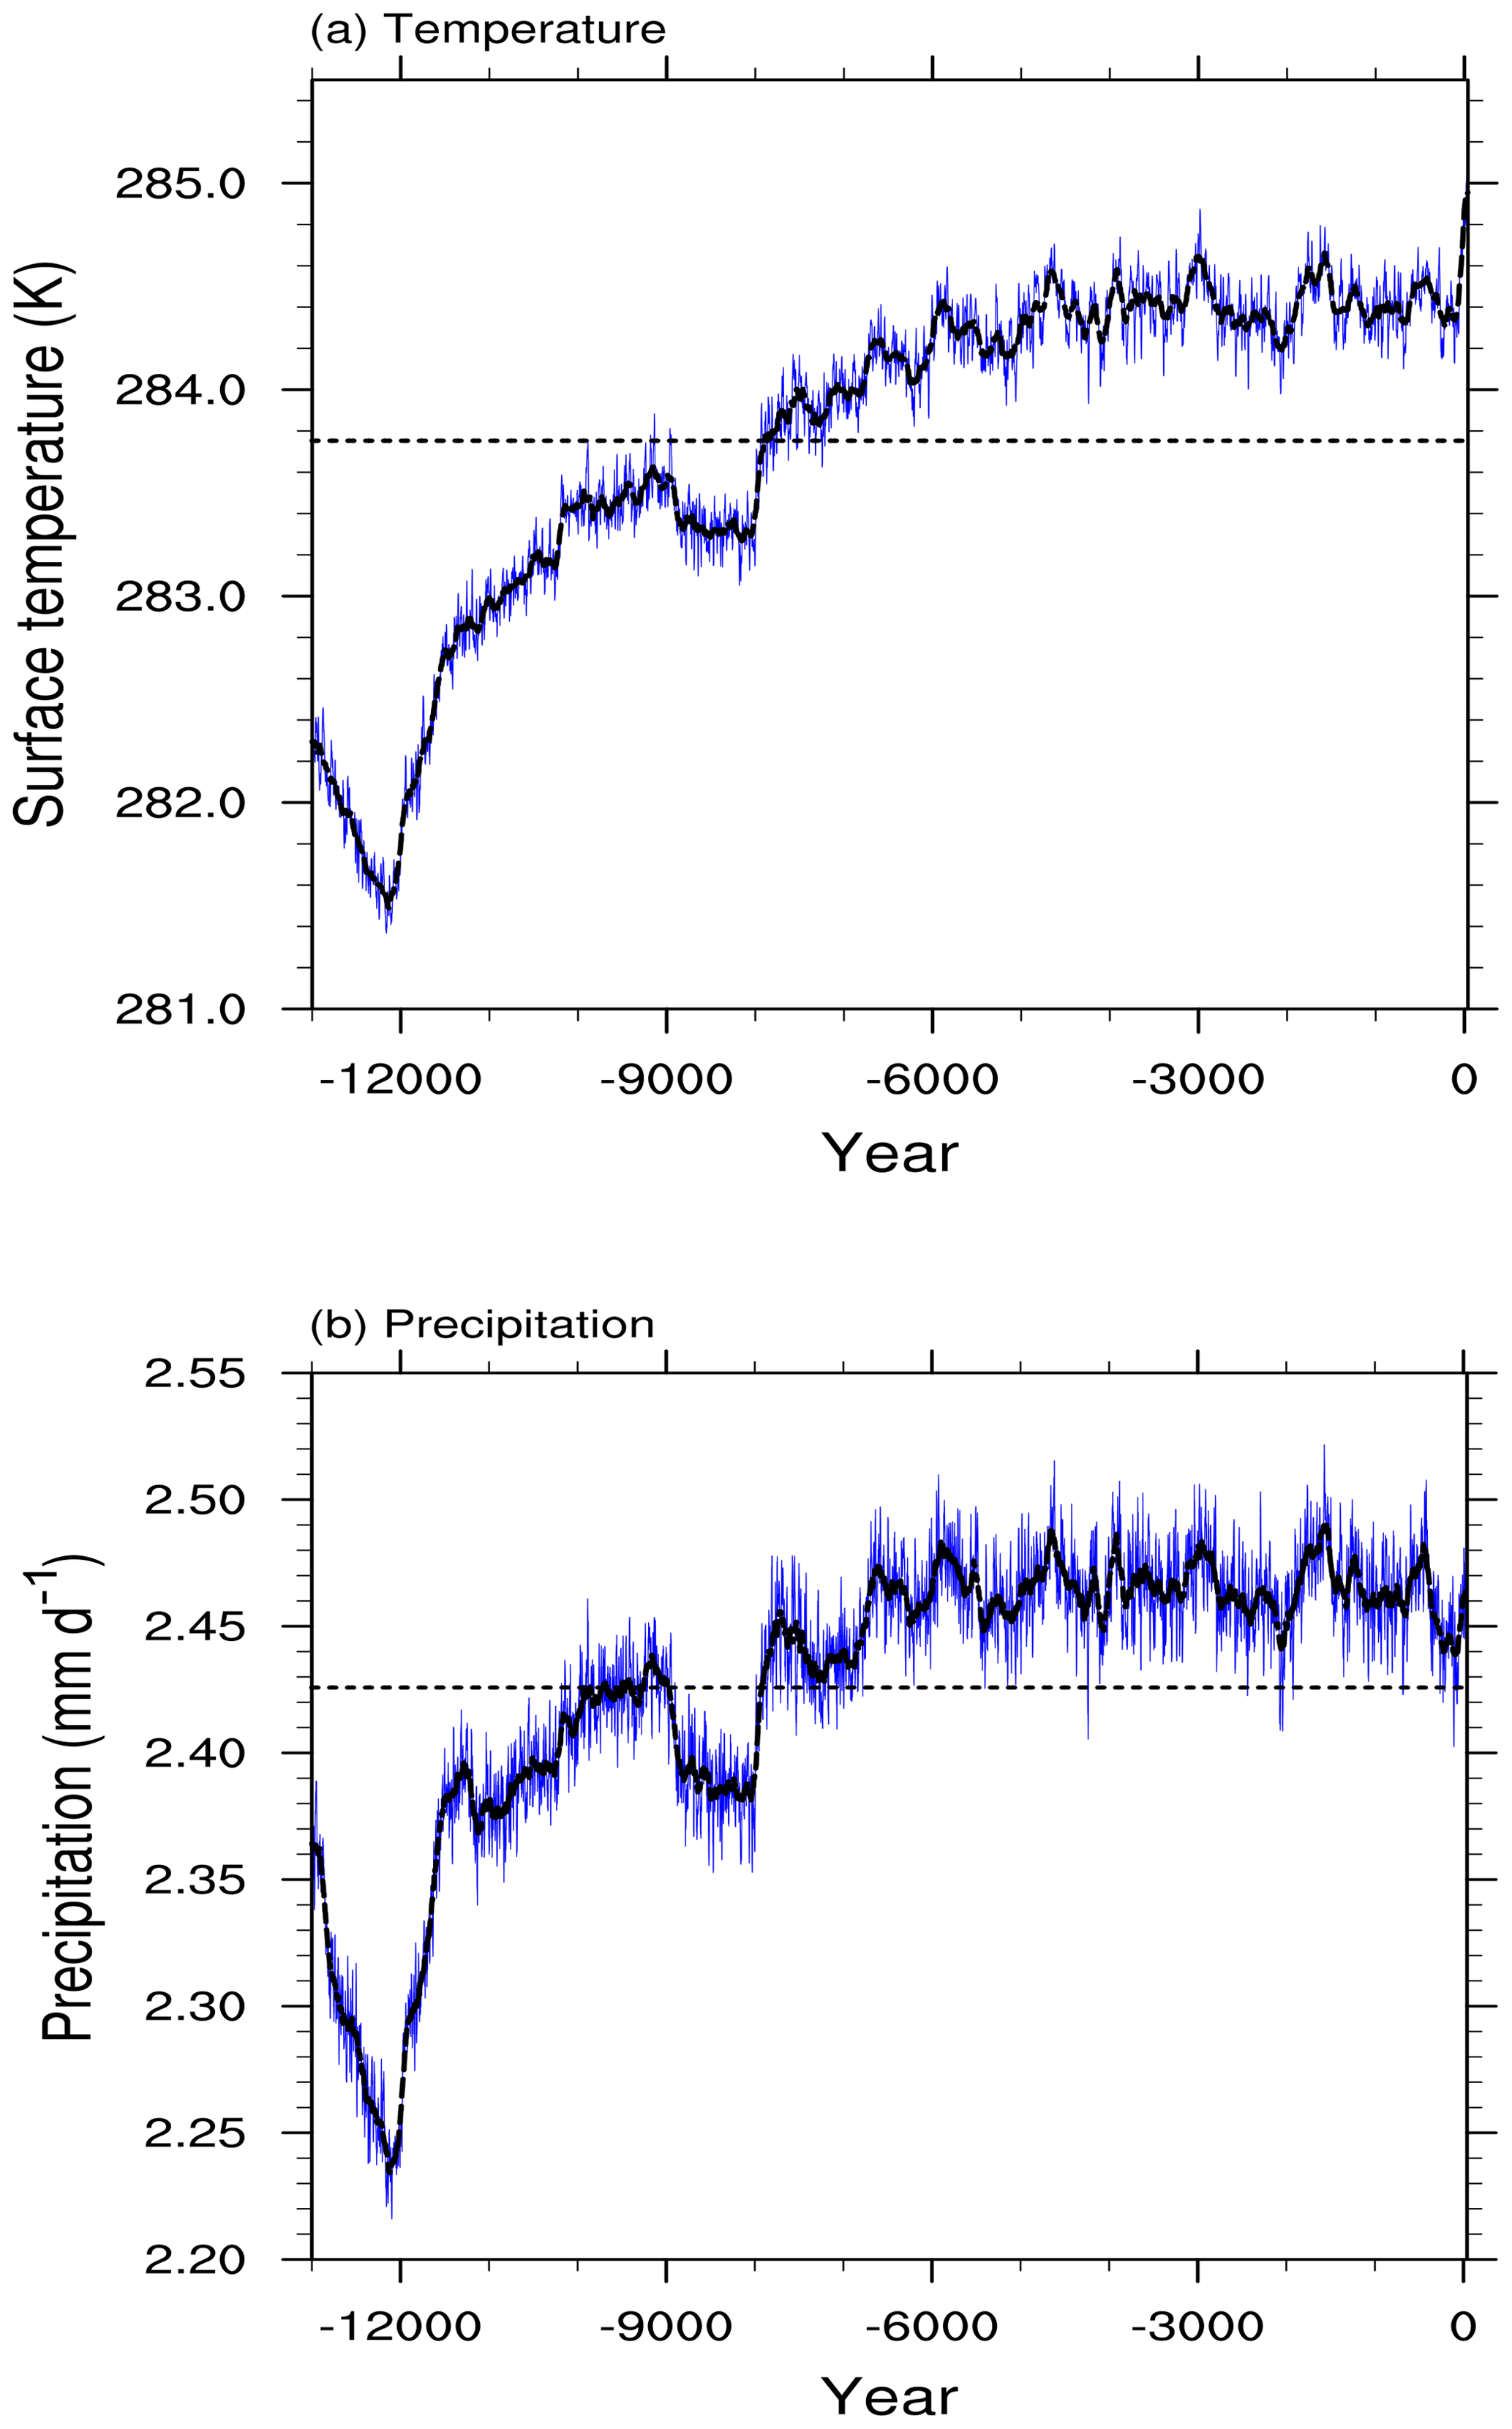
Figure 1(a) Northern Hemisphere average surface temperature and (b) precipitation over the last 13 kyr from the all-forcing experiment. The blue line is the 10-year running average and the black line is the 100-year running average. The black dashed line shows the average of the time series.
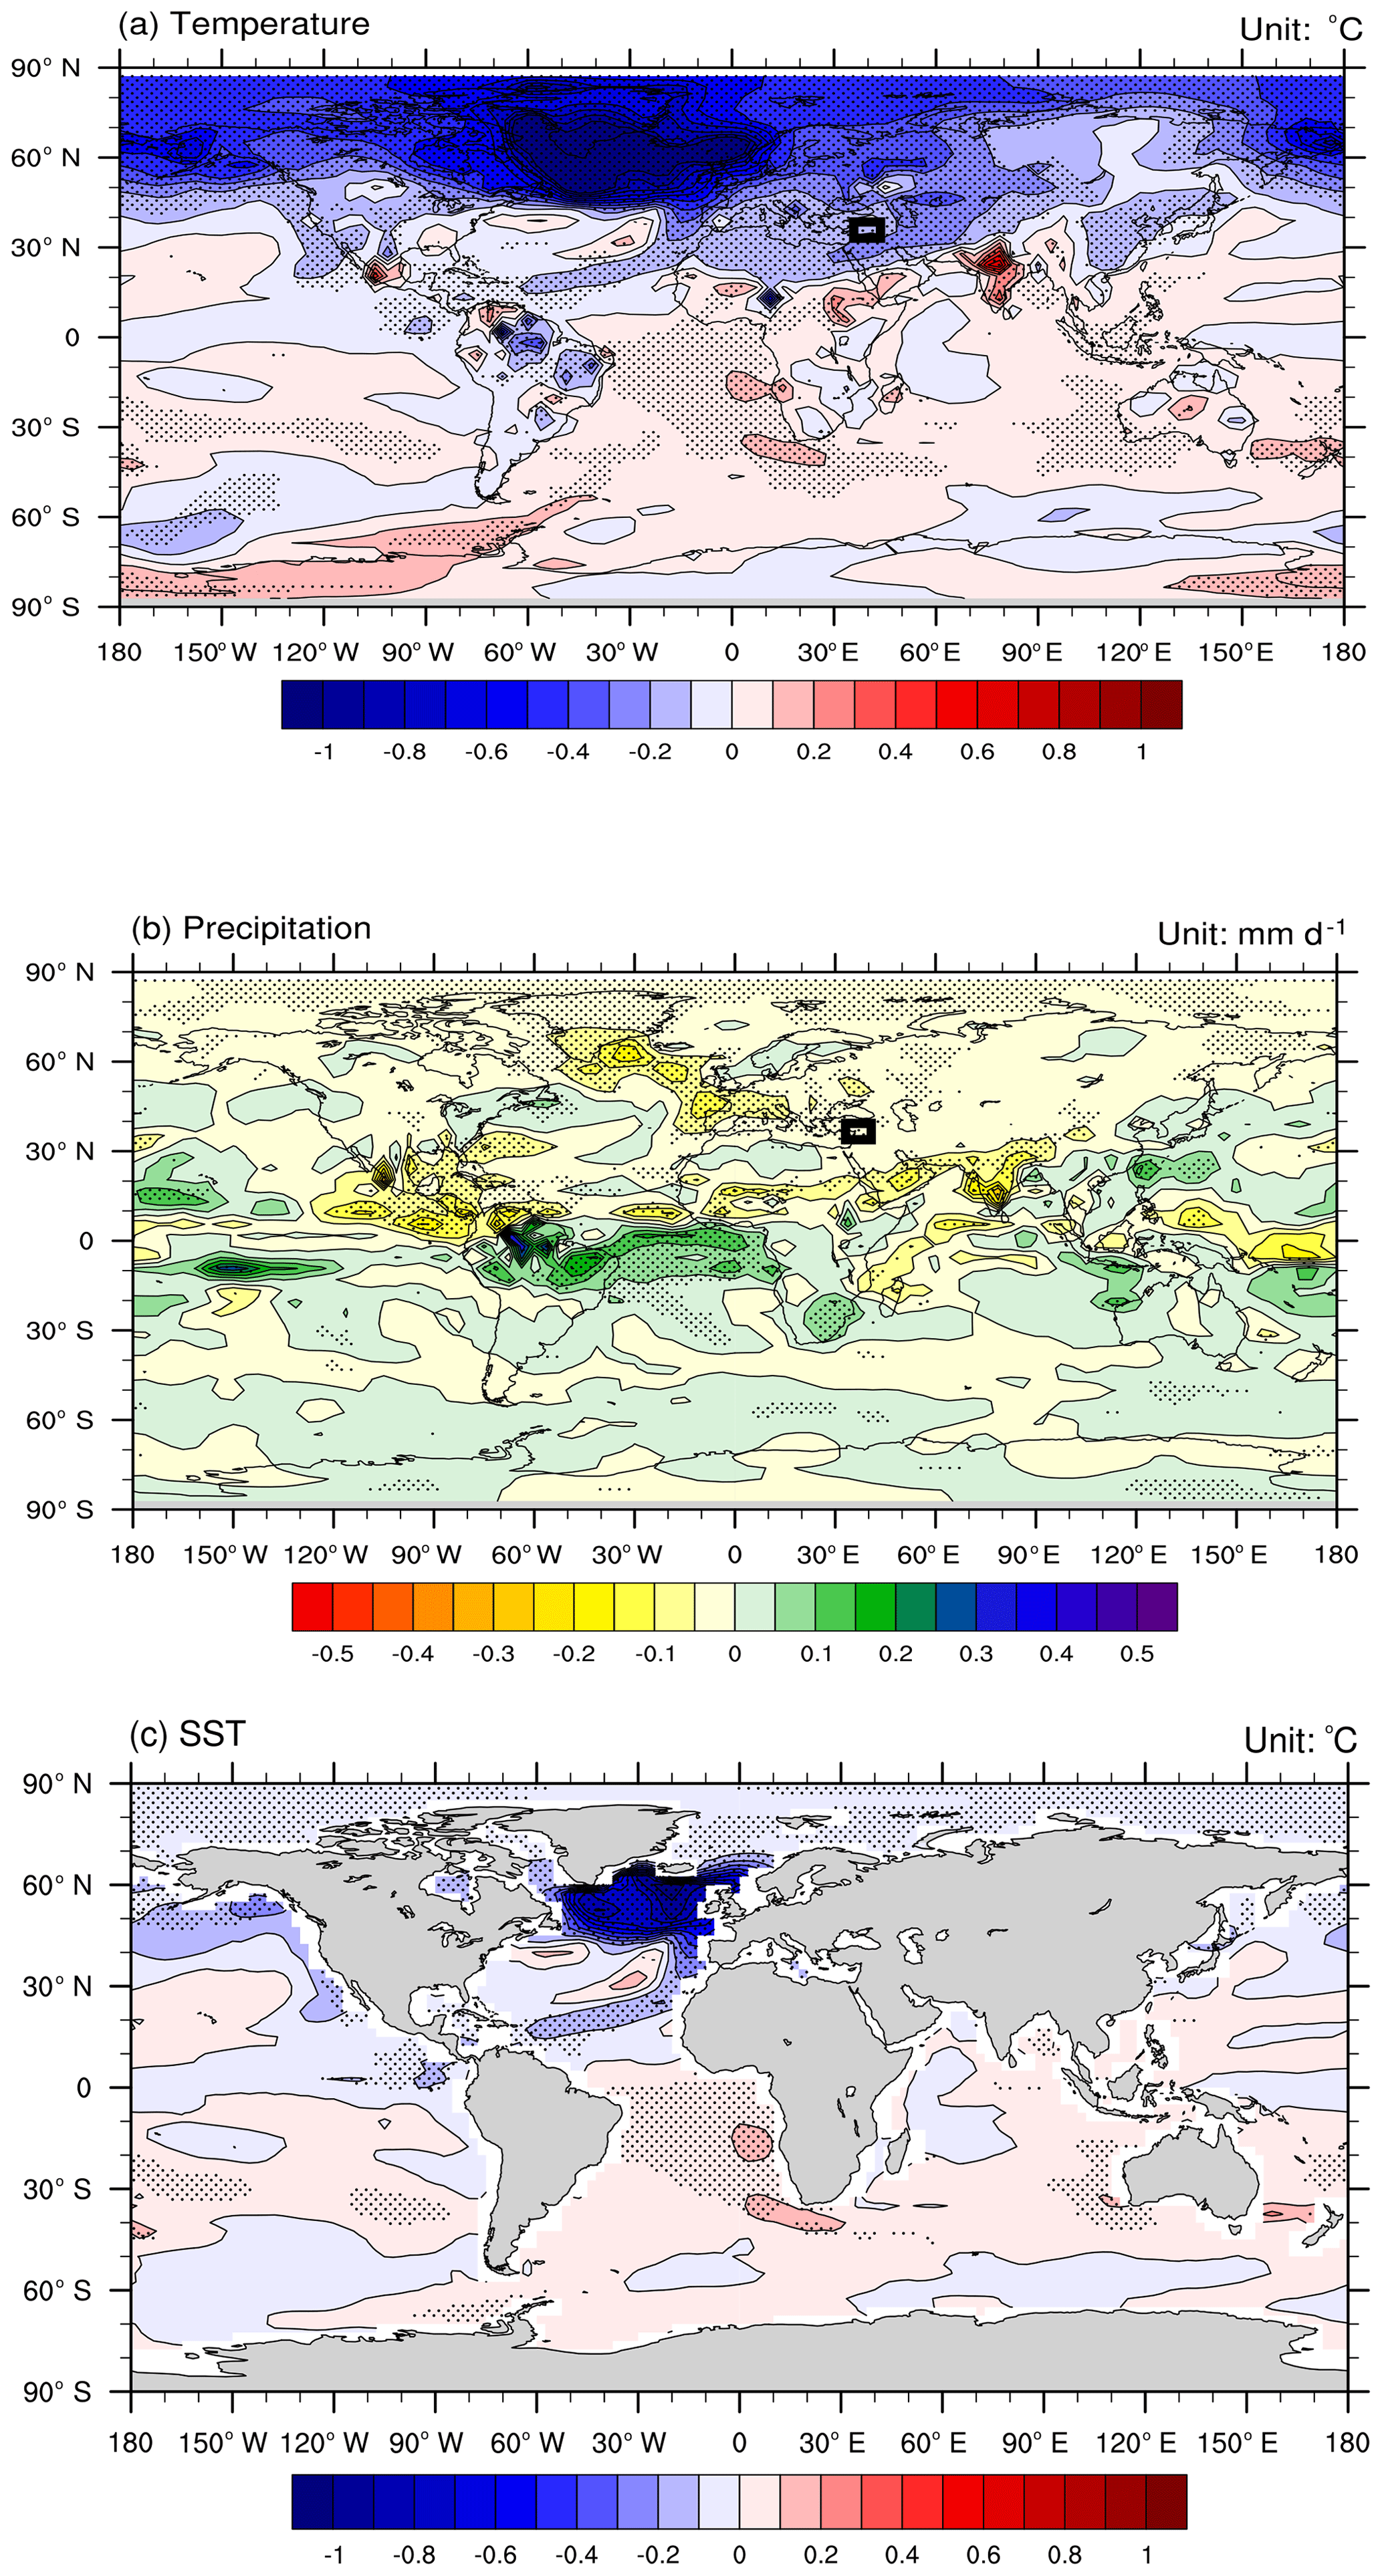
Figure 2The changes of (a) surface temperature (∘C), (b) precipitation (mm day−1), and (c) SST (∘C) after 4.5 ka (between 4500–4000 and 4800–4500 BP). The rectangles in panels (a) and (b) indicate the region with major dry-farming settlement abandonment around 4.2 ka, according to Weiss (2016).
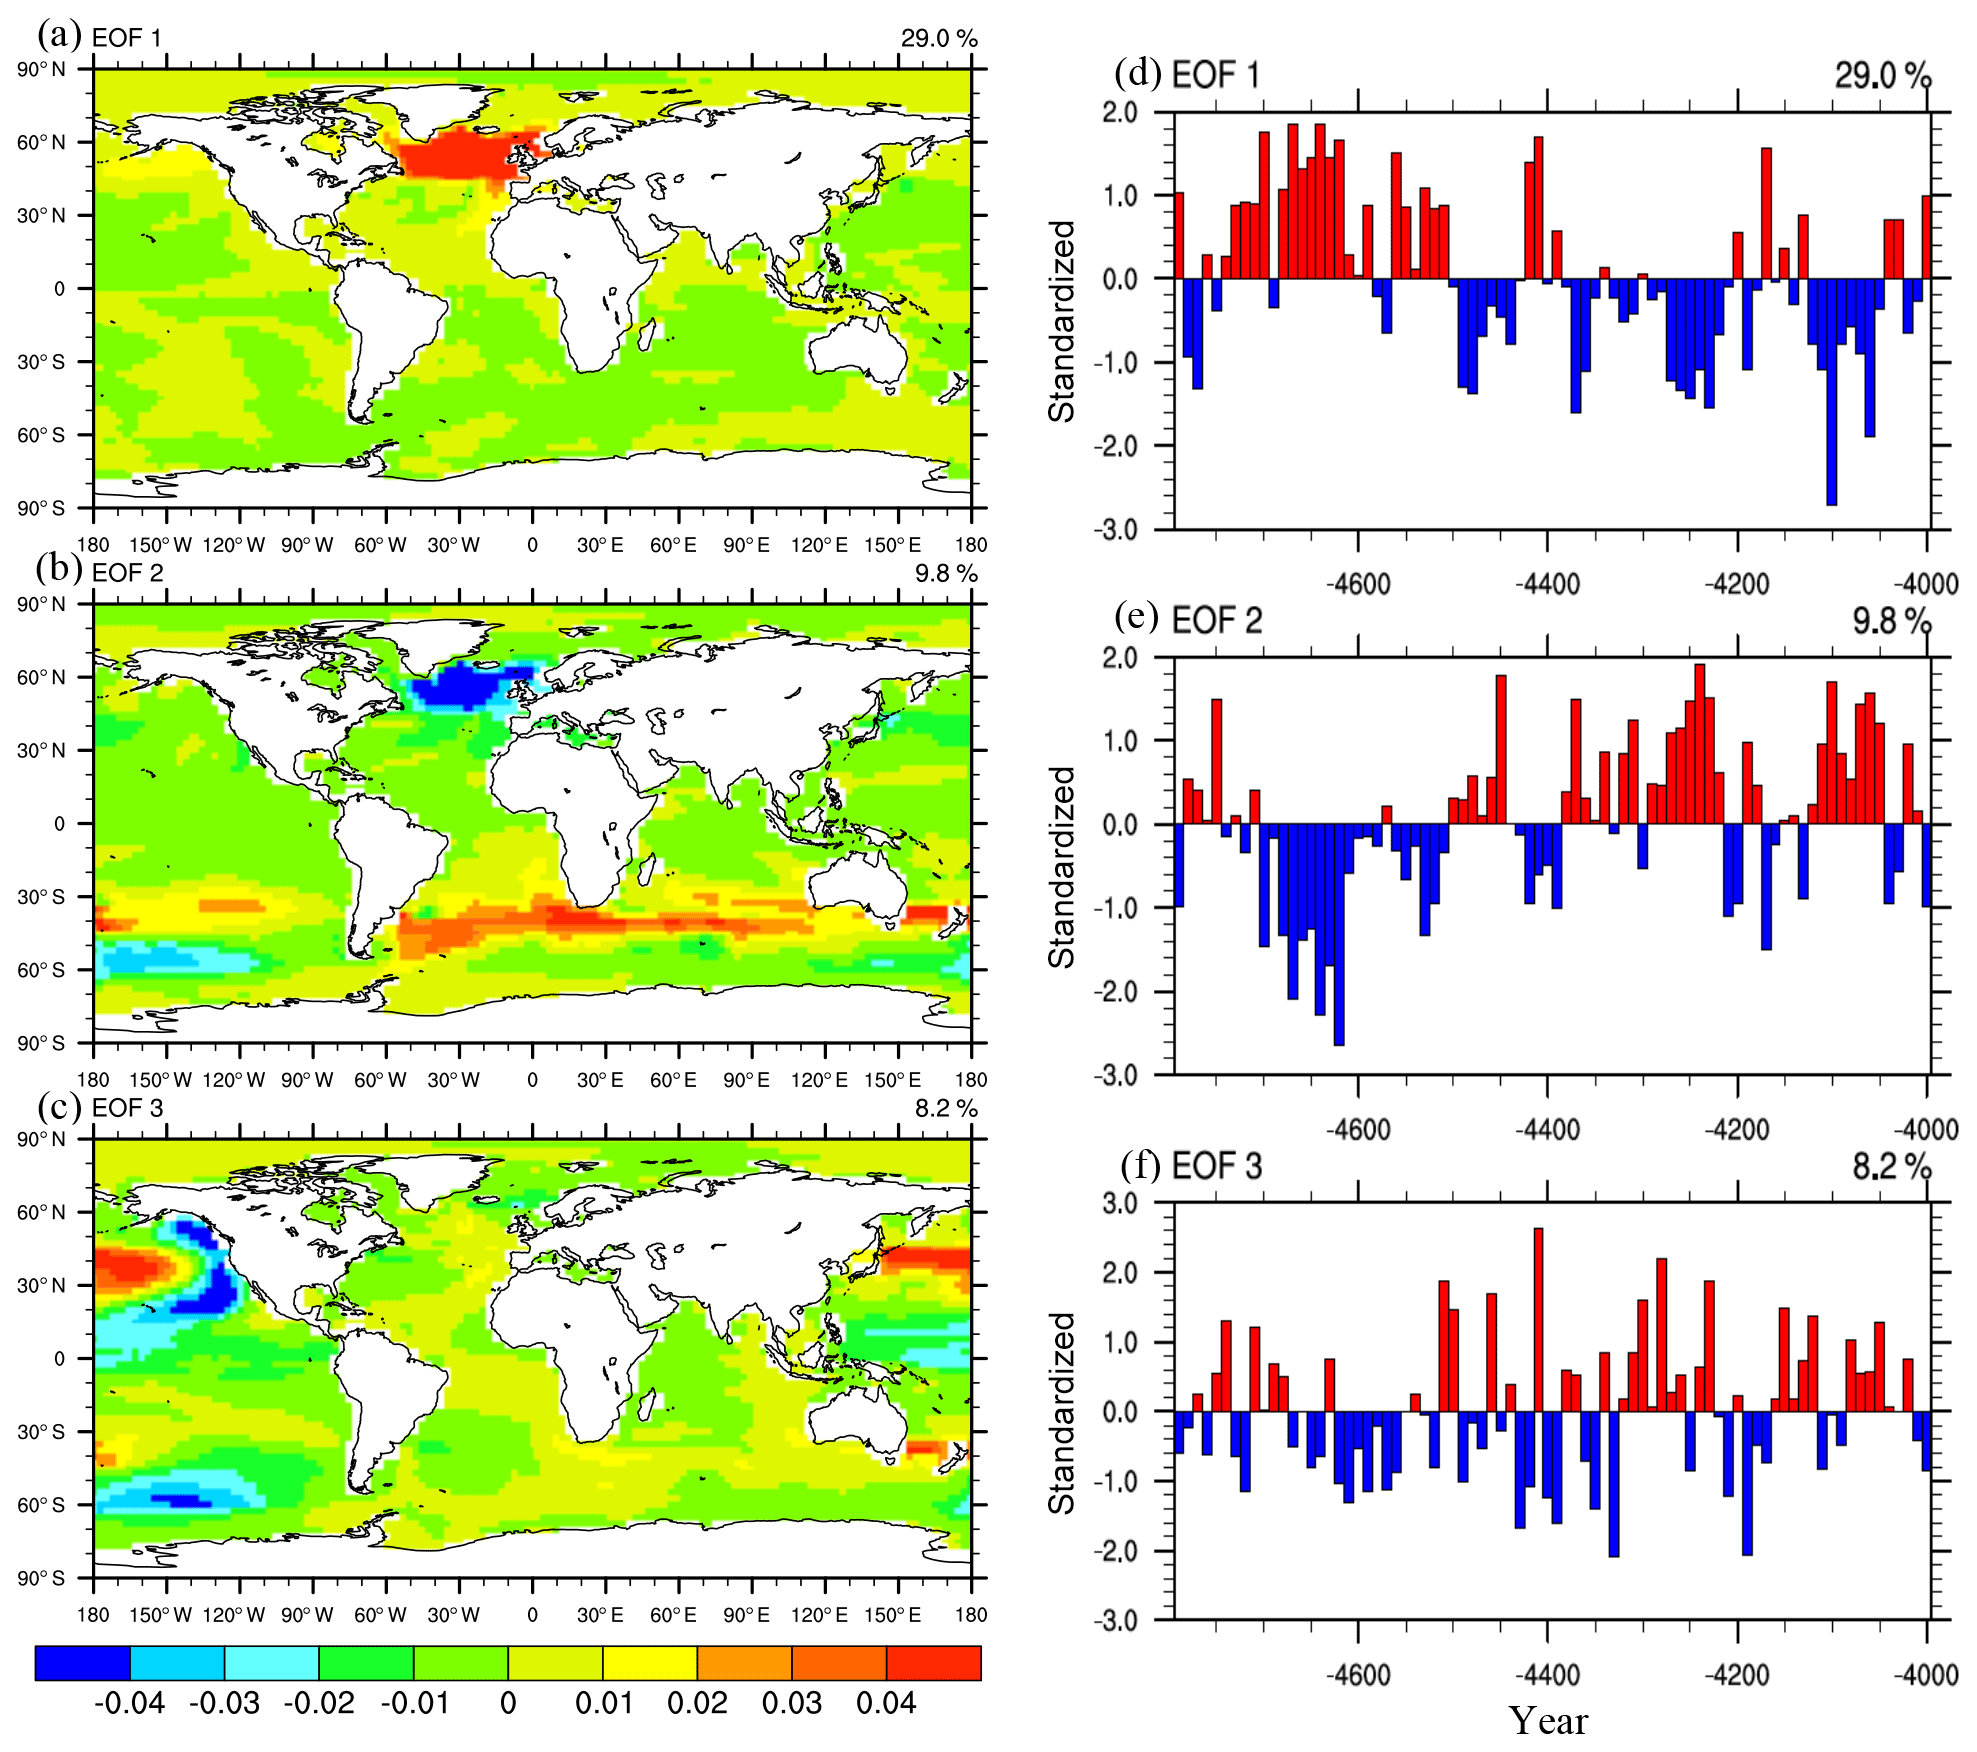
Figure 3The first three patterns (a–c) and principal components (d–f) of rotated empirical orthogonal function (EOF) modes on the SST over the period 4800–4000 BP.
The period 4.5–4.0 ka was chosen for analysis, by subtracting the mean annual 2 m air temperatures, SSTs, and precipitation of the period 4500–4000 BP from the preceding period (4800–4500 BP). The spatial distribution of air temperature (Fig. 2a) shows that temperatures were significantly colder over most of the extratropical Northern Hemisphere but generally warmer in the tropics and in the Southern Hemisphere. The main exceptions are northern South America, which was cooler, and northern India and Pakistan, which were significantly warmer. Precipitation decreased over almost all of the Northern Hemisphere, particularly in the tropics where the ITCZ shifted southward, mainly over South America and adjacent ocean regions, resulting in higher rainfall in the 0–20∘ S zonal band from 4500 to 4000 BP (Fig. 2b). There was less precipitation over the northern part of China but more precipitation over southern China, consistent with paleoclimate reconstructions that indicate a weaker East Asian monsoon (Wang et al., 2005; Tan et al., 2018a). This pattern is also similar to the situation during the Little Ice Age (LIA) in China and some of the megadroughts that have happened in recent centuries (Cook et al., 2010; Tan et al., 2018b). Over other Asian monsoon regions, such as India, there were also significant precipitation reductions during the second half of the 5th millennium BP, consistent with speleothem records that show a decline in Indian summer monsoon rainfall over this period (Kathayat et al., 2017). Over Central America and the northern edge of South America, conditions were also drier in the later period, but over the rest of South America, and adjacent ocean regions, precipitation was higher, due to a southward displacement of the ITCZ; this pattern is supported by speleothem records of rainfall in Mexico and Brazil (Lachniet et al., 2013; Bernal et al., 2016). The SST pattern shows significantly cooler temperatures in the period 4500–4000 BP over the North Atlantic. This cooling is centered around 50∘ N (south of Iceland) and extends into the subtropics on the eastern side of the subtropical gyre. Slightly cooler temperatures are also found over the North Pacific (Fig. 2c). By contrast, for most of the Southern Hemisphere, there was a positive change in temperature. Rotated empirical orthogonal function (EOF) analysis on the global SST field shows the primary feature (in EOFs 1 and 2) to be the cooler SSTs over the North Atlantic, with a shift around 4.5 ka from a predominantly positive to a generally negative pattern (Fig. 3). This is similar to an AMOC-like pattern over the northern Atlantic that has been identified in both instrumental and paleoclimatic records (Delworth and Mann, 2000; Knudsen et al., 2011).
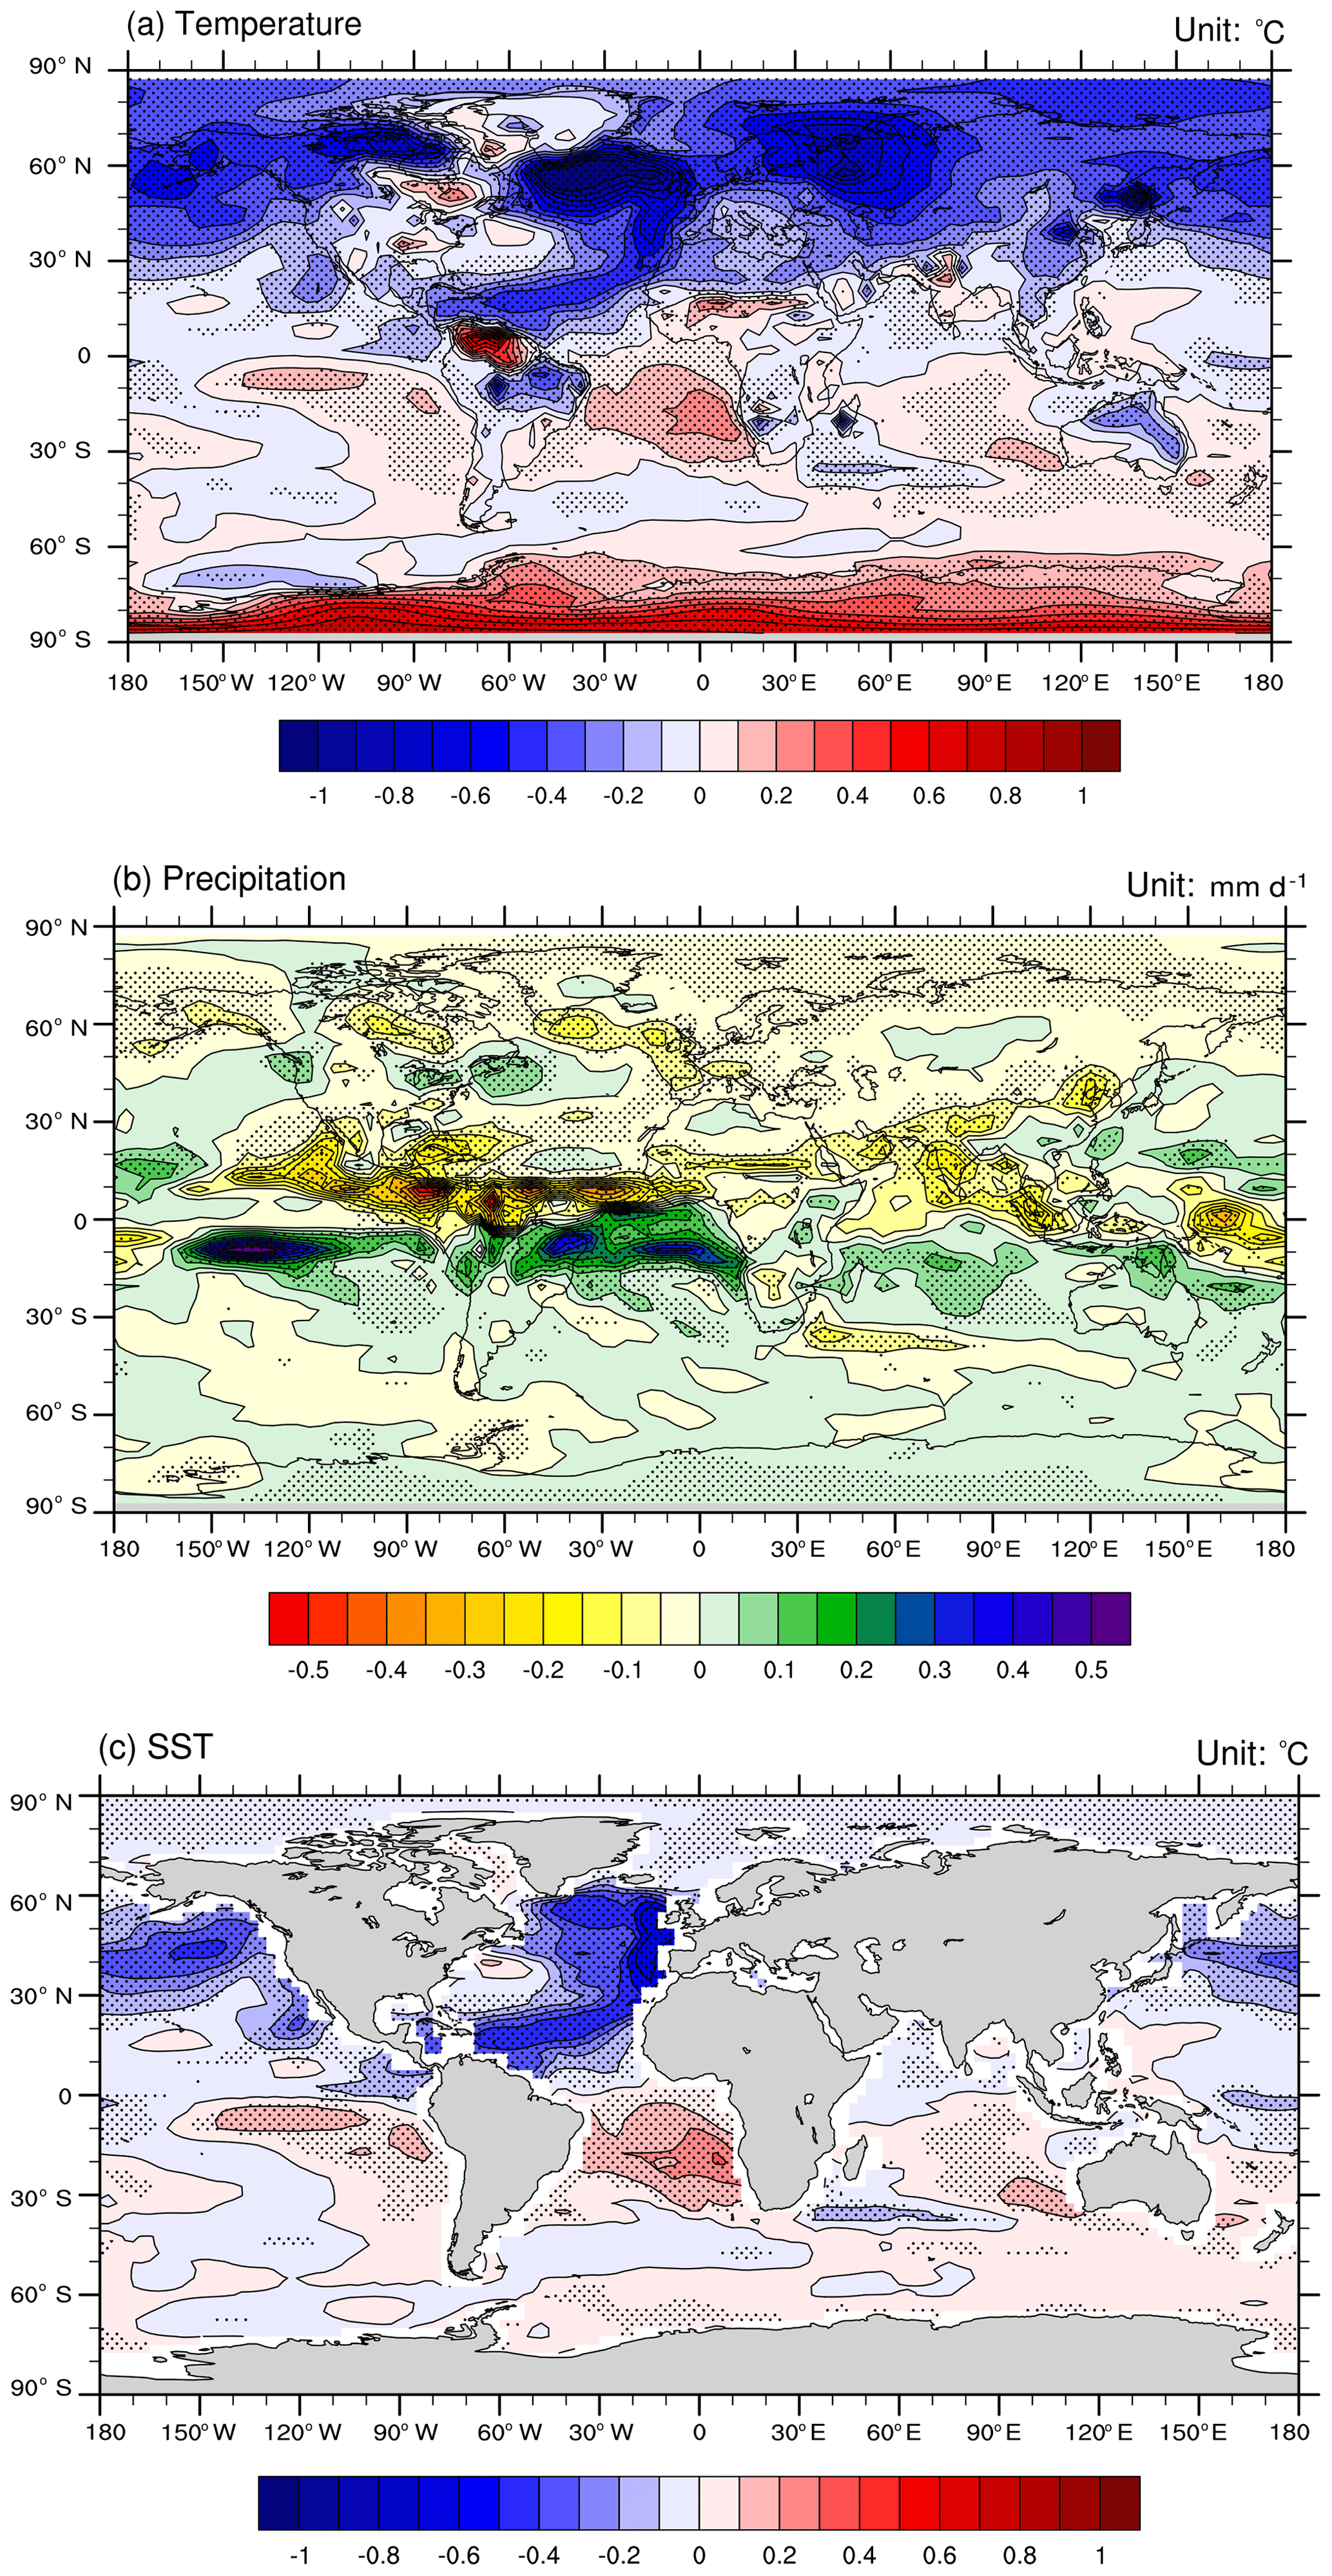
Figure 4The changes of (a) surface temperature (∘C), (b) precipitation (mm day−1), and (c) SST (∘C) after 8.8 ka (between 8800–8000 and 9200–8800 BP).

Figure 5The first three patterns (a–c) and principal components (d–f) of rotated EOF modes on the SST over the period 9200–8000 BP.
The same evaluation of changes in the 9th millennium BP was made by subtracting the mean annual 2 m air temperatures, SSTs, and precipitation from 8800 to 8000 BP from the preceding period (9200–8800 BP), since an abrupt change in temperature in the model occurred around 8.8 ka (Fig. 1a). Air temperatures were significantly lower in the second period over most of the Northern Hemisphere; only a zone from northern South America across to sub-Saharan Africa and India was warmer in the second period (Fig. 4a). Almost the entire Southern Hemisphere was warmer. Precipitation was lower in the second period across all of the Northern Hemisphere, especially along the ITCZ, which was displaced to the south. This resulted in increased rainfall in a belt south of the Equator, across almost all of the tropics (Fig. 4b). The rest of the Southern Hemisphere was also slightly wetter. SSTs show a strong pattern of cooling over the North Pacific, and the eastern North Atlantic, south of Iceland, extending around the Atlantic subtropical gyre into the tropical Atlantic and Caribbean (Fig. 4c). Rotated EOFs show that the anomalies in the North Atlantic and North Pacific dominate the first three EOFs (Fig. 5).
The spatial patterns of temperature changes, precipitation changes, and SST changes were remarkably similar in the late 9th millennium BP and in the period leading up to the late 5th millennium BP (Fig. 6). The major difference (Fig. 6a) is that SST changes over the subtropical Atlantic were greater, and the related changes across the Northern Hemisphere in the 9th millennium BP were larger than in the late 5th millennium BP. Similarly, the major changes in precipitation patterns were comparable but less pronounced from 4500–4000 BP. These similarities are somewhat puzzling as the meltwater forcing sensitivity experiment clearly shows that the 8.2 ka event was induced by a massive freshwater flux into the Atlantic, whereas (as far as we know) no comparable meltwater event occurred in the late Holocene, so it seems unlikely that such forcing was a factor driving the changes seen in the model output for 4500–4000 BP.
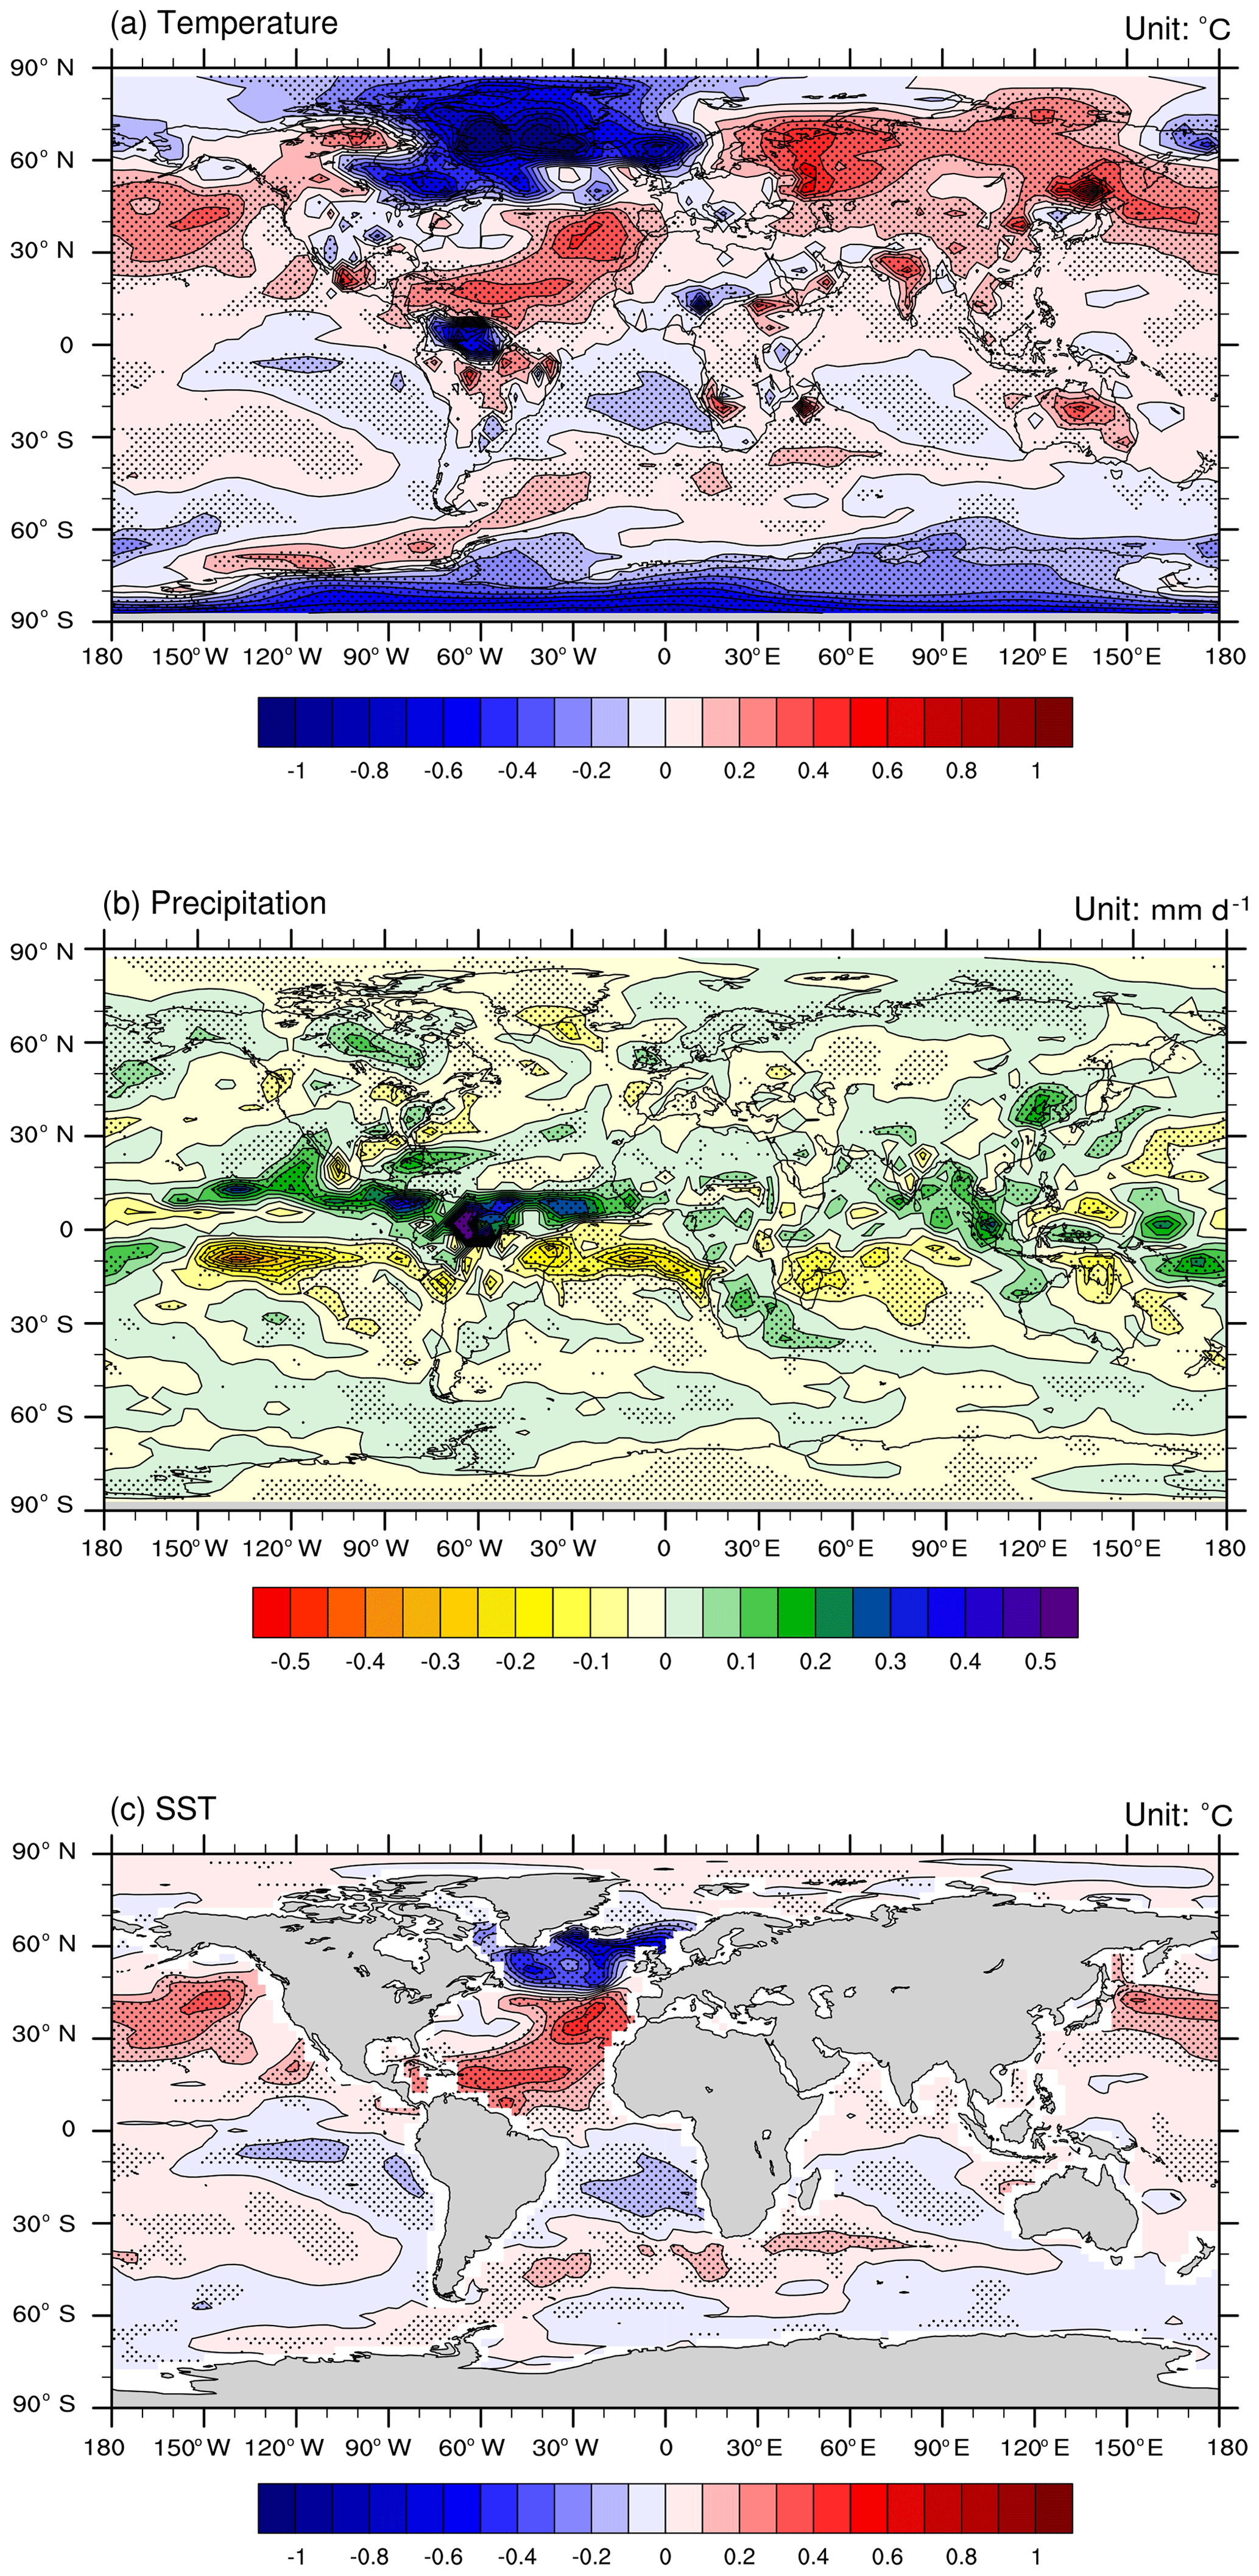
Figure 6The differences between changes of (a) surface temperature (∘C), (b) precipitation (mm day−1), and (c) SST (∘C) of the 5th millennium BP and 9th millennium BP periods shown in Figs. 2 and 4.
Paleoclimate records have shown that unusually dry conditions persisted for several centuries around 4.2 ka over many regions, and in some areas these had devastating societal impacts. In this study, the spatial patterns of temperature, precipitation, and corresponding circulation anomalies during the latter part of the 9th and 5th millennia BP (4800–4500 versus 4500–4000 BP and 9200–8800 versus 8800–8000 BP) were compared based on model simulations. The changes in climate during both periods were similar and characterized by significant temperature and precipitation decreases over most of the Northern Hemisphere, whereas the Southern Hemisphere was slightly warmer and wetter. In particular, the ITCZ was displaced to the south across much of the globe, and monsoon regions of the Northern Hemisphere were generally drier. On a regional scale, there was less precipitation over the northern part of China but more precipitation over southern China, indicating a reduced eastern Asian summer monsoon.
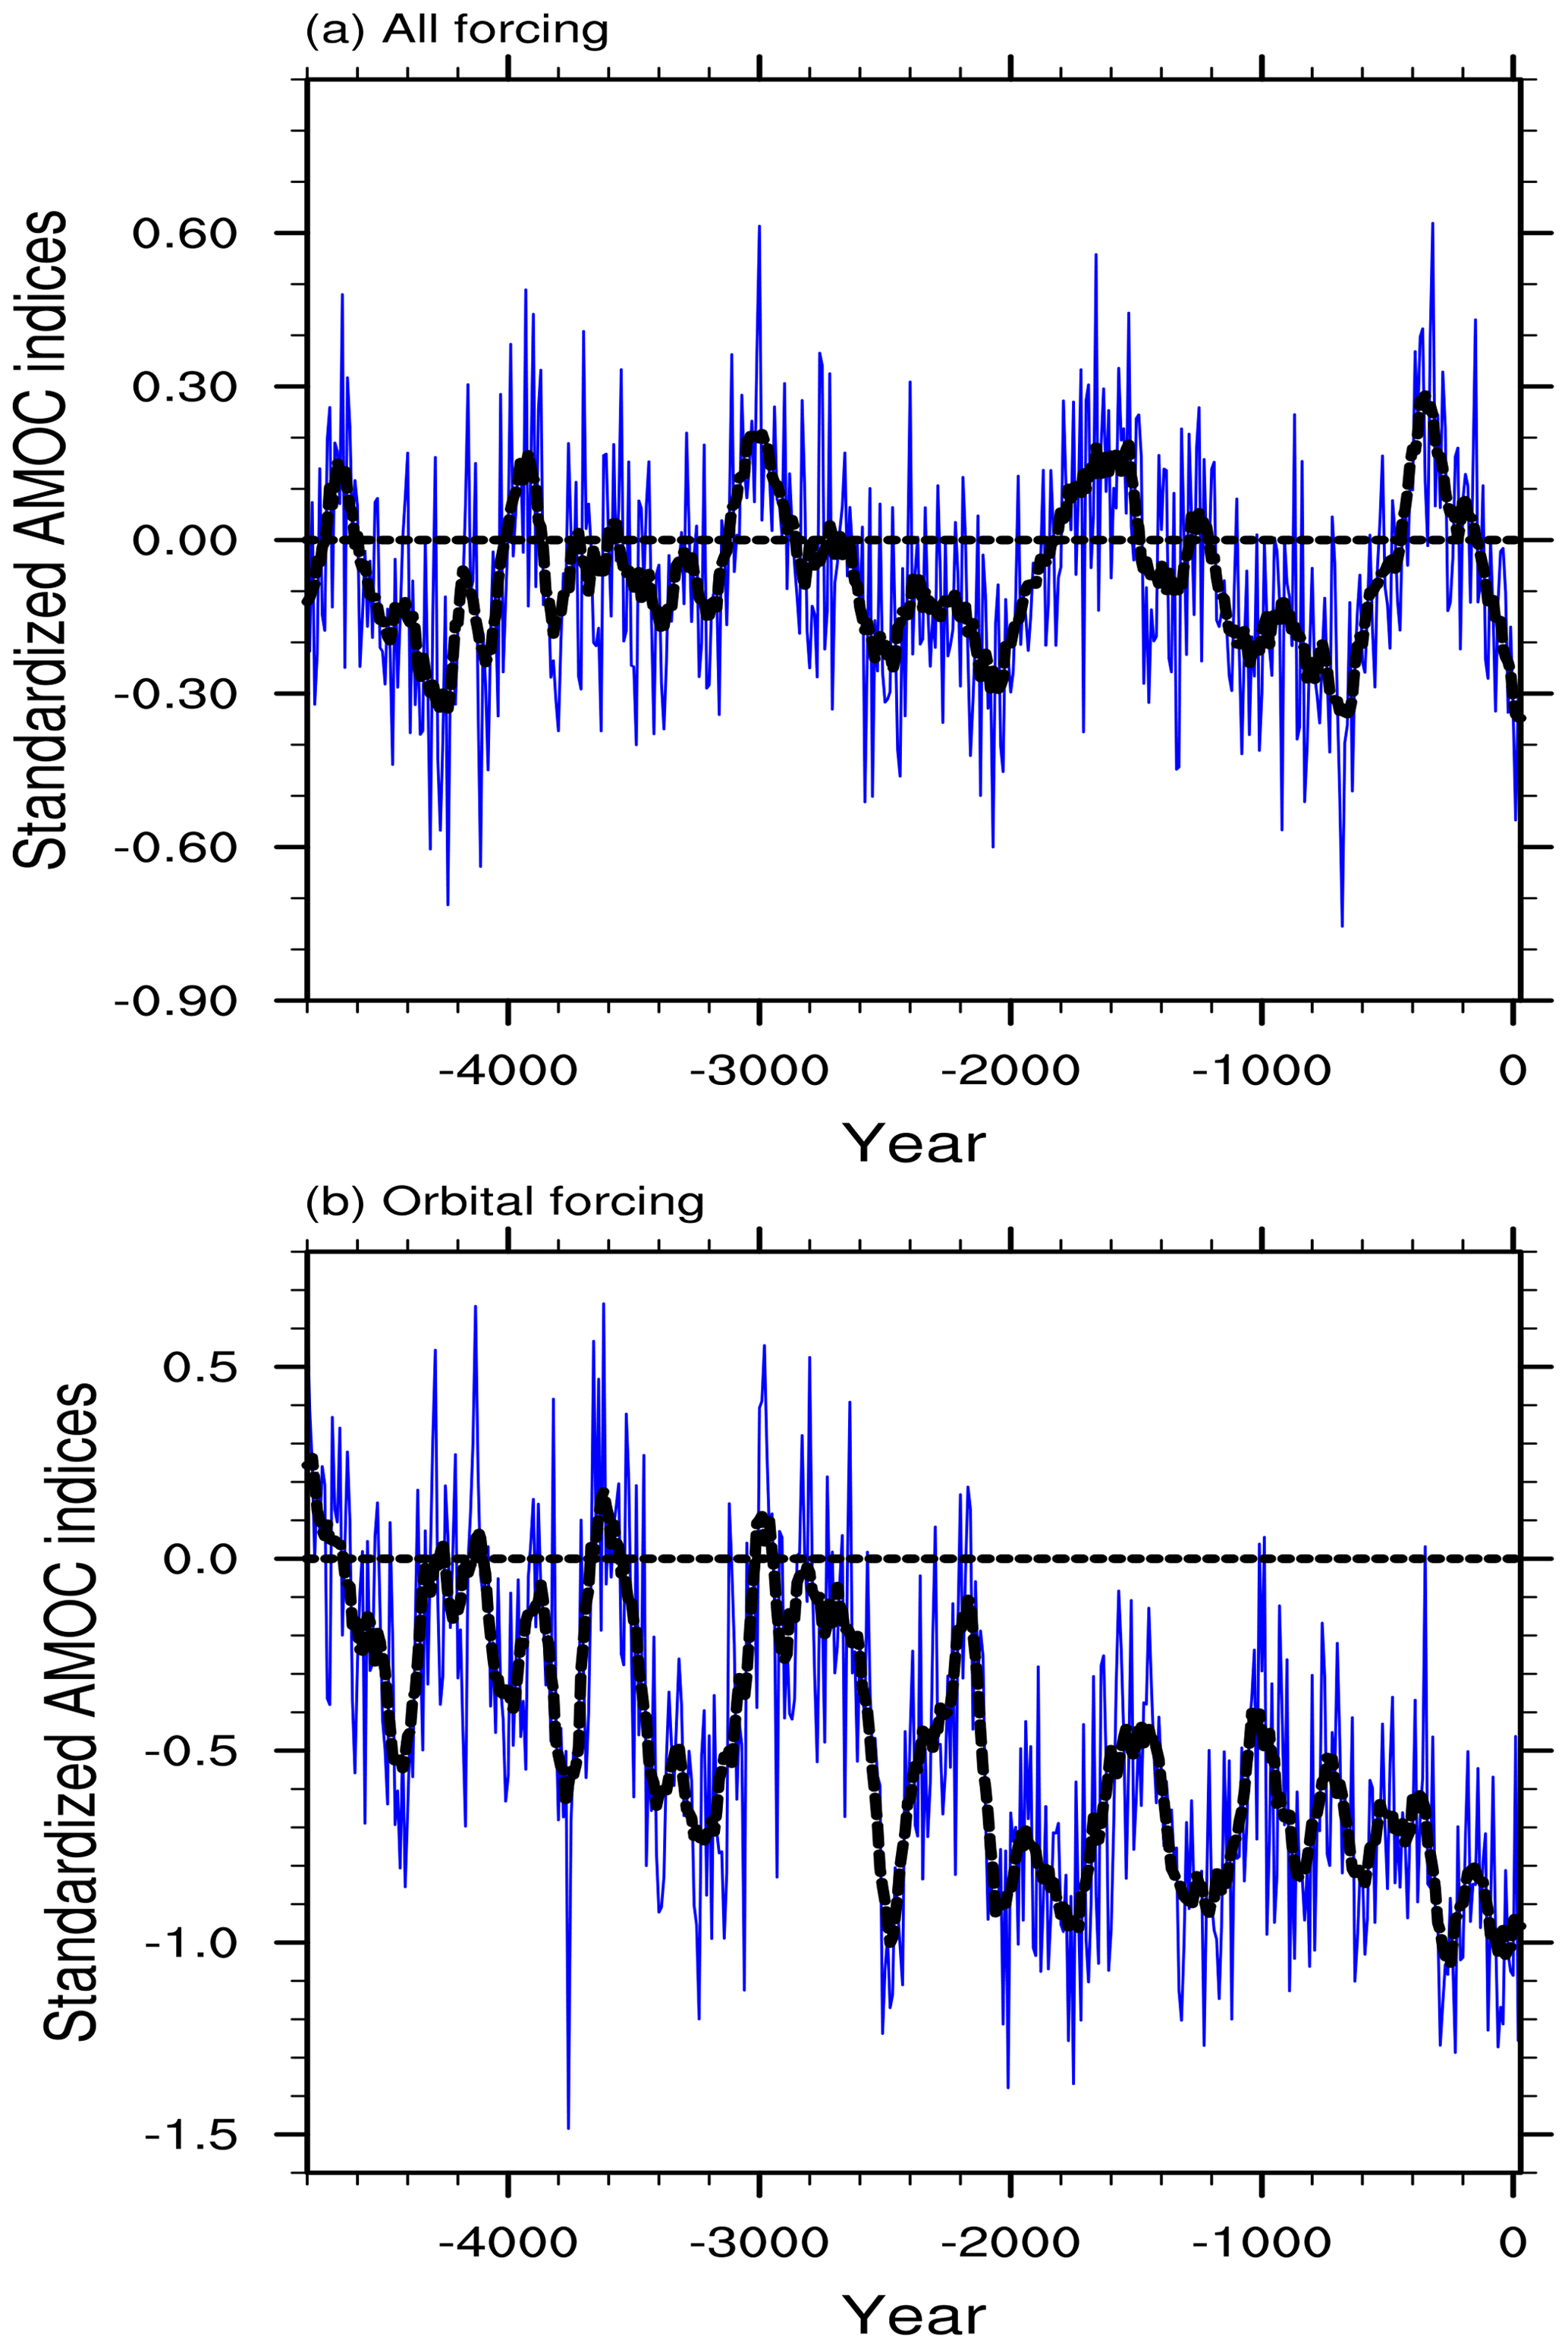
Figure 7The 10-year running averaged (blue line) and 100-year running averaged (black line) time series of AMOC strength, plotted as anomalies from the mean for 4800–4500 BP from (a) all-forcing experiment and (b) orbital-forcing experiment. AMOC strength was below the mean for 63 % of the time in the all-forcing experiment and 87 % of the time in the orbital-forcing experiment.
It is clear that the earlier period was strongly influenced by freshwater forcing in the North Atlantic, which drastically reduced the AMOC. The similarity in anomaly patterns between the 8.2 ka event and the late 5th millennium BP suggests that there was also disruption to the AMOC in the later period. However, as there was no comparable freshwater forcing in the 5th millennium BP, we must therefore consider what other factors might have played a role in reducing AMOC strength. There were no major solar irradiance changes at that time, so we can rule that out as a forcing factor. However, there was a major eruption of the Icelandic volcano Hekla at ∼4200 BP, and it is possible that such an event could have brought about regional cooling, leading to more extensive, thick sea ice and attendant freshwater effects on the AMOC (see Moreno-Chamarro et al., 2017). This mechanism deserves further scrutiny.
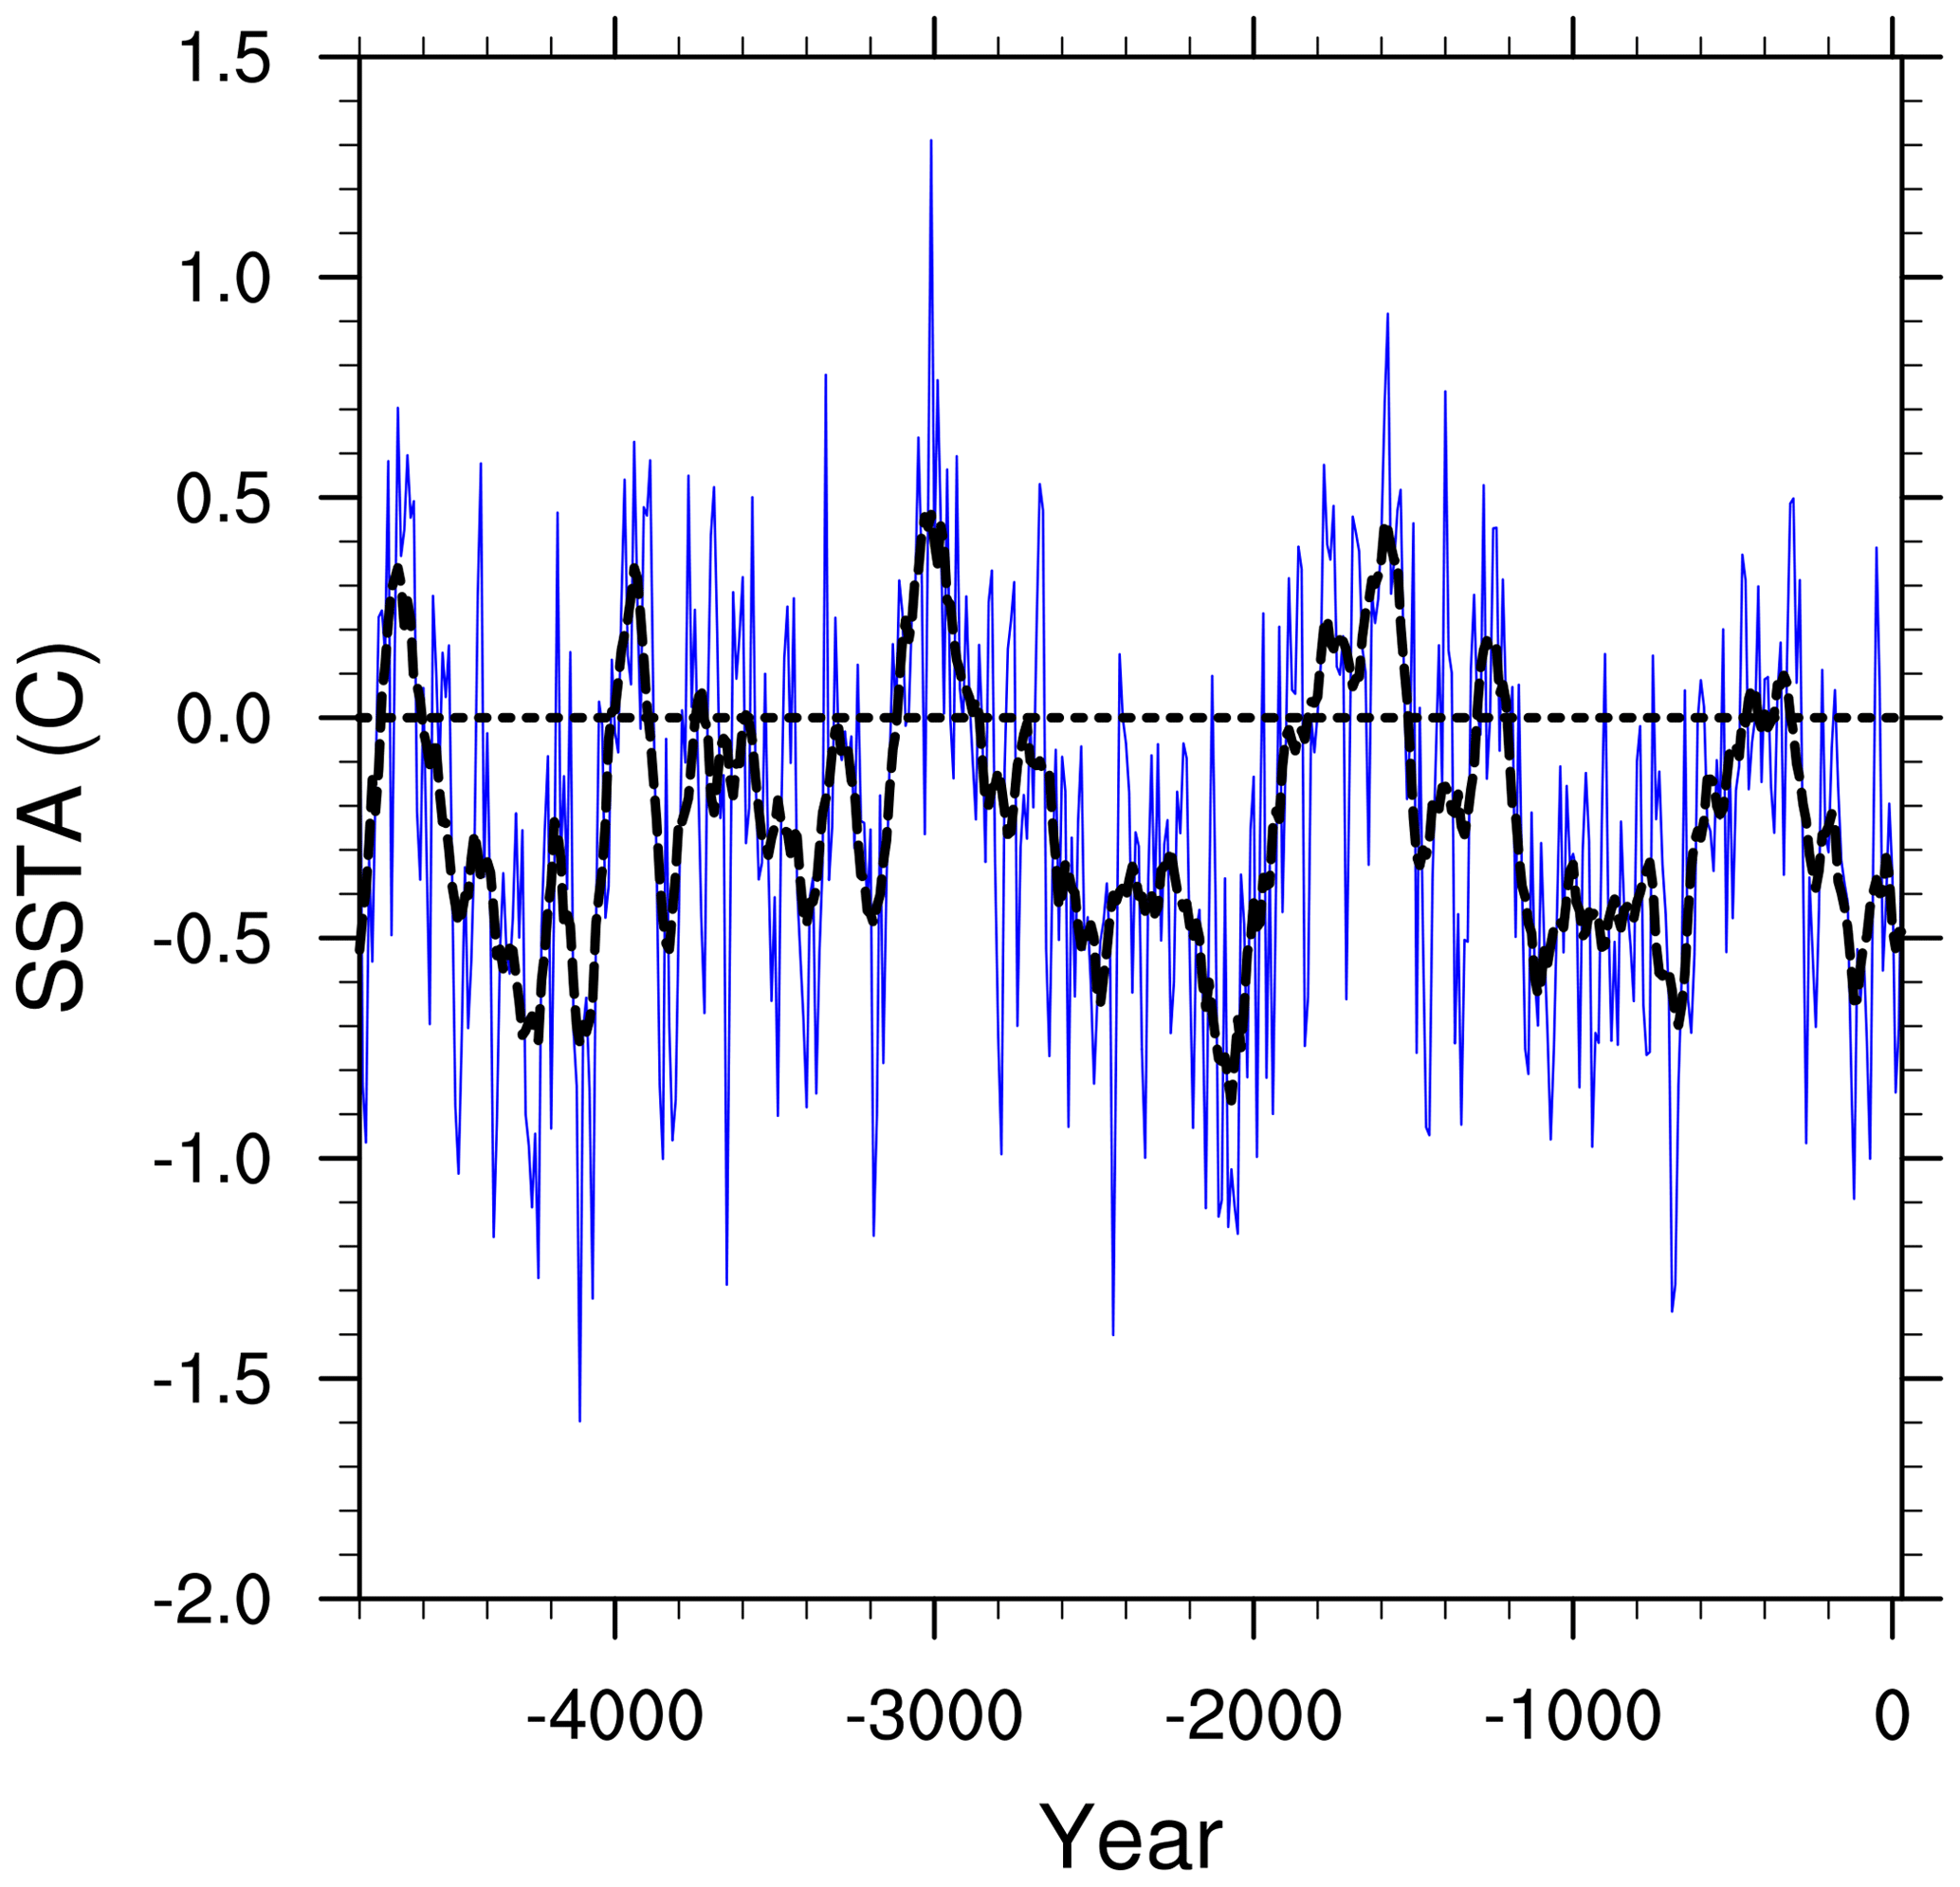
Figure 8The 10-year running averaged (blue line) and 100-year running averaged (black line) SSTs in the area of the North Atlantic with significant negative SST differences between the 5th millennium BP and 9th millennium BP periods (40–60∘ N, 7.5–60∘ W) in Fig. 2c, plotted as anomalies from the mean for 4800–4500 BP; ∼69 % of the time, temperatures in this region were below the mean.
In the all-forcing TRACE-21 simulation, AMOC strength declined slightly during the late Holocene and underwent multi-century fluctuations (Fig. 7a), which were strongly correlated with SSTs in the region of the North Atlantic where cooling was so prominent from 4.5 to 4.0 ka (Fig. 8). Mean SSTs in this region over the last 4500 years of the model simulation stayed below the 4.8–4.5 ka average for ∼69 % of the time (Fig. 8), and AMOC strength was similarly below the 4.8–4.5 ka mean for 63 % of the time (Fig. 7a). One of these fluctuations was associated with an AMOC minima around 4.2 ka. In the TRACE-21 model simulation with only orbital forcing, AMOC strength reached its Holocene maximum around 4.8 ka, then slightly weakened (by ∼10 %) over the late Holocene, staying below the 4.8–4.5 ka mean for 87 % of the time, with minor multi-century variations superimposed on the long-term downward trend (Fig. 7b). This suggests that a combination of factors, led by long-term changes in insolation, drove a steady decline in SSTs across the North Atlantic and a reduction in the AMOC, with associated teleconnections across the globe (including drought in some regions). Minor fluctuations around this declining trend were the dominant pattern for most of the last 4500 years. This interpretation helps explain widespread paleoclimatic evidence for the onset of neoglaciation around 5000–4500 BP, followed by a series of neoglacial advances and retreats during recent millennia (Porter, 2000; Barclay et al., 2009; Solomina et al., 2015; Bradley and Bakke, 2019). Since the onset of neoglaciation early in the 5th millennium BP, mountain glaciers fluctuated in extent but did not entirely disappear, indicating that a distinctly different climate state prevailed compared to the period prior to ∼5 ka, when many mountain regions were ice-free.
We therefore conclude from the model simulations that the 4.2 ka BP Event was one of several late Holocene multi-century fluctuations that were embedded in a long-term, low-frequency change in climate that occurred after ∼4.8 ka. Worldwide climatic anomalies during these fluctuations were driven by changes in the strength of the AMOC and related teleconnections. Whether such multi-century fluctuations were a response to internal centennial-scale ocean–atmosphere variability (see Yan et al., 2018), external forcing (such as explosive volcanic eruptions and associated feedbacks), or a combination of such conditions is not known. Further studies of the role of both external forcing and internal variability are needed to provide a better understanding of such mechanisms (see Ottera et al., 2010; Moreno-Chamarro et al., 2017; Gupta and Marshall, 2018).
The TraCE-21ka data used in this study can be accessed through the website of Earth System Grid (https://www.earthsystemgrid.org/project/trace.html, last access: 1 June 2018).
LN, RSB, and MY designed the experiments and carried them out. LN and MY performed the formal analyses. LN, RSB, and MY performed the investigation. LN and JL contributed to funding acquisition. JL and RSB provided supervision. LN and RSB prepared the paper with contributions from all co-authors.
The authors declare that they have no conflict of interest.
This article is part of the special issue “The 4.2 ka BP climatic event”. It is a result of “The 4.2 ka BP Event: An International Workshop”, Pisa, Italy, 10–12 January 2018.
This research was jointly supported by the National Key Research and
Development Program of China (grant no. 2016YFA0600401), the National Natural
Science Foundation of China (grant no. 41501210, grant no. 41420104002, grant
no. 41671197, and grant no. 41631175), the Jiangsu Province Natural Science
Foundation (grant no. BK20150977), Top-notch Academic Programs Project of
Jiangsu Higher Education Institutions (grant no.
PPZY2015B115), the Program of Innovative Research Team of Jiangsu Higher Education Institutions of China, and the Priority
Academic Development Program of Jiangsu Higher Education Institutions (grant
no. 164320H116). Support was also received from US NSF grant PLR-1417667 to
the University of Massachusetts. TraCE-21ka was made possible by the DOE
INCITE computing program and supported by NCAR, the NSF P2C2 program, and the
DOE Abrupt Change and EaSM programs.
Edited
by: Harvey Weiss
Reviewed by: two anonymous referees
Alley, R. B. and Agustsdottir, A. M.: The 8k event: cause and consequences of a major Holocene abrupt climate change, Quaternary Sci. Rev., 24, 1123–1149, https://doi.org/10.1016/j.quascirev.2004.12.004, 2005.
Barber, D. C., Dyke, A., Hillaire-Marcel, C., Jennings, A. E., Andrews, J. T., Kerwin, M. W., Bilodeau, G., McNeely, R., Southon, J., Morehead, M. D., and Gagnon, J. M.: Forcing of the cold event of 8,200 years ago by catastrophic drainage of Laurentide lakes, Nature, 400, 344–348, https://doi.org/10.1038/22504, 1999.
Barclay, D. J., Wiles, G. C., and Calkin, P. E.: Holocene glacier fluctuations in Alaska, Quaternary Sci. Rev., 28, 2034–2048, https://doi.org/10.1016/j.quascirev.2009.01.016, 2009.
Berger, A. L.: Long-term variations of daily insolation and Quaternary climatic changes, J. Atmos. Sci., 35, 2362–2367, https://doi.org/10.1175/1520-0469(1978)035<2362:LTVODI>2.0.CO;2, 1978.
Bernal, J. P., Cruz, F. W., Stríkis, N. M., Wang, X., Deininger, M., Catunda, M. C. A., Ortega-Obregón, C., Cheng, H., Edwards, R. L., and Auler, A. S.: High-resolution Holocene South American monsoon history recorded by a speleothem from Botuverá Cave, Brazil, Earth Planet. Sc. Lett., 450, 186–196, https://doi.org/10.1016/j.epsl.2016.06.008, 2016.
Bianchi, G. and McCave, I. N.: Holocene periodicity in north Atlantic climate and deep ocean flow south of Iceland, Nature, 397, 515–518, https://doi.org/10.1038/17362, 1999.
Bond, G., Kromer, B., Beer, J., Muscheler, R., Evans, M. N., Showers, W., Hoffmann, S., Lotti-bond, R., Hajdas, I., and Bonani, G.: Persistent solar influence on North Atlantic climate during the Holocene, Science, 294, 2130–2136, https://doi.org/10.1126/science.1065680, 2001.
Booth, R. K., Jackson, S. T., Forman, S. L., Kutzbach, J. E., Bettis III, E. A., Kreig, J., and Wright, D. K.: A severe centennial-scale drought in mid-continental North America 4200 years ago and apparent global linkage. Holocene, 15, 321–328, https://doi.org/10.1191/0959683605hl825ft, 2005.
Bradley, R. S. and Bakke, J.: Is there evidence for a 4.2 ka BP event in the northern North Atlantic region?, Clim. Past Discuss., in preparation, 2019.
Burns, S. J.: Speleothem records of changes in tropical hydrology over the Holocene and possible implications for atmospheric methane, Holocene, 21, 735–741, https://doi.org/10.1177/0959683611400194, 2011.
Clarke, G. K. C., Leverington, D. W., Teller, J. T., and Dyke, A. S.: Paleohydraulics of the last outburst flood from glacial Lake Agassiz and the 8200 BP cold event, Quaternary Sci. Rev., 23, 389–407, https://doi.org/10.1016/j.quascirev.2003.06.004, 2004.
Cook, E. R., Anchukaitis, K. J., Buckley, B. M., D'Arrigo, R. D., Jacoby, G. C., and Wright, W. E.: Asian monsoon failure and megadrought during the last millennium, Science, 328, 486–489, https://doi.org/10.1126/science.1185188, 2010.
Deininger, M., McDermott, F., Mudelsee, M., Werner, M., Frank, N., and Mangini, A.: Coherency of late Holocene European speleothem δ18O records linked to North Atlantic Ocean circulation, Clim. Dynam., 49, 595–618, https://doi.org/10.1007/s00382-016-3360-8, 2017.
Delworth, T. L. and Mann, M. E.: Observed and simulated multidecadal variability in the Northern Hemisphere, Clim. Dynam., 16, 661–676, https://doi.org/10.1007/s003820000075, 2000.
Finkenbinder, M. S., Abbott, M. B., and Steinman, B. A.: Holocene climate change in Newfoundland reconstructed using oxygen isotope analysis of lake sediment cores, Global Planet. Change, 143, 251–261, https://doi.org/10.1016/j.gloplacha.2016.06.014, 2016.
Gupta, M. and Marshall, J.: The climate response to multiple volcanic eruptions mediated by ocean heat uptake: damping processes and accumulation potential, J. Climate, 31, 8669–8687, https://doi.org/10.1175/JCLI-D-17-0703.1, 2018.
He, F.: Simulation transient climate evolution of the last deglaciation with CCSM3, PhD dissertation, University of Wisconsin-Madison, 185 pp., 2011.
He, F., Shakun, J. D., Clark, P. U., Carlson, A. E., Liu, Z., Otto-Bliesner, B. L., and Kutzbach, J. E.: Northern Hemisphere forcing of Southern Hemisphere climate during the last deglaciation, Nature, 494, 81–85, https://doi.org/10.1038/nature11822, 2013.
Hong, Y. T., Hong, B., Lin, Q. H., Shibata, Y., Hirota, M., Zhu, Y. X., Leng, X. T., Wang, Y., Wang, H., and Yi, L.: Inverse phase oscillations between the East Asian and Indian Ocean summer monsoons during the last 12 000 years and paleo-El Niño, Earth Planet. Sc. Lett., 231, 337–346, 2005.
Joos, F. and Spahni, R.: Rates of change in natural and anthropogenic radiative forcing over the past 20,000 years, P. Natl. Acad. Sci., 105, 1425–1430, https://doi.org/10.1073/pnas.0707386105, 2008.
Kathayat, G., Cheng, H., Sinha, A., Yi, L., Li, X., Zhang, H., Li, H., Ning, Y., and Edwards, R. L.: The Indian monsoon variability and civilization changes in the Indian subcontinent, Science Advances, 3, e1701296, https://doi.org/10.1126/sciadv.1701296, 2017.
Knudsen, M. F., Seidenkrantz, M. S., Jacobsen, B. H., and Kuijpers, A.: Tracking the Atlantic Multidecadal Oscillation through the last 8,000 years, Nat. Commun., 2, 178–185, https://doi.org/10.1038/ncomms1186, 2011.
Lachniet, M. S., Asmerom, Y., Bernal, J. P., Polyak, V. J., and Vazquez-Selem, L.: Orbital pacing and ocean circulation-induced collapses of the Mesoamerican monsoon over the past 22,000 y, P. Natl. Acad. Sci. USA, 110, 9255–9260, https://doi.org/10.1073/pnas.1222804110, 2013.
LeGrande, A. N., Schmidt, G. A., Shindell, D. T., Field, C. V., Miller, R. L., Koch, D. M., Faluvegi, G., and Hoffmann, G.: Consistent simulations of multiple proxy responses to an abrupt climate change event, P. Natl. Acad. Sci. USA, 103, 837–842, 2006.
Liu, Z., Otto-Bliesner, B. L., He, F., Brady, E. C., Tomas, R., Clark, P. U., Carlson, A. E., Lynch-Stieglitz, J., Curry, W., Brook, E., and Erickson, D.: Transient simulation of last deglaciation with a new mechanism for Bølling-Allerød warming, Science, 325, 310–314, https://doi.org/10.1126/science.1171041, 2009.
Liu, Z., Zhu, J., Rosenthal, Y., Zhang, X., Otto-Bliesner, B. L., Timmermann, A., Smith, R. S., Lohmann, G., Zheng, W., and Timm, O. E.: The Holocene temperature conundrum, P. Natl. Acad. Sci. USA, 111, E3501–E3505, https://doi.org/10.1073/pnas.1407229111, 2014a.
Liu, Z., Yoshimura, K., Bowen, G. J., Buenning, N. H., Risi, C., Welker, J. M., and Yuan, F.: Paired oxygen isotope records reveal modern North American atmospheric dynamics during the Holocene, Nat. Commun., 5, 3701, https://doi.org/10.1038/ncomms4701, 2014b.
Marcott, S. A., Shakun, J. D., Clark, P. U., and Mix, A. C.: A reconstruction of regional and global temperature for the past 11,300 years, Science, 339, 1198–1201, https://doi.org/10.1126/science.1228026, 2013.
Marsicek, J., Shuman, B. N., Bartlein, P. J., Shafer, S. L., and Brewer, S.: Reconciling divergent trends and millennial variations in Holocene temperatures, Nature, 554, 92–96, https://doi.org/10.1038/nature25464, 2018.
McManus, J. F., Francois, R., Gherardi, J.-M., Keigwin, L. D., and Brown-Leger, S.: Collapse and rapid resumption of Atlantic meridional circulation linked to deglacial climate changes, Nature, 428, 834–837, https://doi.org/10.1038/nature02494, 2004.
Moreno-Chamarro, E., Zanchettin, D., Lohmann, K., and Jungclaus, J. H.: An abrupt weakening of the subpolar gyre as trigger of Little Ice Age-type episodes, Clim. Dynam., 48, 727–744, https://doi.org/10.1007/s00382-016-3106-7, 2017.
Ottera, O. H., Bentsen, M., Drange, H., and Suo, L.: External forcing as a metronome for Atlantic multidecadal variability, Nat. Geosci., 3, 688–694, https://doi.org/10.1038/ngeo955, 2010.
Otto-Bliesner, B. L., Brady, E. C., Clauzet, G., Tomas, R., Levis, S., and Kothavala, Z.: Last Glacial Maximum and Holocene climate in CCSM3, J. Climate, 19, 2526–2544, https://doi.org/10.1175/JCLI3748.1, 2006.
Peltier, W. R.: Global glacial isostasy and the surface of the ice-age Earth-The ICE-5G (VM2) model and GRACE, Annu. Rev. Earth Planet. Sc., 32, 111–149, https://doi.org/10.1146/annurev.earth.32.082503.144359, 2004.
Porter, S. C.: Onset of neoglaciation in the Southern Hemisphere, J. Quaternary Sci., 15, 395–408, https://doi.org/10.1002/1099-1417(200005)15:4<395::AID-JQS535>3.0.CO;2-H, 2000.
Risebrobakken, B., Jansen, E., Andersson, C., Mjelde, E., and Hevrøy, K.: A high resolution study of Holocene paleoclimatic and paleoceanographic changes in the Nordic Seas, Paleoceanography, 18, 1–14, https://doi.org/10.1029/2002PA000764, 2003.
Solomina, O. N., Bradley, R. S., Hodgson, D. A., Ivy-Ochs, S., Jomelli, V., Mackintosh, A. N., Nesje, A., Owen, L. A., Wanner, H., Wiles, G. C., and Young, N. E.: Holocene glacier fluctuations, Quaternary Sci. Rev., 111, 9–34, https://doi.org/10.1016/j.quascirev.2014.11.018, 2015.
Staubwasser, M. and Weiss, H.: Holocene climate and cultural evolution in late prehistoric-early historic West Asia, Quaternary Res., 66, 372–387, https://doi.org/10.1016/j.yqres.2006.09.001, 2006.
Tan, L., Cai, Y., Cheng, H., Edwards, L. R., Gao, Y., Xu, H., Zhang, H., and An, Z.: Centennial- to decadal- scale monsoon precipitation variations in the upper Hanjiang River region, China over the past 6650 years, Earth Planet. Sc. Lett., 482, 580–590, https://doi.org/10.1016/j.epsl.2017.11.044, 2018a.
Tan, L., Cai, Y., Cheng, H., Edwards, L. R., Lan, J, Zhang, H., Li, D, Ma, L. Zhao, P., and Gao, Y.: High resolution monsoon precipitation changes on southeastern Tibetan Plateau over the past 2300 years, Quaternary Sci. Rev., 195, 122–132, https://doi.org/10.1016/j.quascirev.2018.07.021, 2018b.
Walker, M. J., Berkelhammer, M., Björck, S., Cwynar, L. C., Fisher, D. A., Long, A. J., Lowe, J. J., Newnham, R. M., Rasmussen, S. O., and Weiss, H.: Formal subdivision of the Holocene Series/Epoch: a Discussion Paper by a Working Group of INTIMATE (Integration of ice-core, marine and terrestrial records) and the Subcommission on Quaternary Stratigraphy (International Commission on Stratigraphy), J. Quaternary Sci., 27, 649–659, https://doi.org/10.1002/jqs.2565, 2012.
Walker, M. J., Berkelhammer, M., Björck, S., Cwynar, L. C., Fisher, D. A., Long, A. J., Lowe, J. J., Newnham, R. M., Rasmussen, S. O., and Weiss, H.: Formal ratification of the subdivision of the Holocene Series/Epoch (Quaternary System/Period): two new Global Boundary Stratotype Sections and Points (GSSPs) and three new stages/subseries, Episodes, 41, p. 213, 2018.
Wang, S.: Holocene climate, Advances in Climate Change Research, 5, 247–248, 2009a (in Chinese with English abstract).
Wang, S.: Holocene cold events in the north Atlantic chronology and climatic impact, Quaternary Sci., 29, 1146–1153, 2009b (in Chinese with English abstract).
Wang, Y., Cheng, H., Edwards, L. R., He, Y., Kong, X., An, Z., Wu, J., Kelly, M. J., Dykoski, C. A., and Li, X.: The Holocene Asian monsoon: links to solar changes and north Atlantic climate, Science, 308, 854–857, https://doi.org/10.1126/science.1106296, 2005.
Wanner, H., Solomina, O., Grosjean, M., Ritz, S. P., and Jetel, M.: Structure and origin of Holocene cold events, Quaternary Sci. Rev., 30, 3109–3123, 2011.
Weiss, H.: Megadrought, collapse, and resilience in late 3rd millennium BC Mesopotamia, in: 2200 BC – A climatic breakdown as a cause for collapse of the Old World?, edited by: Meller, H., Arz, H. W., Jung, R., and Risch, R., Halle: Landesmuseum fur Vorgeschichte, 35–52, 2015.
Weiss, H.: Global megadrought, societal collapse and resilience at 4.2–3.9 ka BP across the Mediterranean and west Asia, PAGES Magazine, 24, 62–63, 2016.
Weiss, H.: 4.2 ka BP megadrought and the Akkadian collapse, in: Megadrought and Collapse, edited by: Weiss, H., Oxford University Press, 93–159, https://doi.org/10.1093/oso/9780199329199.003.0004, 2017.
Wen, X., Liu, Z., Wang, S., Cheng, J., and Zhu, J.: Correlation and anti-correlation of the East Asian summer and winter monsoons during the last 21,000 years, Nat. Commun., 7, 11999, https://doi.org/10.1038/ncomms11999, 2016.
Yan, M., Liu, J., and Ning, L.: Physical processes of cooling and megadrought in 4.2 ka BP event: results from TraCE-21ka simulations, Clim. Past Discuss., https://doi.org/10.5194/cp-2018-131, in review, 2018.