the Creative Commons Attribution 4.0 License.
the Creative Commons Attribution 4.0 License.
 | 15 Jan 2019
Indian winter and summer monsoon strength over the 4.2 ka BP event in foraminifer isotope records from the Indus River delta in the Arabian Sea
Michael Staubwasser
Cameron A. Petrie
David A. Hodell
The plains of northwest South Asia receive rainfall during both the Indian summer (June–September) and winter (December–March) monsoon. Researchers have long attempted to deconstruct the influence of these precipitation regimes in paleoclimate records, in order to better understand regional climatic drivers and their potential impact on human populations. The mid–late Holocene transition between 5.3 and 3.3 ka is of particular interest in this region because it spans the period of the Indus Civilization from its early development, through its urbanization, and onto eventual transformation into a rural society. An oxygen isotope record of the surface-dwelling planktonic foraminifer Globigerinoides ruber from the northeast Arabian Sea provided evidence for an abrupt decrease in rainfall and reduction in Indus River discharge at 4.2 ka, which the authors linked to the decline in the urban phase of the Indus Civilization (Staubwasser et al., 2003). Given the importance of this study, we used the same core (63KA) to measure the oxygen isotope profiles of two other foraminifer species at decadal resolution over the interval from 5.4 to 3.0 ka and to replicate a larger size fraction of G. ruber than measured previously. By selecting both thermocline-dwelling (Neogloboquadrina dutertrei) and shallow-dwelling (Globigerinoides sacculifer) species, we provide enhanced detail of the climatic changes that occurred over this crucial time interval. We found evidence for a period of increased surface water mixing, which we suggest was related to a strengthened winter monsoon with a peak intensity over 200 years from 4.5 to 4.3 ka. The time of greatest change occurred at 4.1 ka when both the summer and winter monsoon weakened, resulting in a reduction in rainfall in the Indus region. The earliest phase of the urban Mature Harappan period coincided with the period of inferred stronger winter monsoon between 4.5 and 4.3 ka, whereas the end of the urbanized phase occurred some time after the decrease in both the summer and winter monsoon strength by 4.1 ka. Our findings provide evidence that the initial growth of large Indus urban centers coincided with increased winter rainfall, whereas the contraction of urbanism and change in subsistence strategies followed a reduction in rainfall of both seasons.
- Article
(9869 KB) -
Supplement
(1348 KB) - BibTeX
- EndNote


The ∼4.2 ka BP event is considered to be a defining event of the mid–late Holocene transition period (Mayewski et al., 2004) and is marked by intense aridity in much of western Asia, which has been linked to cultural transitions in Mesopotamia, Egypt, and the Indus Civilization (Staubwasser and Weiss, 2006; Weiss, 2016). Recently, a climate reconstruction from Mawmluh cave in northeastern India has been used to formally demarcate the post-4.2 ka time as the Meghalayan Age (Walker et al., 2012, 2018). However, defining the exact timing and extent of aridity at ∼4.2 ka remains an open question (Finné et al., 2011; Wanner et al., 2008). In this special issue devoted to the “4.2 ka BP event”, we provide new paleoclimate data from a marine core in the northern Arabian Sea over this critical time interval to better understand the changes that occurred in both winter and summer hydroclimate over the Indian subcontinent.
The δ18O record of Globigerinoides ruber from marine core 63KA, obtained from the Arabian Sea off the coast of Pakistan and produced by Staubwasser et al. (2003), was among the first well-resolved paleoclimate records to suggest a link between a decrease in Indus River discharge around 4.2 ka and the decline in the urban phase of the Indus Civilization. Since the publication of this record, several other terrestrial paleoclimate reconstructions from the region (Berkelhammer et al., 2012; Dixit et al., 2014, 2018; Giosan et al., 2012; Kathayat et al., 2017; Menzel et al., 2014; Nakamura et al., 2016; Prasad and Enzel, 2006) and a number of marine reconstructions (Giosan et al., 2018; Gupta et al., 2003; Ponton et al., 2012) have added to our understanding of the complex relationship between the Indus Civilization and climate change. New questions have also emerged about the relative importance of winter rain from the Indian winter monsoon (IWM) system and summer rain from the Indian summer monsoon (ISM) during the critical time period from 5.4 to 3.0 ka, which spans the pre-urban, urban, and post-urban phases of the Indus Civilization (Giosan et al., 2018; Petrie et al., 2017; Prasad and Enzel, 2006). This is because the winter rain zone partially overlaps with the summer rain zone (Fig. 1) and provides a critical supply of rain and snowfall for the Indus River basin. However, we currently understand much less about the behavior of the IWM than the ISM.
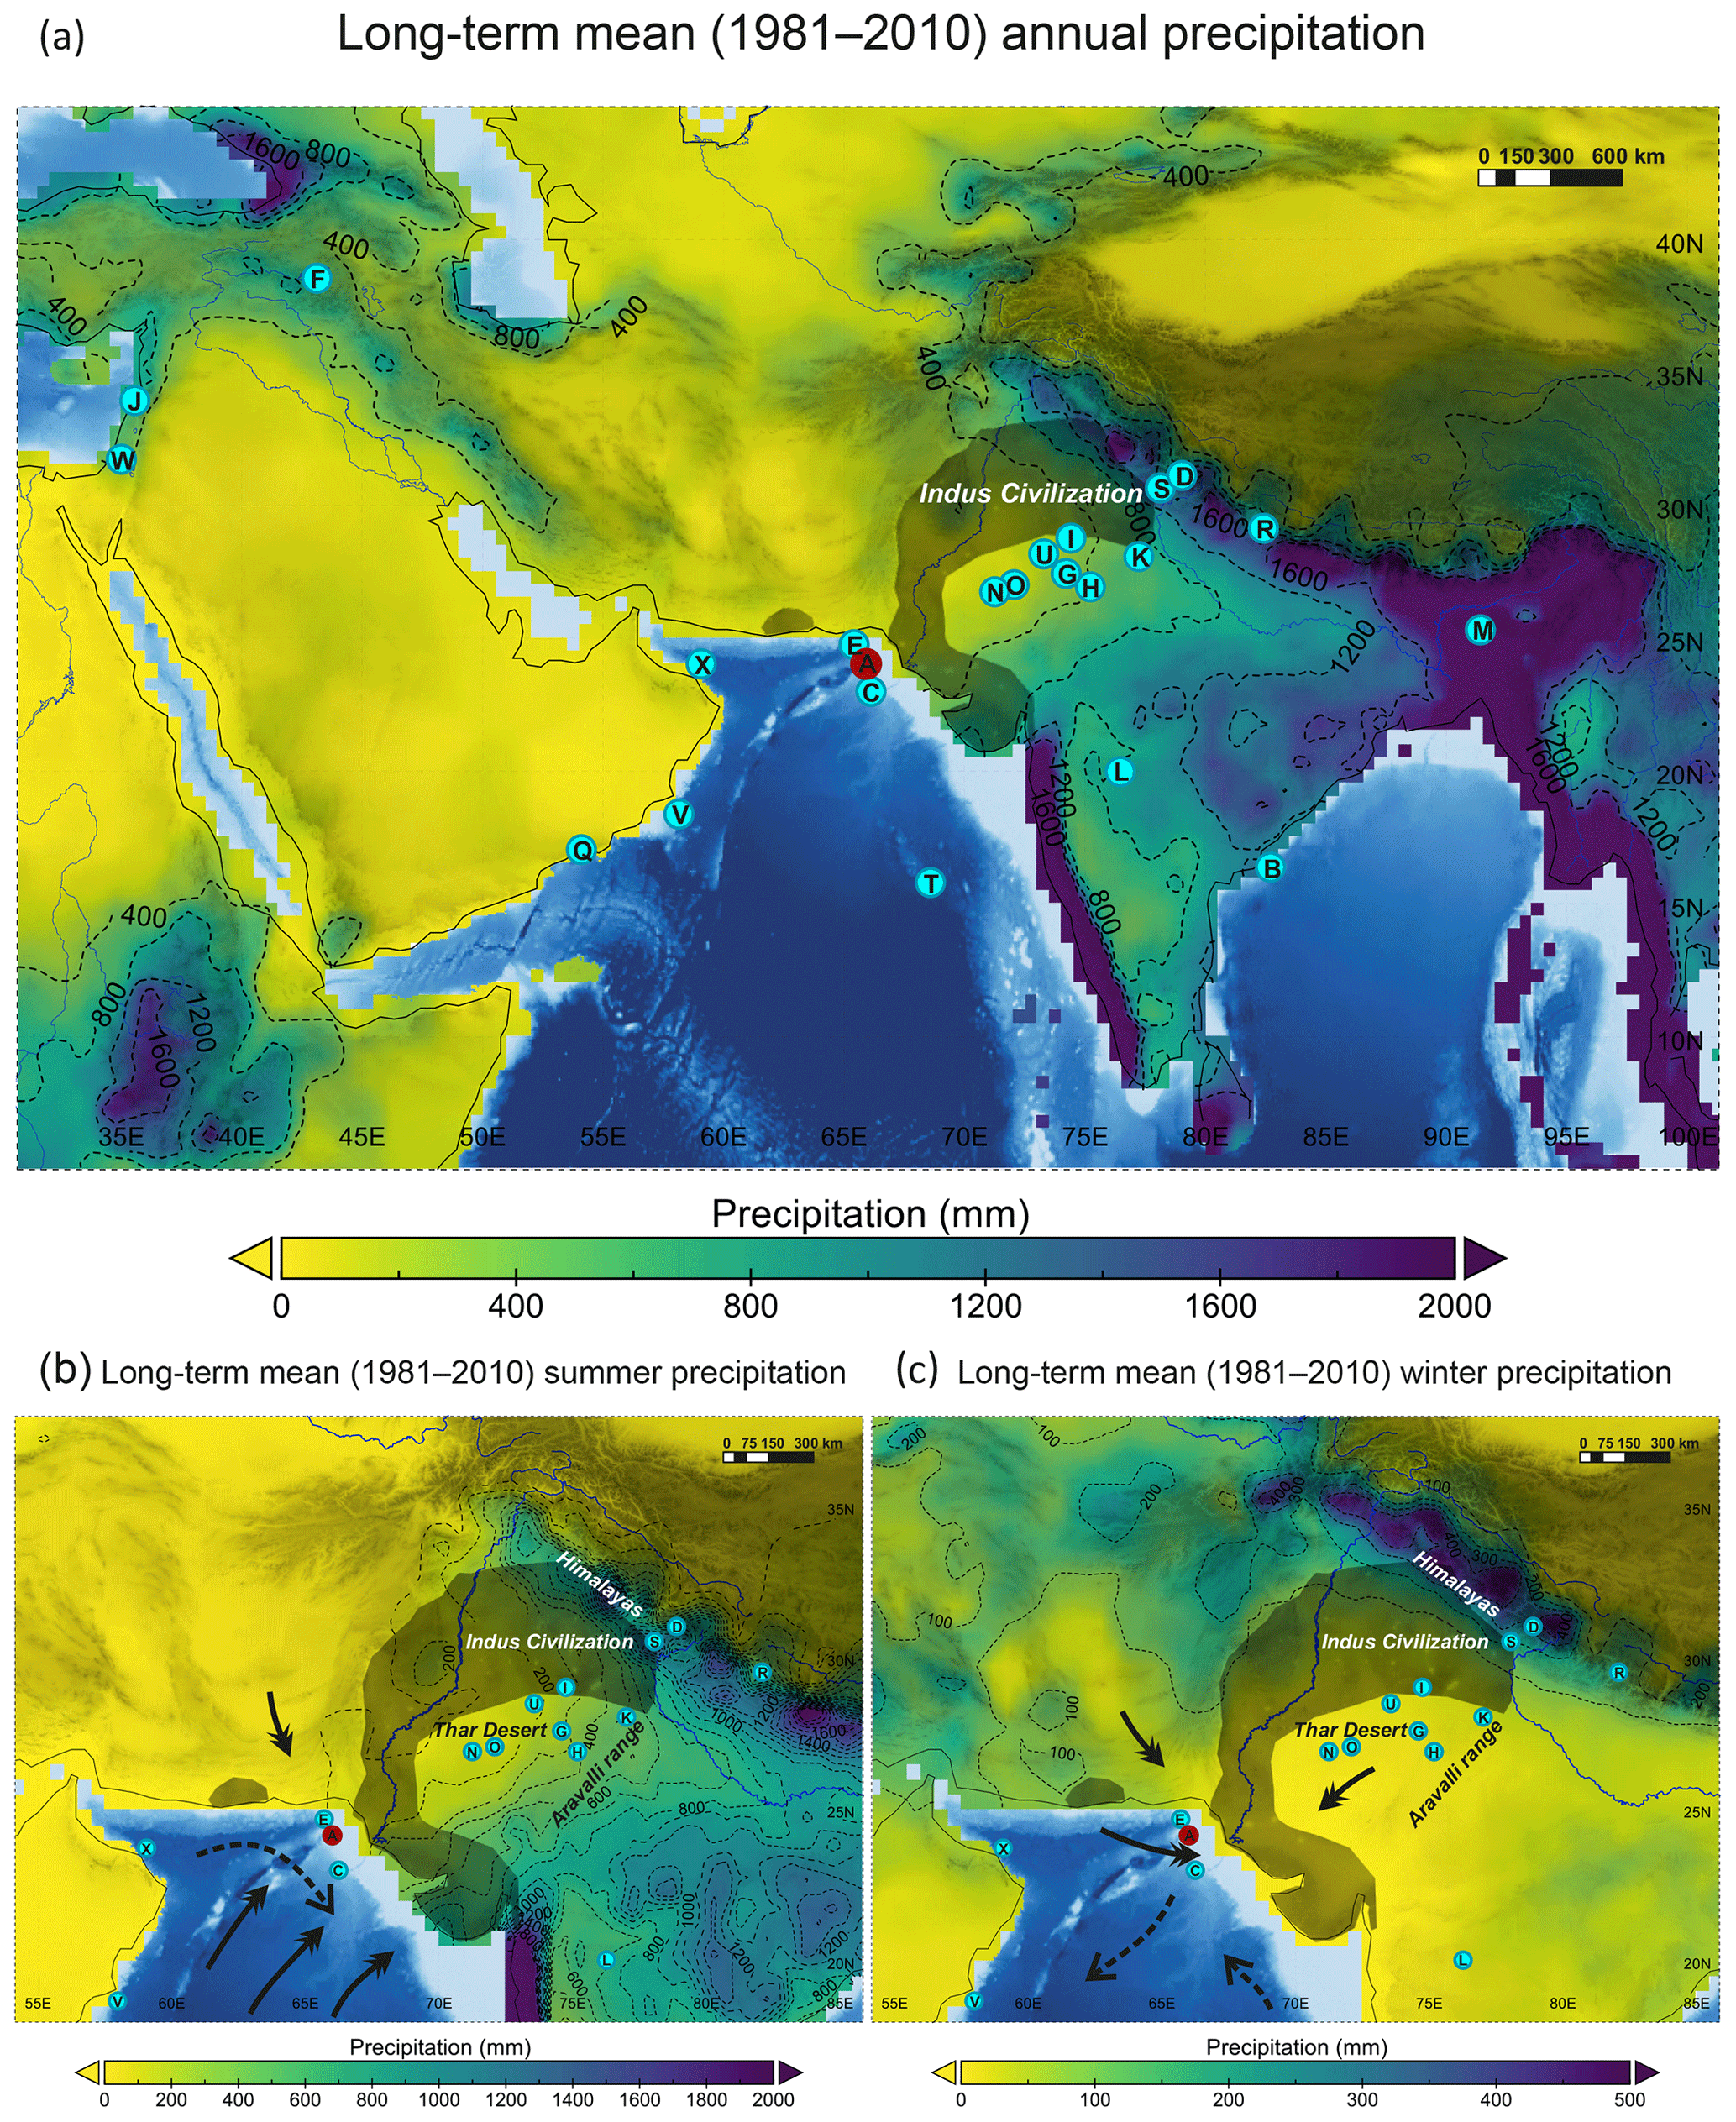
Figure 1(a) Annual, (b) ISM (JJAS), and (c) IWM (DJFM) mean precipitation (1981–2010) isohyets taken from the GPCC V7 global gridded dataset ( resolution) (Schneider et al., 2015); note the difference in scale for summer and winter precipitation (0–2000 mm vs. 0–500 mm). Rainfall data overlain on GEBCO 2014 ocean bathymetry dataset (Weatherall et al., 2015), and shaded region shows extent of the Indus Civilization. Bold arrows show main wind directions, dashed arrows show ocean surface currents. Other studies discussed in this paper are indicated by letters: A – core 63KA (this study; Staubwasser et al., 2003); B – core 16A (Ponton et al., 2012); C – core Indus 11C (Giosan et al., 2018); D – Din Gad peat record (Phadtare, 2000); E – core 39KG and 56KA (Doose-Rolinkski et al., 2001); F – Lake Van record (Wick et al., 2003; Lemcke and Sturm, 1997); G – Didwana playa lake (Singh et al., 1990); H – Sambhar playa lake (Sinha et al., 2006); I – Karsandi playa lake (Dixit et al., 2018); J – Jeita cave speleothem (Cheng et al., 2015); K – Kotla Dahar lake (Dixit et al., 2014); L – Lonar lake (Menzel et al., 2014); M – Mawmluh cave speleothem (Berkelhammer et al., 2012); N – Kanod playa lake (Deotare et al., 2004); O – Bap Malar playa lake (Deotare et al., 2004); Q – Qunf cave speleothem (Fleitmann et al., 2003); R – Rara lake (Nakamura et al., 2016); S – Sahiya cave speleothem (Kathayat et al., 2017); T – Foraminifer trap EAST (Curry et al., 1992); U – Lunkaransar playa lake (Enzel et al., 1999); V – core 723A, RC27-14, RC27-23, RC27-28 (Gupta et al., 2003; Overpeck et al., 1996); W – Soreq cave speleothem (Bar-Matthews et al., 2003; Bar-Matthews and Ayalon, 2011); X – core M5-422 (Cullen et al., 2000).
At its height, the Indus Civilization spanned a considerable geographical area with a greater extent than the other ancient civilizations of its time (Agrawal, 2007; Possehl, 2003). Today, the region that was once occupied by Indus populations is marked by a heterogeneous rainfall pattern, and some locations in the central Thar desert receive as little as 100 mm yr−1, which is only about 10 % of the amount of direct annual rainfall compared to New Delhi. Scarce direct precipitation in the central regions around the Thar Desert is supplemented in some cases by fluvial or groundwater sources. In addition, the distribution of winter rain (increasing towards the northwest) is distinct from summer rain (increasing towards the east), making regions variably suitable for growing certain crops and grazing (Petrie et al., 2017; Petrie and Bates, 2017). While many paleoclimate studies from South Asia (references A–C, I, K–M, S, and U in Fig. 1) have theorized about the overall climatic impact of drought (and in most cases identified summer monsoon as the cause), it is important to identify changes in the relative contributions and timing of seasonal rainfall from both the winter and summer monsoons. Previously, it has not been possible to reliably differentiate winter from summer rain in reconstructions from the Indus region.
In this study, we reexamined the same marine core (63KA) used in the original research of Staubwasser et al. (2003). We first assessed the reproducibility of the Globigerinoides ruber δ18O record using a larger size fraction of the same species for the time period 5.4–3.0 ka. We also measured the δ18O of two additional foraminifer species, G. sacculifer (Globigerinoides sacculifer) and N. dutertrei (Neogloboquadrina dutertrei), which live deeper than G. ruber in the water column. The different ecologies of the three species provide additional information with which to evaluate the multiple δ18O records and assess seasonal changes in the paleoceanography of the northeastern Arabian Sea near the mouth of the Indus River.
The δ18O of foraminifera has been widely applied as an indicator of temperature and salinity changes (among others, Duplessy et al., 1992; Maslin et al., 1995; Wang et al., 1995; Rohling, 2000). Measuring the δ18O of species calcifying at different depths can provide further information about upper-ocean seasonal hydrography such as surface water mixing, depth of the thermocline, and upwelling (Ravelo and Shackleton, 1995). Similar methods have been applied by several other studies (Billups et al., 1999; Cannariato and Ravelo, 1997; Norris, 1998; Steinke et al., 2010; Steph et al., 2009; among others), including a reconstruction of East Asian winter monsoon strength in the South China Sea (Tian et al., 2005). Here we apply a comparable method to samples from core 63KA in the northeastern Arabian Sea because surface waters at this location are influenced by freshwater discharge from the Indus River and direct precipitation during the summer monsoon months, whereas enhanced upper-ocean mixing occurs during the winter monsoon. We hypothesized that our new measurements of δ18O of G. sacculifer and N. dutertrei would allow us to track changes in upper-ocean mixing. Weaker IWM winds are expected to result in a shorter duration and/or less intense upper-ocean mixing, although how this signal is ultimately related to the amount or distribution of winter rainfall in the Indus River catchment has not been demonstrated conclusively. Dimri (2006) studied Western Disturbances for the time period 1958–1997 and noted that years of surplus winter precipitation are linked to significant heat loss over the northern Arabian Sea, which is mainly attributed to intensified westerly moisture flow and enhanced evaporation. Such conditions would promote deeper winter mixing and provide a basis for relating thermocline depth with IWM intensity. By comparing the δ18O of multiple species of foraminifera, we seek to infer variations in the relative strengths of the summer and winter monsoons, and by comparing the 63KA record to other nearby marine and terrestrial records, we evaluate the potential role that climate played in the cultural transformation of the Indus Civilization.
2.1 Monsoon – land-based processes
Today, most of the annual precipitation over northwest South Asia stems from the ISM, and occurs mainly between June and September. The pressure gradient between the low-pressure Tibetan Plateau and high-pressure Indian Ocean is accompanied by the ITCZ (Intertropical Convergence Zone) reaching its northward maximum in summer, which draws in moisture over the subcontinent via southwesterly winds from the Indian Ocean (Gadgil, 2003). The summer rainfall gradient increases from the central Thar Desert (as little as 100 mm direct summer rainfall per year) to the Himalaya mountains in the north (>1000 mm) and the Aravalli range to the west (>500 mm) (Fig. 1b).
The IWM rain falls between December through March and is mainly the result of atmospheric Western Disturbances (Dimri and Dash, 2012; Yadav et al., 2012) originating over the Mediterranean and Black Sea (Hatwar et al., 2005) that allow for moisture incursion from the Arabian Sea (Rangachary and Bandyopadhyay, 1987). During the IWM, the pressure gradient is reversed from the summer condition, allowing the passage of Western Disturbances when the ITCZ moves southward. As winter transitions to spring, predominantly northeasterly winds shift to westerly winds (Sirocko, 1991) that result in peak winter rainfall over the plains of northwest India in February and March. Anomalously cool, evaporative conditions over the northern Arabian Sea (promoting deeper winter mixing) also correlate with increased winter precipitation in the western Himalayas (Dimri, 2006). The winter rainfall gradient increases from the southern Thar Desert (<10 mm yr−1) up to the Himalayas in the northwest (>400 mm) (Fig. 1c). Overall, the IWM contributes between roughly 10 % and 50 % of the total annual rainfall of northwest South Asia today.
The Indus and the other rivers that make up Punjab are partly fed by winter snowmelt and ice melt from their upper mountain catchment areas. Melting peaks during the summer months around July–August (Yu et al., 2013), which coincides with the peak of ISM rainfall, and Indus River discharge reaches its maximum during August (Karim and Veizer, 2002). The proportion of winter to summer precipitation contributing to the Indus River is not entirely clear, although one study has estimated a 64 %–72 % contribution of winter precipitation from the deuterium excess of Indus River water (Karim and Veizer, 2002), whereas a previous study estimated a lower 15 %–44 % contribution of snowmelt to Indus tributaries (Ramasastri, 1999). Since the 1960s, the Indus River has seen more than a 50 % reduction in discharge because of the construction of barrages as well as the diversion of water for agricultural uses (Ahmad et al., 2001).
2.2 Hydrography – core site and ocean-based processes
Core 63KA was obtained by the PAKOMIN cruise in 1993 (von Rad et al., 1995). The laminated core from the northeastern Arabian Sea (24∘37′ N, 65∘59′ E) was taken at 316 m water depth on the continental shelf, ∼100 km west of the Indus River delta. The core has high sedimentation rates (equivalent to a temporal resolution of around 18 yr cm−1 in the period of interest, 5.4–3.0 ka), and all foraminifer proxies were produced from the same laminated core with no bioturbation. An important aspect of core 63KA is that different components of the monsoon system are co-registered in the same sediment core, thereby permitting an explicit evaluation of the relative timing of different parts of the climate system (e.g., ISM and IWM).
Modern hydrographic conditions in the northeastern Arabian Sea are highly influenced by the seasonal monsoon. During summertime, highest sea surface temperatures (SSTs) are observed along with a shallow mixed layer depth <25 m (Schulz et al., 2002) (Fig. 2a). A low-salinity plume surrounds the Indus River delta and shoreline extending as far as the coring location (Fig. S1 in the Supplement). The reverse occurs in winter when the lowest SSTs are accompanied by surface water mixing to >125 m, resulting in warming of the deeper waters (Schulz et al., 2002). Northeasterly winds promote convection in the northeastern Arabian Sea by cooling and evaporation of surface water (Banse, 1984; Madhupratap et al., 1996), and during the transition from winter to spring, wind directions shift from northeasterly to westerly (Sirocko, 1991).

Figure 2(a) Seasonal surface water mixing depth based on station EPT-2 located nearby the coring site of 63KA (adapted from Schulz et al., 2002, who also used data from Hastenrath and Lamb, 1979). (b) Foraminifer depth ranges based on CTD profile. (c) Foraminifer abundances from EAST traps (overlapping peaks indicate data from multiple traps): G. ruber (orange), G. sacculifer (green), and N. dutertrei (blue) (adapted from Curry et al., 1992, using Zaric, 2005). (d) World Ocean Atlas (WOA) mean (1955–2012) temperature (red) and salinity (yellow) profiles at 24.875∘ N, 65.875∘ E, shown for summer (JAS) and winter (JFM) seasons (Locarnini et al., 2013; Zweng et al., 2013).
The northern Arabian Sea is dominated by highly saline (up to 37 psu) surface waters known as Arabian Sea High-Salinity Water (ASHSW), which extend from the surface down to 100 m depth (Joseph and Freeland, 2005). The high salinity is explained by the high evaporative rates over this region. ASHSW forms in the winter but is prevented from reaching our coring site on the shelf by northerly subsurface currents until the summer (Kumar and Prasad, 1999). Along coastal areas, the ASHSW is starkly contrasted by the fresh water discharge of the Indus River, combined with direct precipitation. In contrast, surface waters in the Bay of Bengal on the eastern side of India have much lower surface water salinity because of overall higher precipitation and stronger stratification from weaker winds (Shenoi et al., 2002). The heightened evaporative conditions and highly saline surface waters of the northeastern Arabian Sea make it a sensitive study location to observe changes in discharge of the entire Indus River catchment area – ultimately tracking changes in monsoon strength. Unlike individual terrestrial records, which may be affected by local climatic processes, the marine record from core 63KA is more likely to integrate regional changes in the large-scale ocean–atmosphere system.
Planktonic foraminifera complete their life cycle within a few weeks (Bé and Hutson, 1977). Peak abundances indicate the time of year when each species tends to calcify, thereby recording the δ18O and temperature of the seawater in their CaCO3 shells primarily during certain seasons. Foraminifer abundances in the eastern Arabian Sea have been studied by Curry et al. (1992) using sediment traps deployed at shallow (∼1400 m) and deep (∼2800 m) water depths (“T” in Fig. 1a). G. ruber and G. sacculifer have peak abundances during the summer months (June–September), whereas N. dutertrei lives mainly during the winter and has a secondary peak in summer months (Fig. 2c). Preferred depth ranges for each species reflect their ecological niches, including requirements for nutrients and tolerance for ranges of temperature and salinity (Bé and Hutson, 1977; Hemleben et al., 2012). G. ruber lives in the upper surface waters (0–10 m), G. sacculifer is found in slightly deeper surface waters (10–40 m), and N. dutertrei inhabits the base of the mixed layer near the thermocline (40–140 m) (estimates based on ranges from Farmer et al., 2007, and the local CTD – conductivity, temperature, and depth – profiles) (Fig. 2b).
3.1 Age model
The AMS (accelerator mass spectrometer) radiocarbon dates from Staubwasser et al. (2002, 2003) were obtained from 80 samples of mainly the foraminifer G. sacculifer and three samples of O. universa. In the interval of interest (5.4–3.0 ka), there are 15 radiocarbon dates with a 95 % confidence range of 30–130 years. The average sample resolution is 18 yr cm−1. Bayesian age modeling software, BACON v2.3.3 (Blaauw and Christen, 2011), was used as an R package to update the age model of core 63KA. No major difference exists between the old and new age models, except for the period 13–11 ka (Fig. S5, Table S2). IntCal13 was used for radiocarbon calibration (Reimer et al., 2013) with marine reservoir ages provided by Staubwasser et al. (2002, 2003).
3.2 Stable isotope analysis
Oxygen and carbon isotopes were measured on three species of foraminifera selected from washed samples at 1 cm intervals throughout 132 cm of the core covering 5.4–3.0 ka: G. ruber (white, sensu stricto), G. sacculifer, and N. dutertrei. For G. ruber, 12±8 foraminifera were picked from the 400–500 µm size fraction with an average weight of 21.4±2.5 µg. The 400–500 µm size fraction was picked because too few specimens remained in the size fraction 315–400 µm used by Staubwasser et al. (2003). For G. sacculifer, 34±7 foraminifera were picked from the 315–400 µm size fraction with an average weight of 21.9±2.6 µg. For N. dutertrei, 34±4 foraminifera were picked from the 315–400 µm size fraction with an average weight of 25.9±2.2 µg. At some depth levels in the core there were insufficient foraminifera for measurement, along with outlier measurements in two cases, leaving 14 gaps in the G. ruber 400–500 µm record, 4 gaps in the G. sacculifer record, and no gaps for N. dutertrei. The published G. ruber is from the 315–400 µm size fraction and contains 17 gaps in the depth range examined (Staubwasser et al., 2003).
All foraminifera were weighed, crushed, and dried at 50 ∘C. Samples were cleaned for 30 min with 3 % H2O2, followed by a few drops of acetone, ultrasonication, and drying overnight. Where sample weights exceeded 80 µg, oxygen and carbon isotopes were measured using a Micromass Multicarb Sample Preparation System attached to a VG SIRA mass spectrometer. In cases of smaller sample sizes, the Thermo Scientific Kiel device attached to a Thermo Scientific MAT253 mass spectrometer was used in dual-inlet mode. This method adds 100 % H3PO4 to the CaCO3, water is removed cryogenically, and the dry CO2 is analyzed isotopically by comparison with a laboratory reference gas. For both measurement methods, 10 reference carbonates and 2 control samples were included with every 30 samples. Results are reported relative to VPDB (Vienna Pee Dee Belemnite), and long-term reproducibility of laboratory standards (e.g., Carrara marble) is better than ±0.08 ‰ for δ18O and ±0.06 ‰ for δ13C. Reproducibility of foraminiferal measurements was estimated by five triplicate (three separately picked) measurements of G. ruber (400–500 µm) that yielded 1 standard deviation of ±0.12 ‰ (δ18O) and ±0.10 ‰ (δ13C). For G. sacculifer (315–400 µm) the standard deviation of eight triplicate measurements was ±0.07 ‰ (δ18O) and ±0.07 ‰ (δ13C), and for N. dutertrei (315–400 µm) the standard deviation of nine triplicate measurements was ±0.06 ‰ (δ18O) and ±0.07 ‰ (δ13C).
To calculate equilibrium values of , we used the CTD profile from station 11 (24.62∘ N, 66.07∘ E) taken in September 1993 during PAKOMIN Sonne cruise no. 90 (von Rad, 2013), which is nearly identical to the location of core 63KA (24.62∘ N 65.98∘ E). The was calculated from salinity following Dahl and Oppo (2006), and was further calculated using the calcite–water equation of Kim and O'Neil (1997). We also used the equation of Shackleton (1974) as a comparative method for calculating .
3.3 Statistical treatment
Statistical tests were applied to the raw data from the δ18O and δ13C time series, including the package SiZer (Chaudhuri and Marron, 1999; Sonderegger et al., 2009) in R software (2016), which calculates whether the derivative of a time series exhibits significant changes given a range of time spans. A Pearson's correlation test (confidence level 95 %) was done on paired samples from both size fractions of G. ruber. We also conducted Welch's t test to determine if the mean population of δ18O is significantly different before and after 4.1 ka.
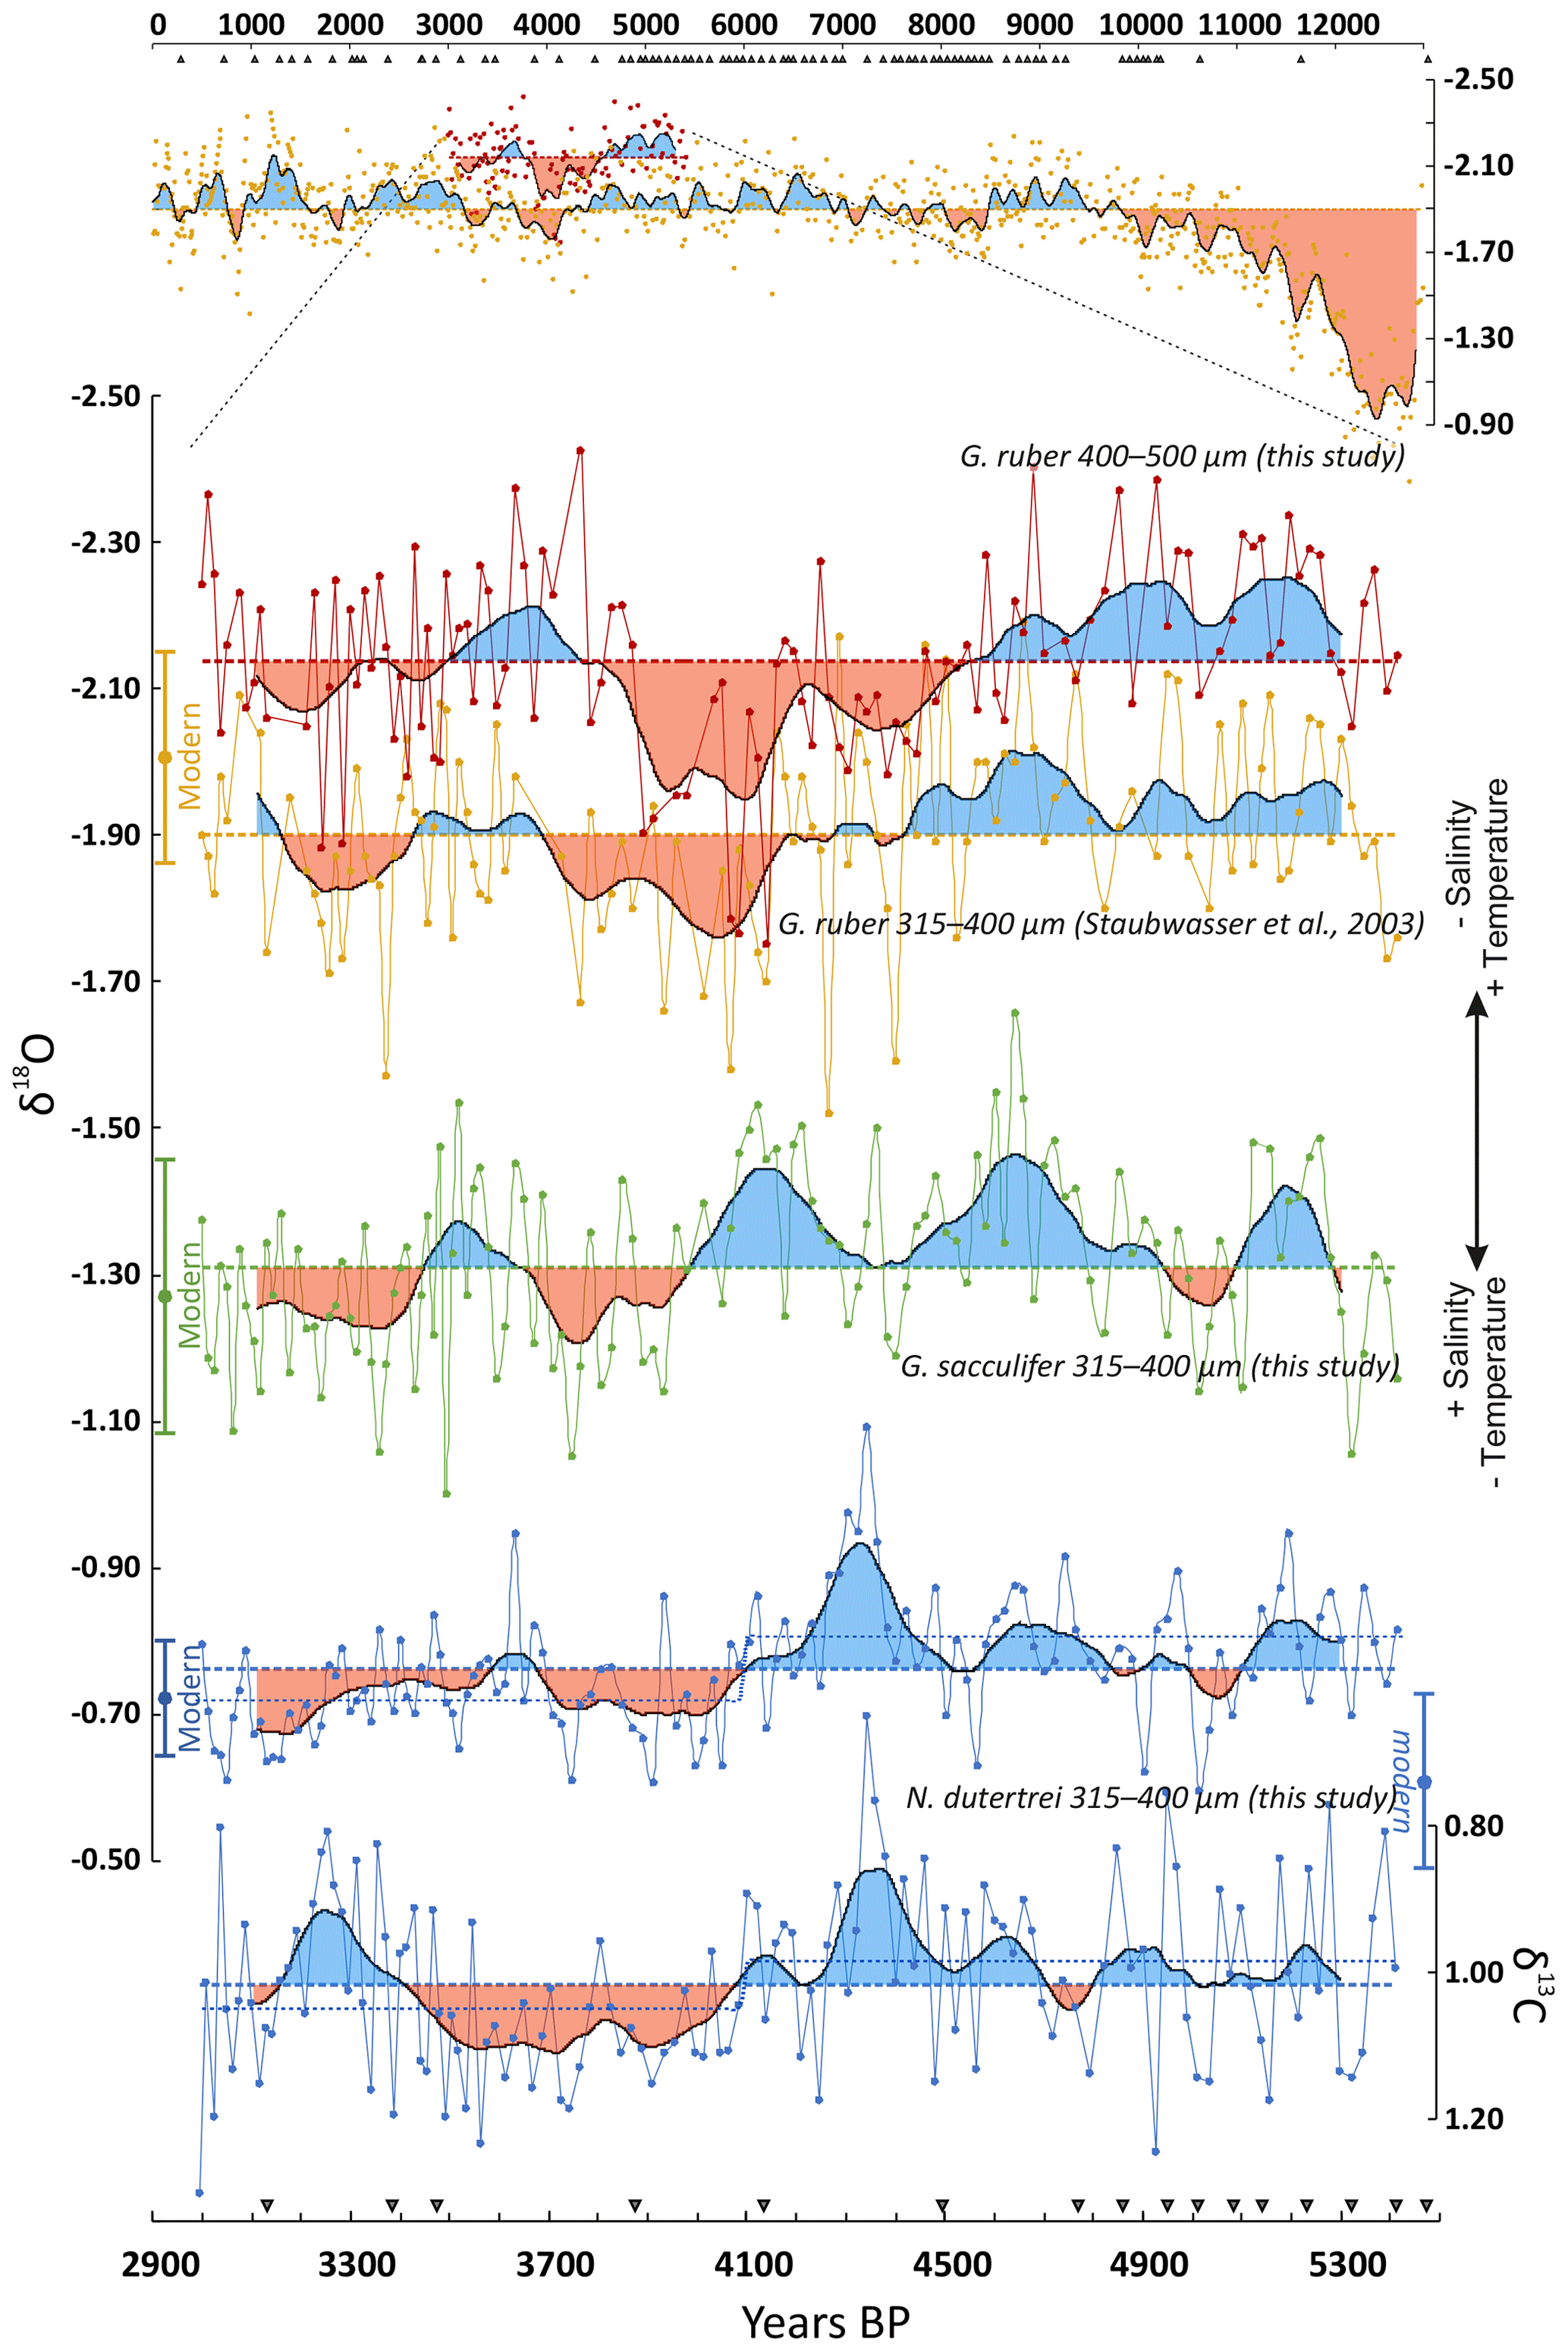
Figure 3Core 63KA δ18O G. ruber from two size fractions shown in the context of the original record and also zoomed in over 5.4–3.0 ka: 400–500 µm (red) (this study), 315–400 µm (orange) (Staubwasser et al., 2003). δ18O of G. sacculifer 315–400 µm (green), and δ18O and δ13C of N. dutertrei 315–400 µm (blue) are shown over the interval 5.4–3.0 ka. Data are shown with a 210-year loess smoothing, and modern surface values ±1σ are plotted for comparison. Mean values for all species are denoted by the dotted line, and the pre- and post-4.1 ka mean values are indicated by an additional dotted line for N. dutertrei. Individual AMS radiocarbon dates are denoted by triangles near the timeline.
As in the original data of Staubwasser et al. (2003), the oxygen isotope results show great variability, and distinguishing long-term trends in these data benefits from smoothing for visualization purposes. After completing all statistical tests and performing the differences on the raw data (132 depths), a loess (locally weighted) smoothing function was applied to the δ18O and δ13C data from 5.4 to 3.0 ka, using a 210-year moving window as described by Staubwasser et al. (2003). Loess smoothing uses weighted least squares, which places more importance on the data points closest to the center of the smoothing interval. The bandwidth of 210 years was considered a reasonable time window for capturing the overall trends in the dataset (other time windows are shown for comparison in Fig. S2).
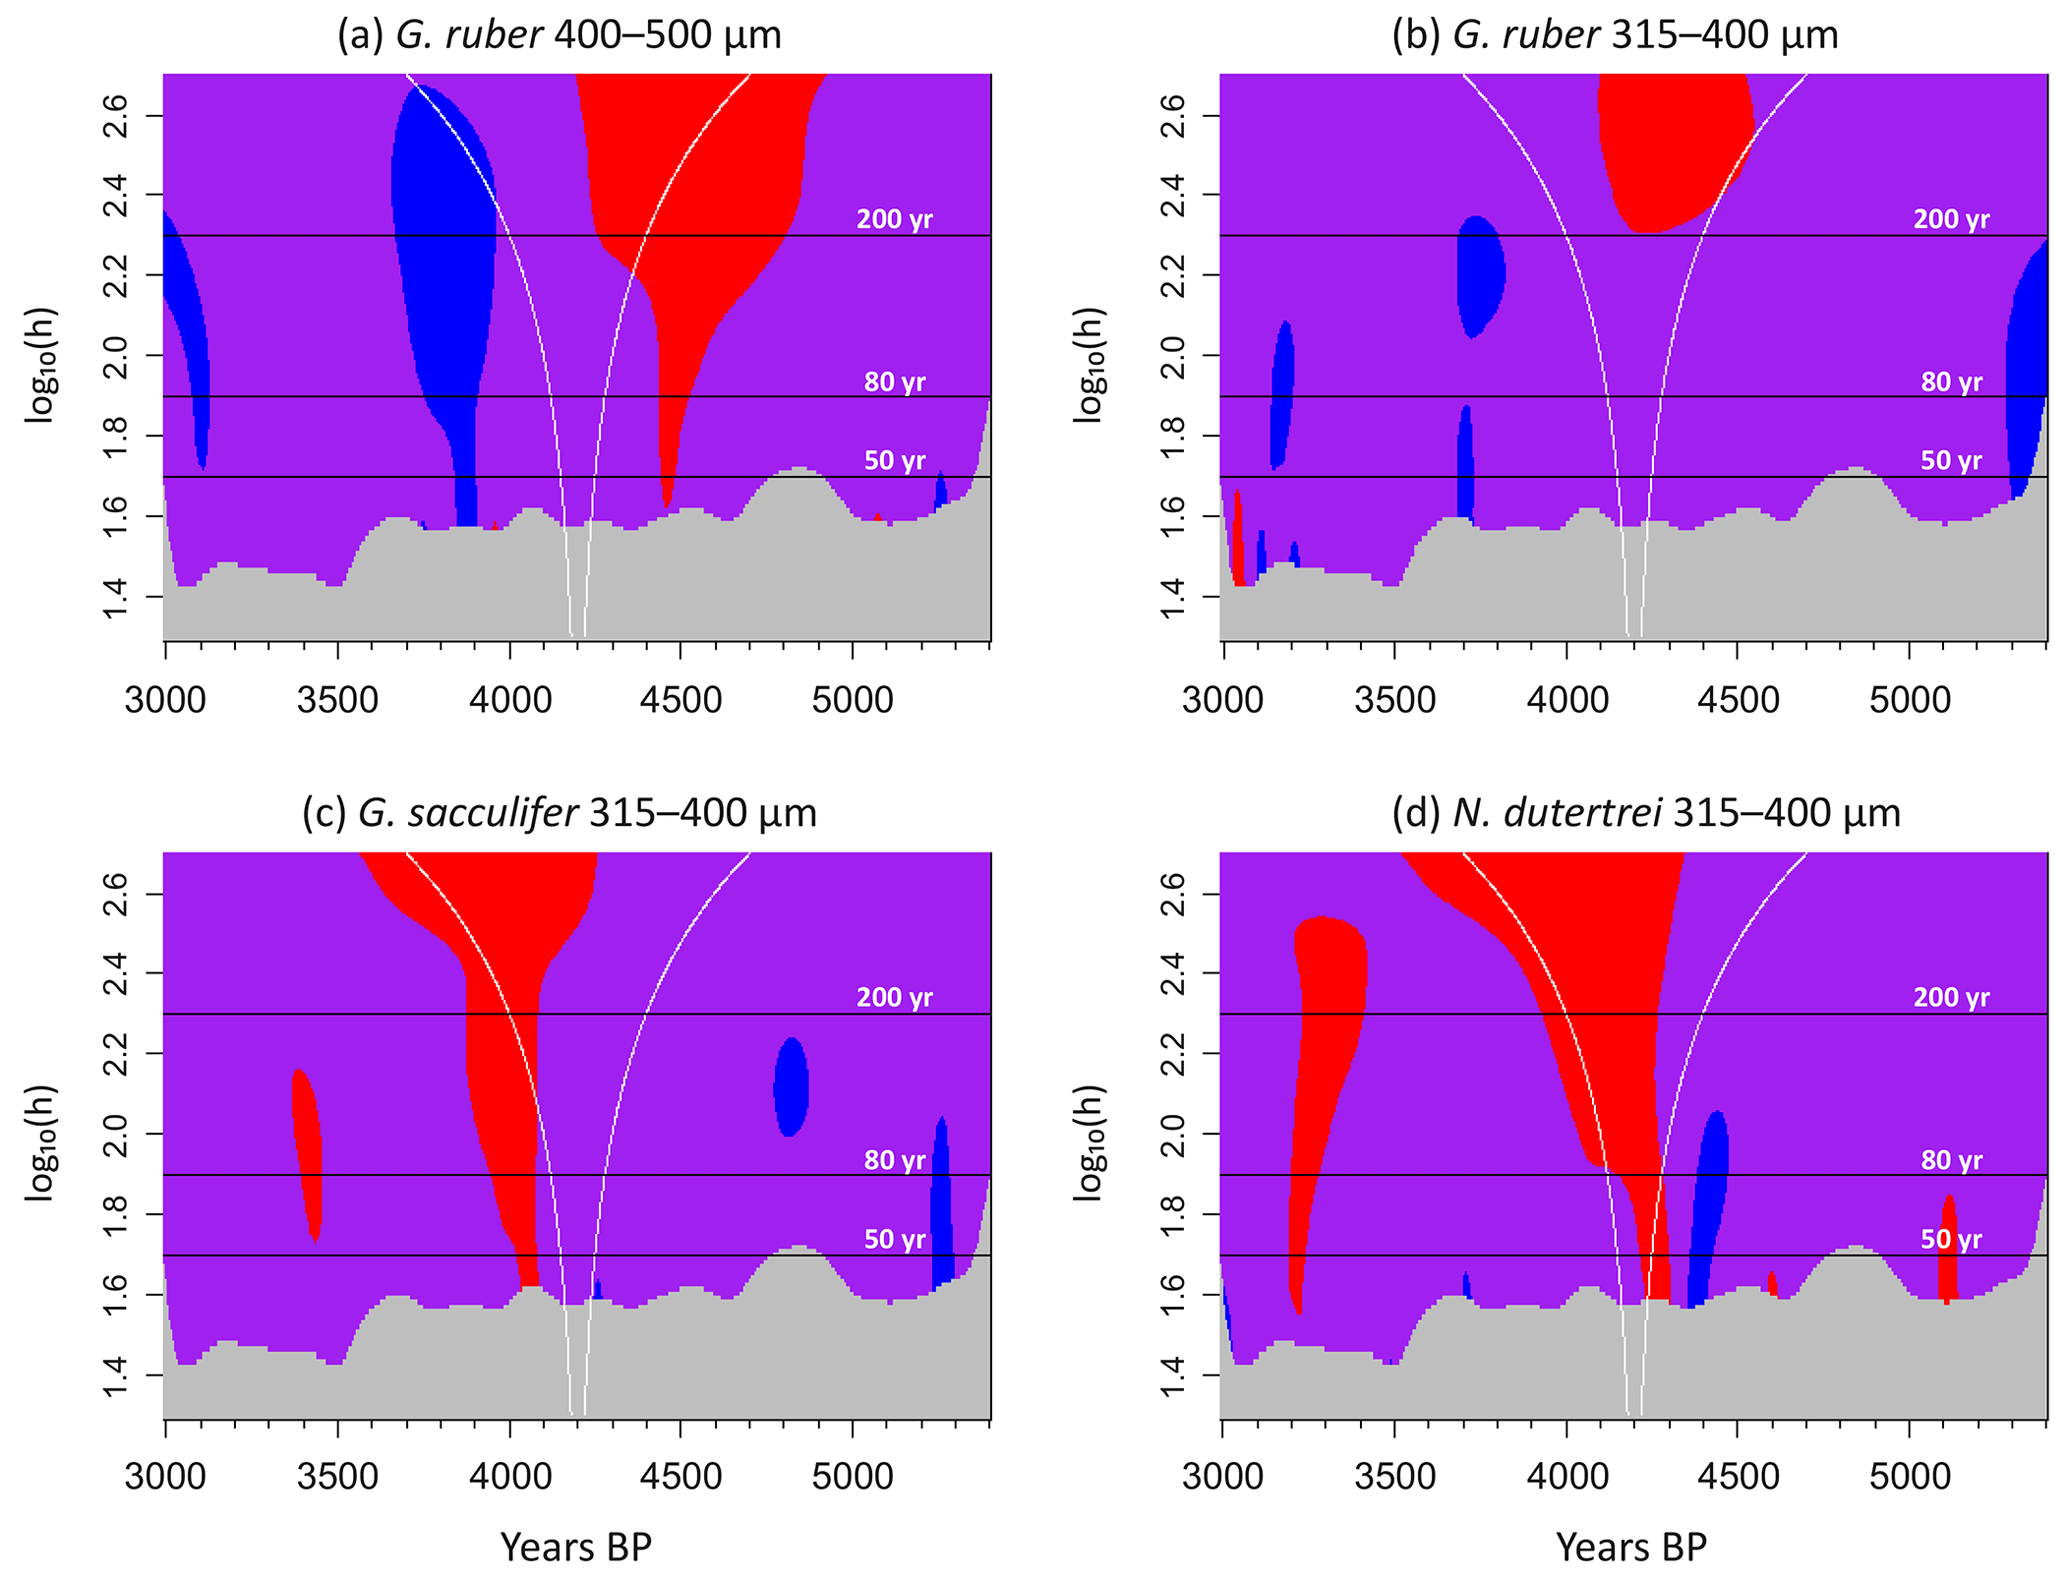
Figure 4SiZer first derivative analysis (Chaudhuri and Marron, 1999; Sonderegger et al., 2009) applied to δ18O of (a) G. ruber 400–500 µm, (b) G. ruber 315–400 µm, (c) G. sacculifer 315–400 µm, and (d) N. dutertrei 315–400 µm. The red areas indicate statistically significant increases in δ18O, the blue represent decreases, and the purple no significant change. Black horizontal lines are the smoothing bandwidths (h=50, 80, and 200 years). The distance between the white lines denotes the change in smoothing bandwidth scaled to the x axis.
The new δ18O measurements of G. ruber (400–500 µm) parallel the published record of G. ruber (315–400 µm) (Staubwasser et al., 2003), but the δ18O of the specimens from the larger size fraction is offset by −0.23 ‰ on average (Fig. 3). The records from two size fractions, produced in different laboratories by different investigators, display a weak positive correlation for the raw data (R=0.25, p<0.01, n=109, slope 0.26, intercept −1.36), and the 210-year smoothed records reveal good agreement in the overall trends of the data. When comparing the two G. ruber records, it is apparent that the increasing trend in δ18O starts well before ∼4.2 ka – perhaps as early as ∼4.9 ka. This trend is also observed with the SiZer analysis, which identifies a significant increase in δ18O anywhere from 4.9 to 4.2 ka depending on which smoothing window is selected (Fig. 4). The new δ18O record of G. ruber (400–500 µm) shows additional detail after the ∼4.2 ka BP event – i.e., specifically, a double-peak maximum occurring at 4.1 and 3.95 ka that is related to seven discrete measurements with high δ18O values. These maxima are offset from the average δ18O value by +0.18 ‰ (smoothed average) or up to +0.38 ‰ when considering the maximum individual measurement at 4.1 ka. The offsets from the average values exceed 1 standard deviation of the entire record from 5.4 to 3.0 ka, which is 0.13 ‰. Although G. ruber shows an event at 4.1 ka, it does not show a permanent step change: Welch's t test comparing the means of pre- and post-4.1 ka indicates that the +0.07 ‰ shift in mean δ18O values of G. ruber (315–400 µm) is statistically significant (t value =2.9, p<0.01, n=115), but the +0.03 ‰ shift in mean δ18O values of G. ruber (400–500 µm) is not significant (t value =1.5, p<0.2, n=118).

Figure 5δ18O of equilibrium calcite (a) calculated from the CTD temperature and salinity profile at station 11 (von Rad, 2013) (b) with projected depth ranges of G. ruber 400–500 µm (red), G. ruber 315–400 µm (orange), G. sacculifer 315–400 µm (green), and N. dutertrei 315–400 µm (blue). We show estimated values using both the original paleotemperature equation of Shackleton (1974) (dark teal) and Kim and O'Neil (1997) (turquoise). Horizontal ranges show the measured δ18O values of each species between 5.4 and 3.0 ka.
The relative differences in δ18O of the planktonic species studied (G. ruber, G. sacculifer, and N. dutertrei) reflect the temperature and salinity of their habitat in the water column: δ18O G. ruber <δ18O G. sacculifer <δ18O N. dutertrei (Fig. 3). G. sacculifer is offset from G. ruber (315–400 µm) by approximately +0.57 ‰, whereas N. dutertrei is offset by +1.14 ‰. The larger size fraction of G. ruber (400–500 µm) is offset from G. ruber (315–400 µm) by −0.23 ‰. The offsets among species are maintained throughout the entire record (Fig. 3). We also measured δ18O values near the top of the core (approximately the last 200 years) for all three species in the 315–400 µm size fraction, which continue to show the same offsets (Fig. S3). The δ18O of G. ruber shows the greatest variance and N. dutertrei shows the least (Fig. S4, Table S1).
Equilibrium calcite calculations based on the salinity and temperature measurements from the September 1993 CTD profile of station 11 of the PAKOMIN Cruise (von Rad, 2013) show the expected depth habitats of the three foraminifer species (Fig. 5). G. ruber is generally found at 0–30 m, G. sacculifer at 15–40 m, and N. dutertrei at 60–150 m (Farmer et al., 2007). Using the CTD profile from our core location, we compare these depth ranges with the measured δ18O values. The calculated depths ranges agree well with those expected on the basis of other studies, placing G. ruber in the upper 10 m, G. sacculifer at 10–40 m, and N. dutertrei at 40–140 m.
G. sacculifer δ18O increases around 4.1 ka, and Welch's t test comparing the means of pre- and post-4.1 ka indicates that the +0.08 ‰ shift in mean δ18O values is statistically significant (t value =3.8, p<0.01, n=128). SiZer analysis also points to a statistically significant increase at ∼4.1–3.9 ka, when considering all smoothing time windows between 20 and 500 years (Fig. 4).
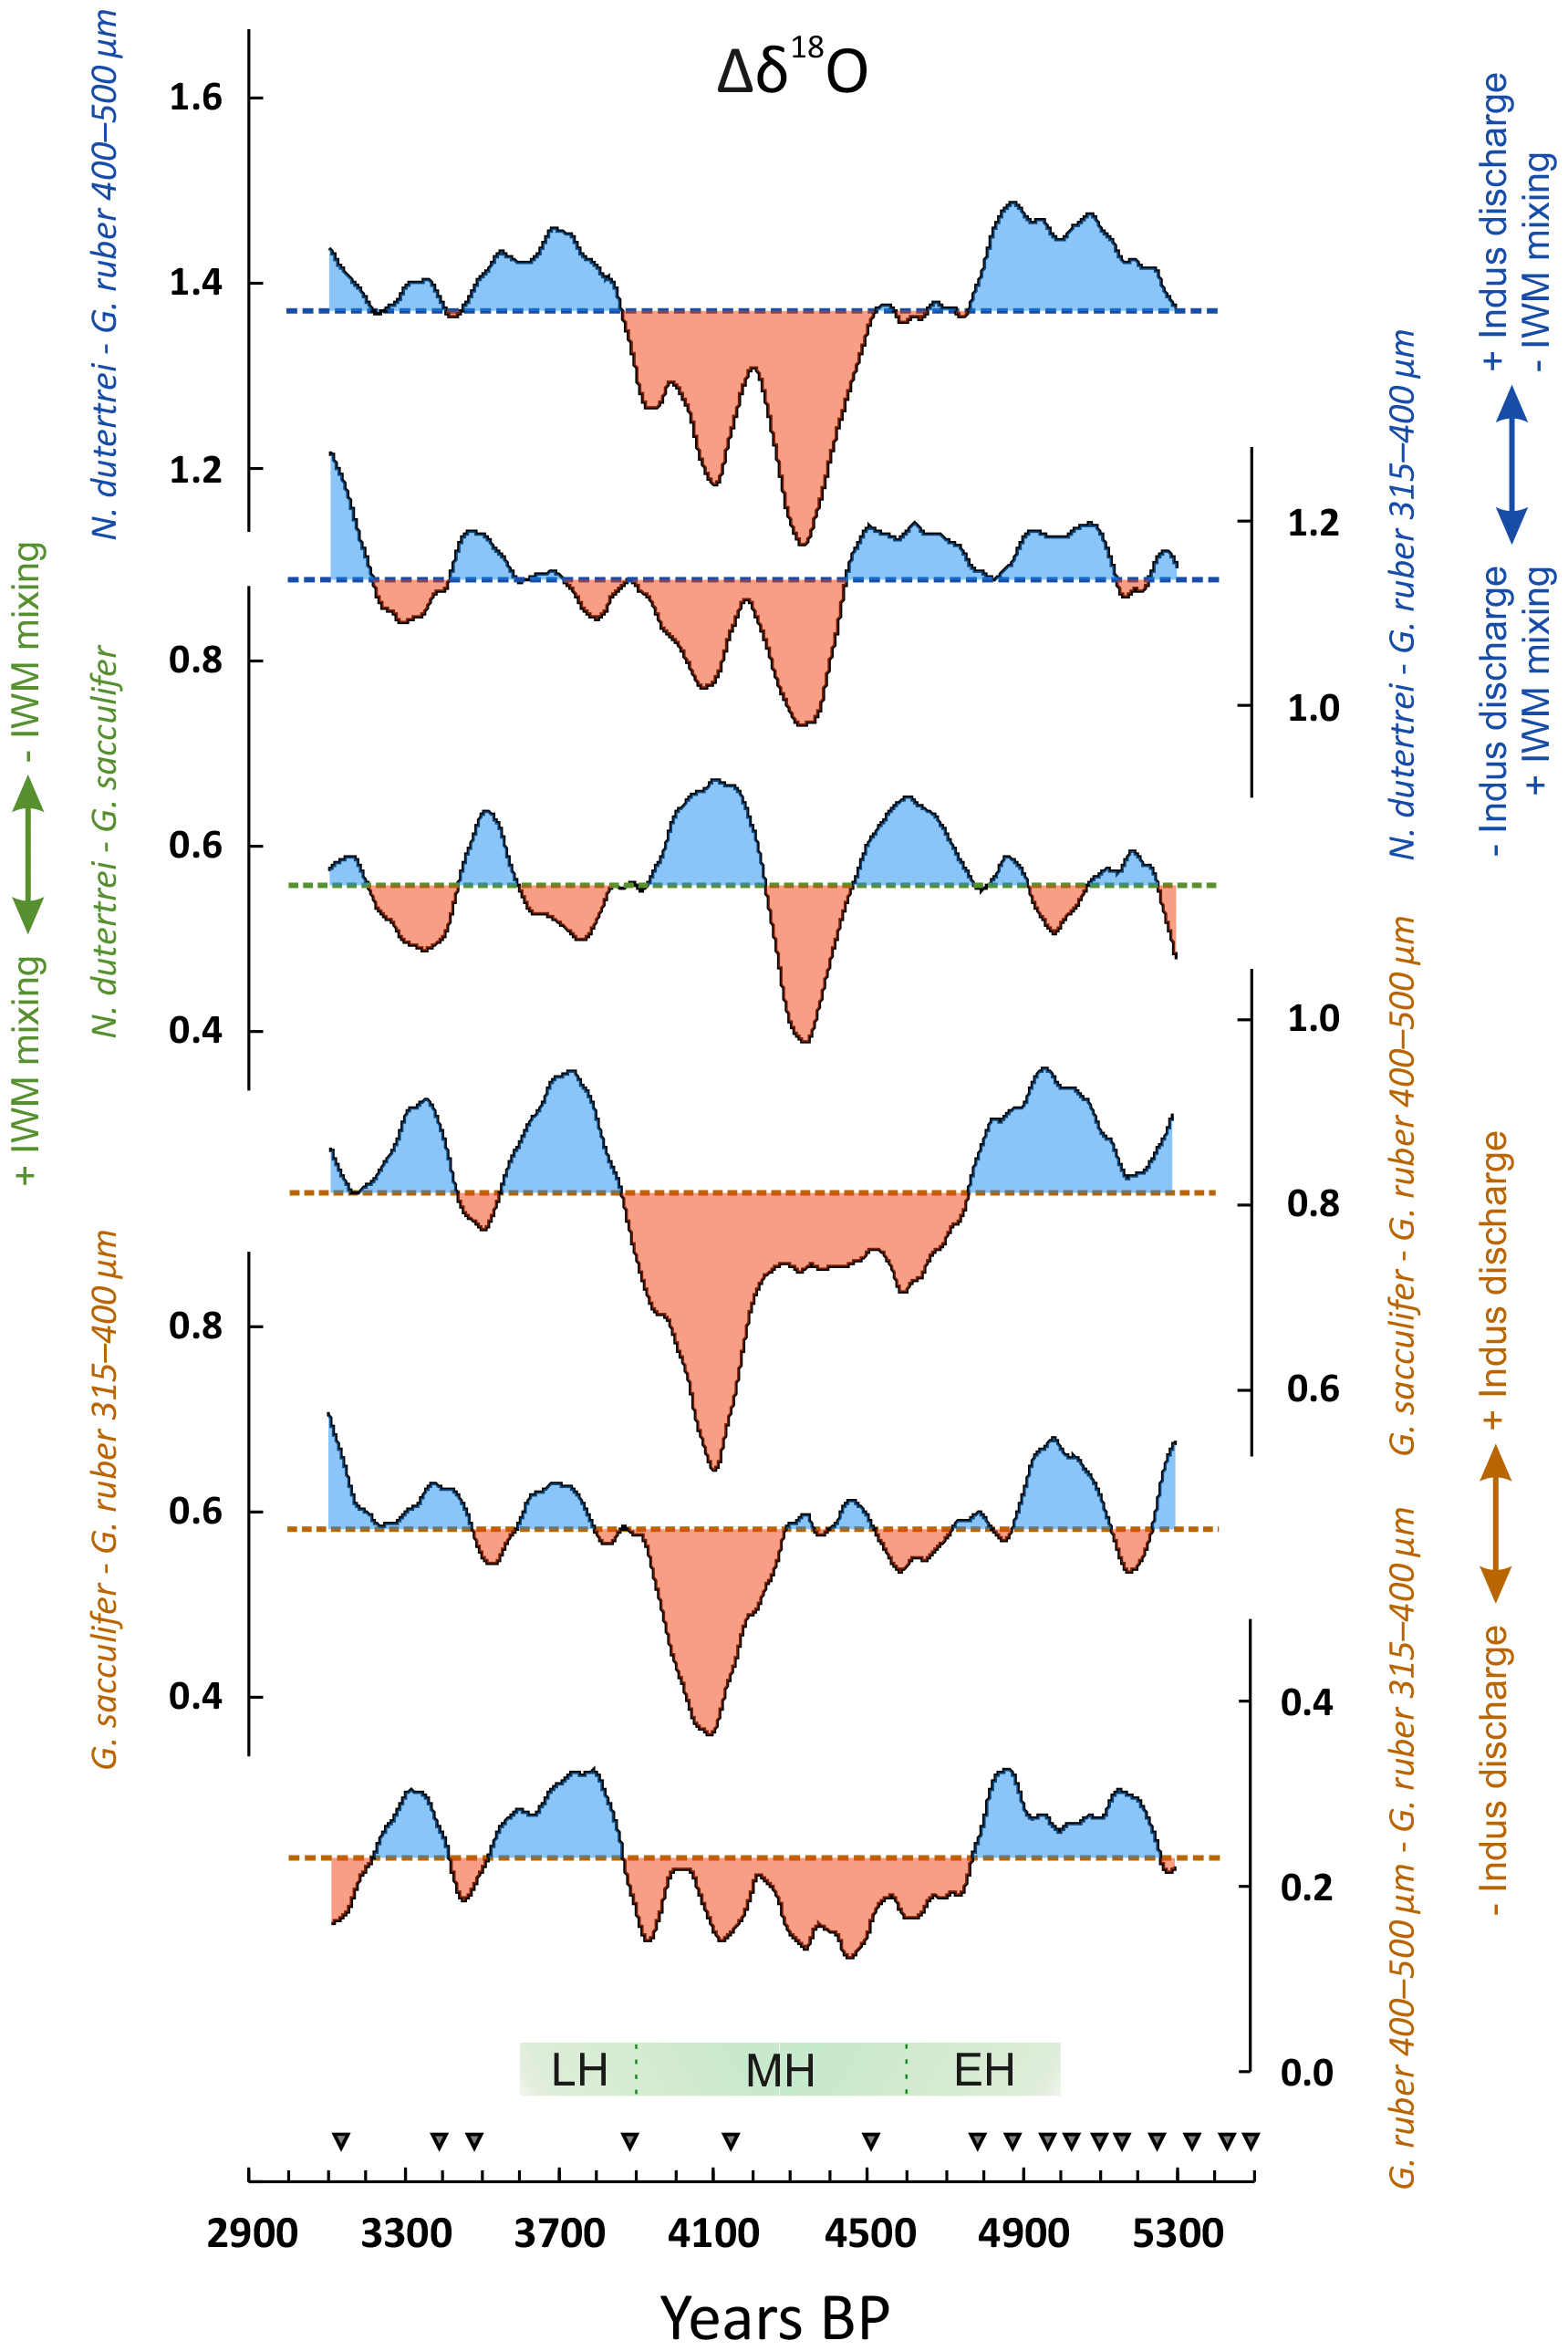
Figure 6Core 63KA Δδ18O shown with a 210-year loess smoothing. Individual AMS radiocarbon dates are denoted by triangles near the timeline. G. ruber 315–400 µm size fraction data come from Staubwasser et al. (2003). The green band near the timeline showing EH, MH, and LH refers to Early Harappan (∼5.0–4.6 ka), Mature Harappan (∼4.6–3.9 ka), and Late Harappan (∼3.9–3.6 ka) periods, respectively.
Likewise, the dominant change in the δ18O of N. dutertrei is a mean increase at 4.1 ka (Fig. 3). SiZer analysis also identifies a significant decrease in δ18O occurring mainly between 4.45 and 4.35 ka, followed by a significant increase between 4.3 and 4.1 ka (Fig. 4). Welch's t test comparing the means of pre- and post-4.1 ka indicates that the +0.08 ‰ shift in mean δ18O values is statistically significant (t value =6.2, p<0.01, n=132), along with the +0.07 ‰ shift in mean δ13C (t value =3.3, p<0.01, n=132).
Differencing δ18O of foraminifera (expressed as Δδ18O) in the same sample can better emphasize signals of interest (Fig. 6). The Δδ18O of G. ruber 400–500 µm and G. ruber 315–400 µm size fractions shows increasing similarity between ∼4.8 and 3.9 ka during the period of overall higher δ18O. The Δδ18O of N. dutertrei and both size fractions of G. ruber, designated , reveals a period of more similar values between ∼4.5 and 3.9 ka, with two minima at 4.3 and 4.1 ka. The Δδ18O of G. sacculifer and both size fractions of G. ruber () show a period of similar values between 4.3 and 3.9 ka, with a minimum difference at 4.1 ka. In contrast, the Δδ18O of N. dutertrei and G. sacculifer () shows the most similarity between 4.5 and 4.2 ka with a minimum at 4.3 ka, followed by the maximum differences between 4.2 and 3.9 ka that peaks at 4.1 ka.
5.1 Interpretation of foraminifer δ18O
The trends in the original δ18O record of G. ruber (315–400 µm) by Staubwasser et al. (2003) are reflected by our independent δ18O measurements of G. ruber in a larger size fraction (400–500 µm), although an important difference exists, suggesting a decrease in freshwater discharge as early as 4.8 ka. The larger size fraction is offset by approximately −0.2 ‰, which is similar to the size-related fractionation of −0.3 ‰ per +100 µm for G. ruber reported by Cayre and Bassinot (1998), and this could be attributed to size-related vital effects. Alternatively, part of the offset might be explained by interlaboratory calibration considering the data were produced using two different methods and mass spectrometers.
The observed 4.1 ka maximum in δ18O of G. ruber, living near the surface during summer months, could be attributed to either decreased SST or increased surface water salinity (Bemis et al., 1998). Staubwasser et al. (2003) acknowledged that a decrease in SST could cause the increase in δ18O in the G. ruber record but argued that this explanation is unlikely because a G. ruber δ18O record from core M5-422 in the northwestern Arabian Sea shows opposing trends over the same time period (Cullen et al., 2000), and a local alkenone SST proxy record shows relatively higher temperatures in the same period (Doose-Rolinski et al., 2001). If the ∼0.2 ‰ (relative to mean) increase in δ18O of G. ruber at 4.1 ka was caused by temperature change rather than salinity, a ∼1 ∘C cooling of surface water would be required (Kim and O'Neil, 1997).
Following Staubwasser et al. (2003), we interpret the δ18O variations of G. ruber to be predominantly a salinity signal. Salinity at the core site is dependent on changes in Indus River discharge, local runoff, and direct precipitation. Although the ISM would be the main influence on direct precipitation and runoff at the coring location, changes in the IWM could also influence Indus River discharge.
The thermocline-dwelling foraminifera N. dutertrei show maximum abundances during winter and are interpreted to reflect winter mixing. During weak IWM conditions, colder unmixed water would result in higher δ18O values of N. dutertrei, whereas enhanced mixing and homogenization of the water column under strong IWM conditions would decrease δ18O. The minimum of δ18O in N. dutertrei occurs between 4.5 and 4.3 ka, pointing to a period of strengthened IWM. We interpret the stepped increase in δ18O of N. dutertrei at 4.1 ka to represent a decrease in IWM wind-driven mixing. Similarly, δ13C of N. dutertrei increases significantly after 4.1 ka (Fig. 3), which could indicate reduced upwelling of low δ13C intermediate water (Lynch-Stieglitz, 2006; Ravelo and Hillaire-Marcel, 2007; Sautter and Thunell, 1991); however, the interpretation of δ13C remains uncertain because of a poor understanding of the controls on the δ13C of planktonic foraminifera in this region. According to the δ18O signal of N. dutertrei, the temperature pattern in the thermocline implies surface cooling between 4.5 and 4.3 ka and surface warming after 4.1 ka interrupted only by a period of cooling between 3.7 and 3.3 ka, which is in broad agreement with records of alkenone sea surface temperature estimates from cores in the northeastern Arabian Sea (“E” in Fig. 1) (Doose-Rolinski et al., 2001; Staubwasser, 2012).
5.2 Interpretation of foraminifer Δδ18O
By using Δδ18O between foraminifer species, we can distinguish between additional processes affecting the surface waters and thermocline (Ravelo and Shackleton, 1995). This technique has been used previously to infer changes in the strength of the East Asian winter monsoon (EAWM) in the South China Sea (Tian et al., 2005), as well as mixed layer and thermocline depth in other studies (Billups et al., 1999; Cannariato and Ravelo, 1997; Norris, 1998). Here we use the difference in the δ18O of G. ruber and N. dutertrei () to track changes in the surface-to-deep gradient. This gradient can be driven by either δ18O changes in the surface-dwelling (G. ruber) and/or the thermocline-dwelling species (N. dutertrei). During times of a strengthened winter monsoon, will decrease as surface waters are homogenized and the thermocline deepens. Similarly, will also decrease during times of a weakened summer monsoon, as decreased Indus River discharge will increase surface water salinity and δ18O of G. ruber will become more similar to N. dutertrei.
G. sacculifer is also a surface dweller but has a slightly deeper depth habitat than G. ruber. We thus expect G. ruber to be more influenced by surface salinity variations than G. sacculifer and suggest the δ18O difference between the two species () reflects the influence of Indus River discharge on near-surface salinity. The smallest difference in occurs at 4.1 ka, which is interpreted as an increase in surface water salinity (Fig. 6).
The difference in δ18O between G. sacculifer and N. dutertrei () also reflects surface mixing and thermocline depth, but G. sacculifer is less affected by surface salinity changes than G. ruber. Thus, the responses of and can be used to differentiate between surface water salinity changes and wind-driven mixing. Accordingly, simultaneously low and indicate a period of increased surface water mixing and increased IWM (such as the period between 4.5 and 4.3 ka), but times of relatively low but high and (around 5.0 ka) indicate periods of increased Indus discharge and strength of the ISM and IWM.
The following period of low from 4.1 to 3.9 ka is likely driven by increased salinity of surface water. This distinction becomes clearer when examining the , where increased similarity from 4.8 to 3.9 ka (with a sharp increase at 4.1 ka) reflects the effect of increased sea surface salinity that reduces the δ18O difference between G. ruber and G. sacculifer. At the same time, weakened winter mixing increases , which occurs from 4.2 to 3.9 ka. Importantly, the proxies also indicate that increased IWM mixing is generally positively correlated with increased Indus discharge and vice versa. The single time period when this does not hold true is 4.5–4.25 ka, when increased IWM mixing is coupled with decreased Indus discharge.
In summary, our multispecies approach using δ18O of G. ruber, G. sacculifer, and N. dutertrei allows us to differentiate between the strength of the IWM and freshwater discharge of the Indus River. We suggest that ISM strength decreased gradually from at least 4.8 ka, while the IWM strength peaked around 4.5–4.3 ka and then weakened afterwards. It is unlikely that the abrupt increase in G. ruber δ18O at 4.1 ka and low could be caused solely by the decrease in IWM strength, even though IWM contributes to Indus River discharge. Weakening of the ISM must have played a substantial role in the 4.1 ka shift as well, indicated by the period 4.5–4.25 ka, when Indus discharge reflected a weak ISM () despite a phase of strengthened IWM.
5.3 Comparison to marine records
Other marine records from the Arabian Sea also suggest a gradual decrease in ISM strength from ∼5 ka (Gupta et al., 2003; Overpeck et al., 1996). Cullen et al. (2000) observed an abrupt peak in aeolian dolomite and calcite in marine sediments in the Gulf of Oman from 4.0 to 3.6 ka, and Ponton et al. (2012) also showed a shift to weaker ISM after 4.0 ka in the Bay of Bengal, based on δ13C of leaf waxes. Marine IWM reconstructions are not particularly coherent: although Doose-Rolinski et al. (2001) find a decrease in evaporation and weakening of the ISM between 4.6 and 3.7 ka, they argue this was accompanied by a relative increase in IWM strength. Giosan et al. (2018) inferred enhanced winter monsoon conditions from 4.5 to 3.0 ka based on a planktic paleo-DNA and percentage of Globigerina falconensis record close to our coring site (“C” in Fig. 1), which disagrees with our finding of decreased upper-ocean mixing after 4.3 ka. We suggest that the high stratigraphic (i.e., laminated) and chronological (i.e., 15 radiocarbon dates between 5.4 and 3.0 ka) resolution of core 63KA paired with a multispecies foraminifer δ18O record provides a robust history of the timing of changes in IWM and ISM strength, but additional studies are needed to resolve some of the discrepancies among the records.

Figure 7Comparison of the δ18O record of core 63KA with terrestrial records from the Indian subcontinent: (a, b) this study; (c) Berkelhammer et al. (2012); (d) Dixit et al. (2018); (e) Dixit et al. (2014); (f) this study; (g) Nakamura et al. (2016); (h) Kathayat et al. (2017). The mean value for each record indicated by the horizontal dashed lines is taken for all available data between 6.0 and 2.5 ka.
5.4 Comparison to regional terrestrial records
The 63KA δ18O record obtained from three foraminifer species highlights several important ocean–atmosphere changes over the 5.4–3.0 ka time period. First, a sharp decrease occurred in both summer and winter precipitation at 4.1 ka, which is within a broader 300-year period of increased aridity spanning both rainfall seasons between 4.2 and 3.9 ka. In detail, we infer a relative decrease in Indus River discharge and weakened ISM between 4.8 and 3.9 ka, peaking at 4.1 ka, while a 200-year-long interval of strong IWM interrupted this period from 4.5 to 4.3 ka. Furthermore, the stepped change in δ18O of N. dutertrei suggests an enduring change in ocean–atmosphere conditions after 4.1 ka.
A relatively abrupt ∼4.2 ka BP climate event has been observed in several terrestrial records on the Indian subcontinent, most notably Mawmluh cave (∼4.1–3.9 ka) in northeastern India (Berkelhammer et al., 2012) and Kotla Dahar (∼4.1 ka) in northwestern India (Dixit et al., 2014) (Fig. 7). A less abrupt yet still arid period is documented in a peat profile (∼4.0–3.5 ka) from north central India (Phadtare, 2000), at Lonar Lake (∼4.6–3.9 ka) in central India (Menzel et al., 2014), and at Rara Lake (∼4.2–3.7 ka) in western Nepal (Nakamura et al., 2016). Finally, a recent study of oxygen and hydrogen isotopes in gypsum hydration water from Karsandi on the northern margin of the Thar Desert showed wet conditions between 5.1 and 4.4 ka, after which the playa lake dried out sometime between 4.4 and 3.2 ka (Dixit et al., 2018). Considering terrestrial records can record more local climatic conditions than marine records, it is remarkable that the records collectively agree on a period of regional aridity between 4.2 and 3.9 ka within the uncertainties of the age models that vary considerably among records.
However, not all records support this finding. For example, a reconstruction from Sahiya Cave in northwestern India shows an abrupt decrease in δ18O interpreted to reflect an increase in monsoon strength from ∼4.3–4.15 ka, followed by an arid trend after 4.15 ka (Kathayat et al., 2017). In addition, several other Thar Desert records do not identify a “4.2 ka BP event” sensu stricto but instead suggest that lakes dried out several centuries earlier (Deotare et al., 2004; Enzel et al., 1999; Singh et al., 1990) or later (Sinha et al., 2006) than 4.2 ka. This discrepancy may relate to nonlinear climate responses of lakes, which would not record a drought at 4.2 ka if they had already dried out earlier from the ongoing decrease in summer rainfall. In addition, there are also significant concerns about chronological uncertainties from the use of radiocarbon of bulk sediment for dating in some of these records. It is also possible that variations in the timing of climate change inferred from the terrestrial records may be real, reflecting a different sensitivity to ISM and IWM rain. As a marine record, core 63KA integrates large-scale ocean–atmosphere changes and therefore can help inform the interpretation of the more locally sensitive terrestrial records.
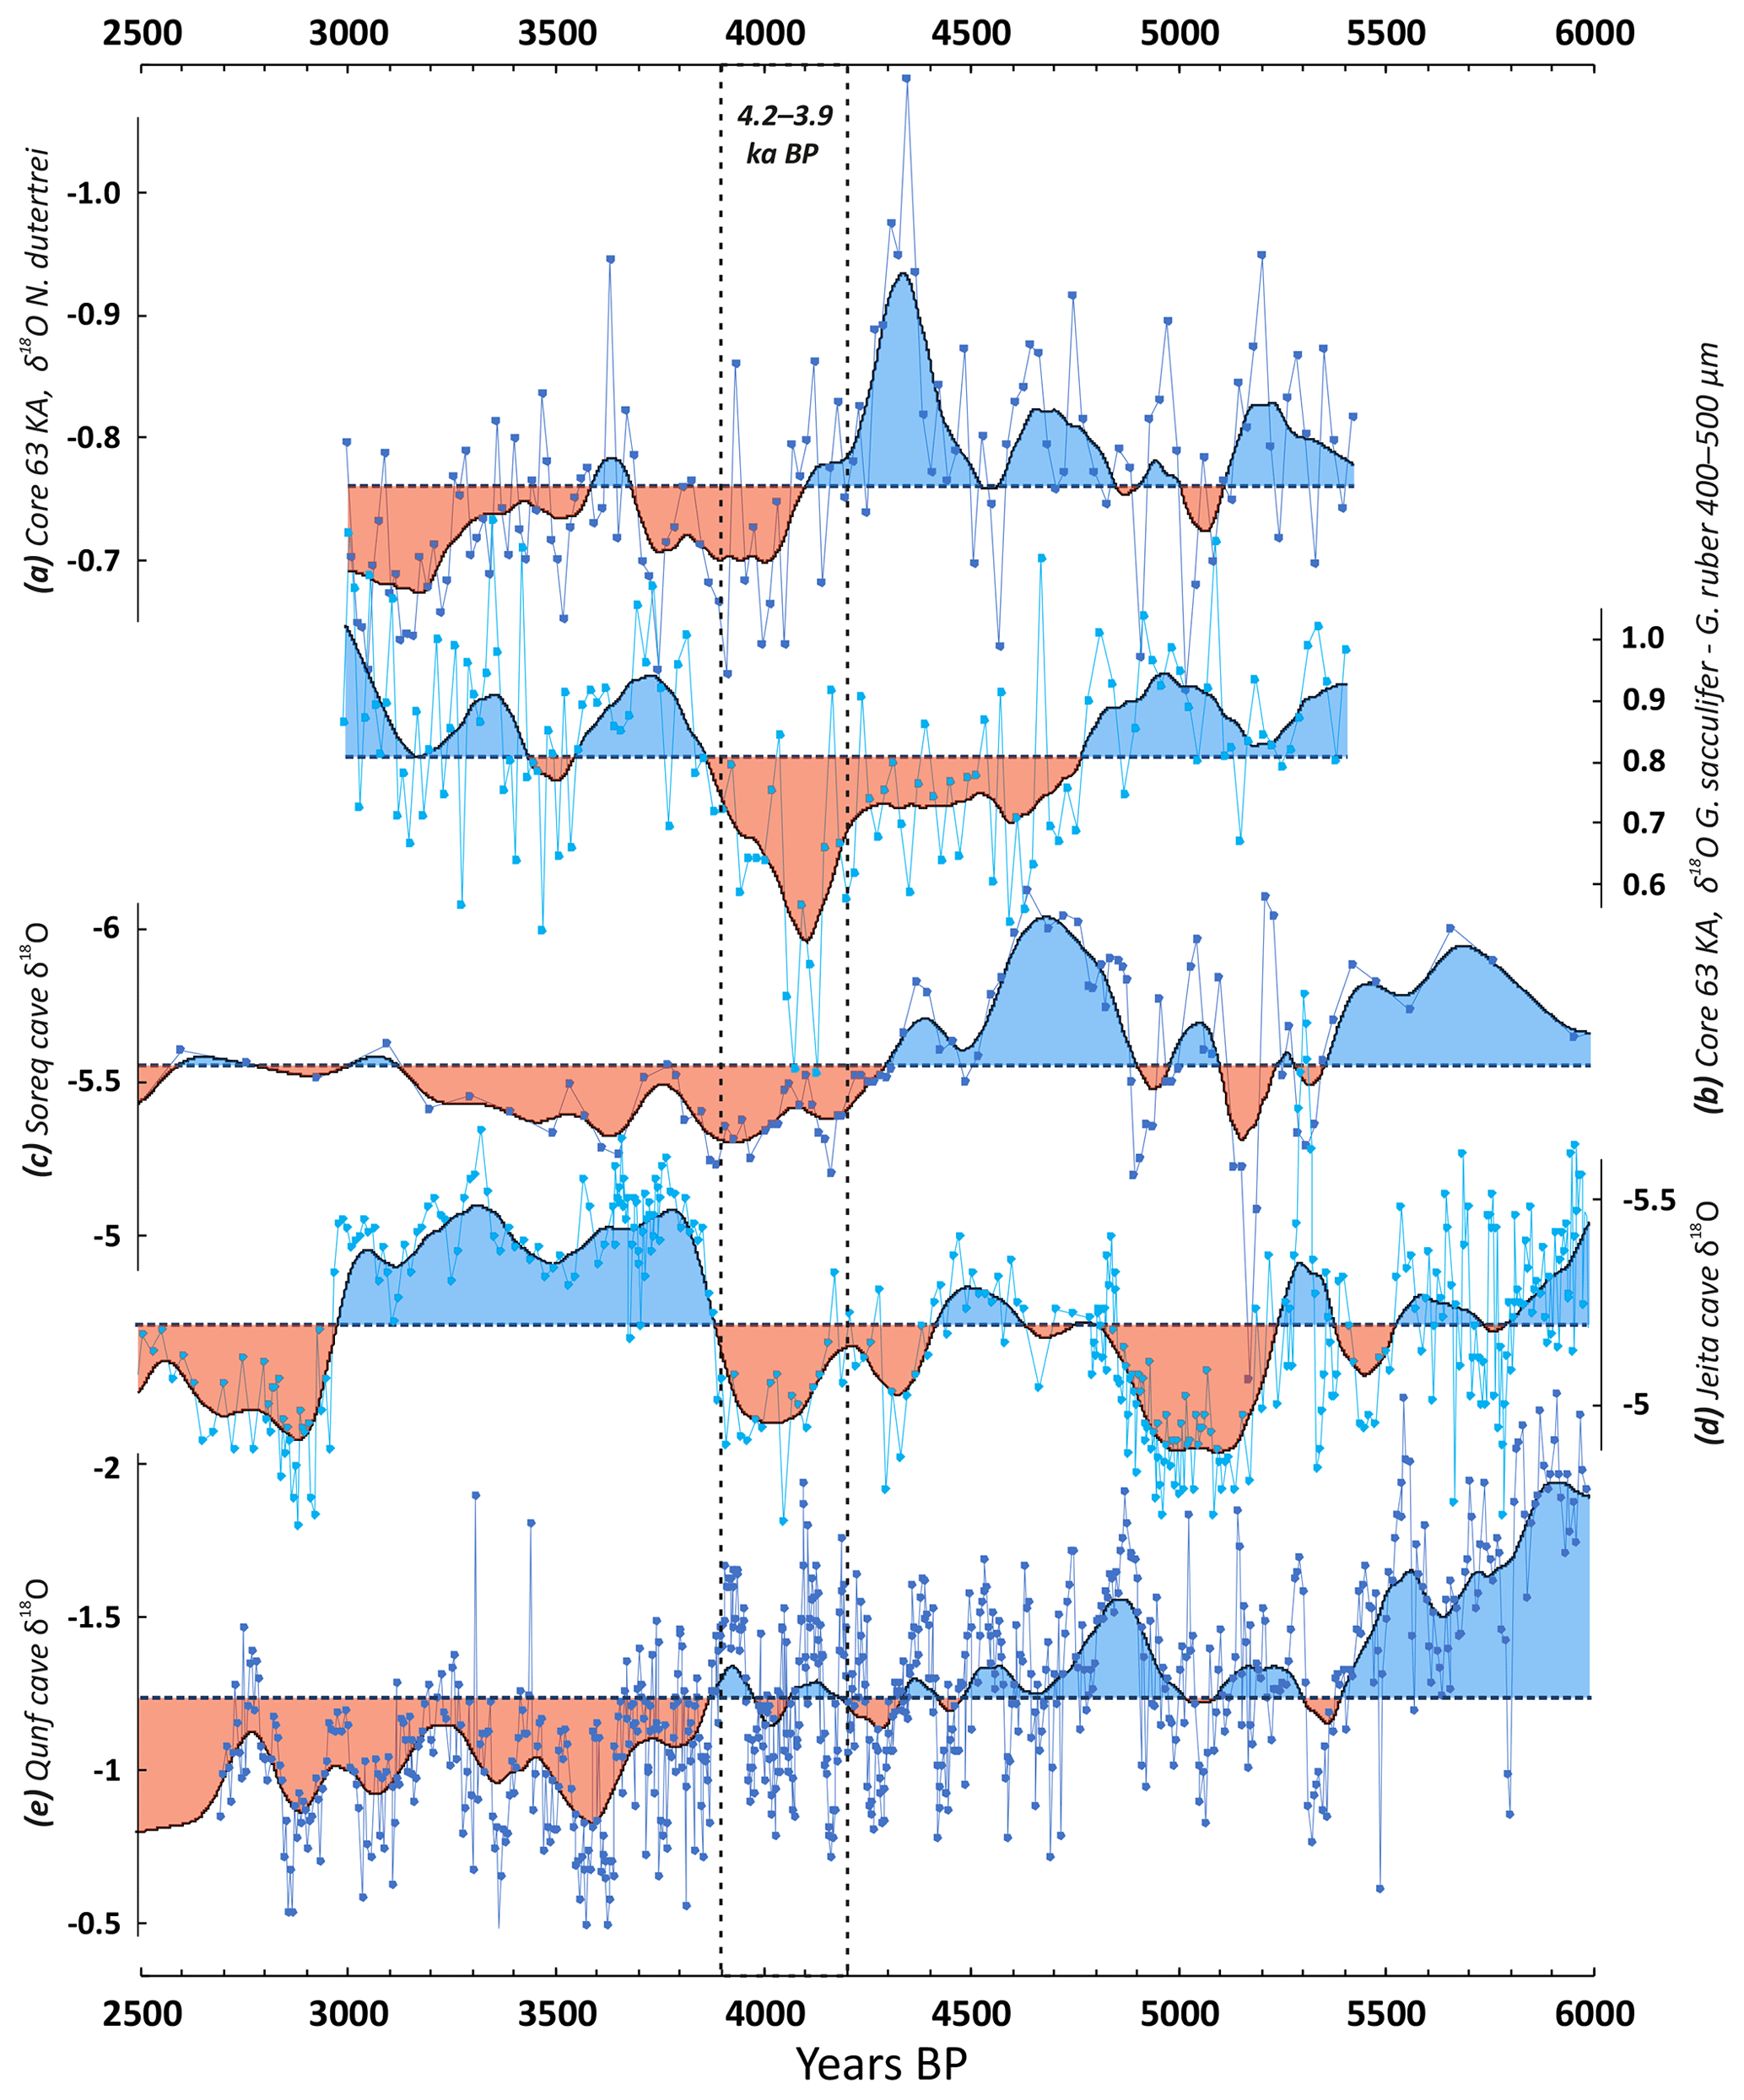
Figure 8Comparison of the δ18O record of core 63KA with more distant records: (a, b) this study; (c) Bar-Matthews et al. (2003); (d) Cheng et al. (2015); (e) Fleitmann et al. (2003). The mean value for each record indicated by the horizontal dashed lines is taken for all available data between 6.0 and 2.5 ka.
More distantly, several terrestrial records in the Middle East also show a decrease in winter precipitation proxies around 4.2 ka: Jeita cave in Lebanon records a relatively dry period between 4.4 and 3.9 ka (Cheng et al., 2015) and Soreq cave in Israel shows a period of increased aridity starting at ∼4.3 ka (Bar-Matthews et al., 2003; Bar-Matthews and Ayalon, 2011) (Fig. 8). Lake Van in eastern Turkey also records reduced spring rainfall and enhanced aridity after ∼4.0 ka (Wick et al., 2003; Lemcke and Sturm, 1997). All of these records suggest a relatively arid period with reduced winter precipitation after ∼4.3 ka, as inferred from core 63KA. Qunf cave in Oman (Fleitmann et al., 2003), which is outside the range of IWM influence, instead shows a steady mid-Holocene weakening of the ISM that closely follows trends in summer solar insolation.
5.5 Cultural impacts
On the basis of our reconstruction of reduced IWM mixing after 4.3 ka, accompanied by decreased freshwater discharge of the Indus River, it is worth considering what impacts could be expected from a reduction in IWM and ISM precipitation. A weakened IWM overlying a reduced or more variable ISM would likely result in a distinct climate signal over the Indus River catchment, with broad implications for seasonal river flow and water availability throughout the year. The presence of the two rainfall systems creates a complex and diverse range of environments and ecologies across northwest South Asia (Petrie et al., 2017). In a situation when rainfall in both seasons is reduced over extended periods, step shifts in the natural environment may occur that are difficult to reverse (e.g., desertification, lake desiccation, regional vegetation changes, decline in overbank flooding, and shift in river avulsion patterns).
Societies reliant on IWM, ISM, or a combination of the two would have been vulnerable to years with monsoon failure, and a shift affecting both seasons will have challenged resilience and tested sustainability (Green et al., 2018; Petrie et al., 2017). Archaeological research into the transition from the urban Mature Harappan phase (∼4.6–3.9 ka) to the post-urban Late Harappan phase (∼3.9–3.6 ka) notes progressive de-urbanization through the abandonment of large Indus cities and a depopulation of the most western Indus regions, concurrent with a general trend towards an increase in concentrations of rural settlements in some areas of the eastern Indus extent (Green and Petrie, 2018; Petrie et al., 2017; Possehl, 1997) (Fig. S6). The relatively limited range of well-resolved available archaeo-botanical data suggests that there was a degree of diversity in crop choice and farming strategies in different parts of the Indus Civilization across this time span (Petrie et al., 2016; Petrie and Bates, 2017; Weber, 1999; Weber et al., 2010). Farmers in southerly regions appear to have focused on summer or winter crops, while the more northern regions of Pakistan Punjab and Indian Punjab and Haryana were capable of supporting combinations of winter and summer crops (Petrie and Bates, 2017). Although there is evidence for diverse cropping practices involving both summer and winter crops in the northern areas during the urban period, agricultural strategies appeared to favor the more intensive use of drought-resistant summer crops in the Late Harappan period (Madella and Fuller, 2006; Petrie and Bates, 2017; Pokharia et al., 2017; Weber, 2003; Wright, 2010). It has previously been suggested that a weakened ISM was a major factor in these shifts (e.g., Giosan et al., 2012; Madella and Fuller, 2006). Based on our reconstruction of a decreased IWM in northwest South Asia after 4.3 ka with a step shift at 4.1 ka, we suggest that both IWM and ISM climatic factors played a role in shaping the human landscape. This includes the redistribution of population to smaller settlements in eastern regions with more direct summer rain, as well as the shift to increased summer-crop-dominated cropping strategies.
This study expanded on the δ18O record of planktonic foraminifer in core 63KA of the northeastern Arabian Sea, originally published by Staubwasser et al. (2003). Using δ18O of the surface-dwelling foraminifera G. ruber, the original study inferred an abrupt reduction in Indus River discharge at ∼4.2 ka. Our further δ18O analysis of a larger size fraction of this species corroborates maximum salinity at 4.1 and 3.95 ka. In addition, the δ18O difference between the surface-dwelling G. ruber and slightly deeper-dwelling G. sacculifer () reveals that surface waters were more saline than average for the period from 4.8 to 3.9 ka. By also measuring a thermocline-dwelling planktonic foraminiferal species, N. dutertrei, we infer an increase in the strength of the IWM between 4.5 and 4.3 ka, followed by a reduction in IWM-driven mixing that reaches a minimum at 4.1 ka.
Assuming that weaker IWM mixing implies a reduction in IWM rainfall amount or duration over northwest South Asia under past climatic conditions, the 63KA core is used to infer important changes in seasonal hydrology of the Indus River catchment. We propose that a combined weakening of the IWM and ISM at 4.1 ka led to what has been termed the “4.2 ka BP” drought over northwest South Asia. The intersection of both a gradually weakening ISM since 4.8 ka and a maximum decrease in IWM strength at 4.1 ka resulted in a spatially layered and heterogeneous drought over a seasonal to annual timescale. Regions in the western part of the Indus River basin accustomed to relying mainly on winter rainfall (also via river runoff) would have been most severely affected by such changes. Regions in the northeastern and eastern extents benefitted more from summer rainfall and would have been less severely affected, particularly as the ISM appears to recover strength by 3.9 ka.
Relatively strengthened IWM surface water mixing between 4.5 and 4.3 ka correlates with a period of higher precipitation recorded at Karsandi on the northern margin of the Thar Desert (Dixit et al., 2018), an area within the summer rainfall zone that is also sensitive to small changes in winter precipitation. This time span also represents the beginnings of the Mature Harappan phase (Possehl, 2002; Wright, 2010), which implies that increasingly urbanized settlements may have flourished under a strengthened IWM. With a weakening of the IWM at ∼4.1 ka, eastern regions with more access to ISM rainfall may have been more favorable locations for agriculture. This may also help explain the broad shift in population towards more rural settlements in the northeastern extent of the Indus Civilization that occurred by ∼3.9 ka (Possehl, 1997; Petrie et al., 2017) and a shift to more drought-tolerant kharif (summer) season crops in Gujarat (Pokharia et al., 2017) and at Harappa (Madella and Fuller, 2006; Weber, 2003).
Given the importance of the relationships between humans and the environment during the time of the Indus Civilization, understanding the impact of the IWM on precipitation variability in northwest South Asia remains a critical area of research. We especially need a better understanding of the wind patterns and moisture pathways that controlled the IWM in the past. Disentangling both the length and intensity of seasonal precipitation is a crucial aspect of understanding the impact of climate change on past societies, particularly in a diverse region relying on mixed water sources (e.g., fluvial, ground aquifer, direct rainfall).
Data presented in the paper can be accessed by contacting the corresponding author or online at http://eprints.esc.cam.ac.uk/4371/ (Giesche et al., 2018).
The supplement related to this article is available online at: https://doi.org/10.5194/cp-15-73-2019-supplement.
MS supplied core 63KA material, AG prepared the material for isotopic measurements, and AG and DAH interpreted the results. AG, DAH, and CAP wrote the paper.
The authors declare that they have no conflict of interest.
This article is part of the special issue “The 4.2 ka BP climatic event”. It is a result of “The 4.2 ka BP event: an international workshop”, Pisa, Italy, 10–12 January 2018.
This research was carried out as part of the TwoRains project, which
is supported by funding from the European Research Council (ERC) under the
European Union's Horizon 2020 research and innovation programme (grant
agreement no. 648609). The authors thank the following persons at the
University of Cambridge: Maryline Vautravers for foraminifera identification
and James Rolfe and John Nicolson for δ18O measurements. We
also thank our editor and reviewers for comments that improved the
paper.
Edited by: Harvey Weiss
Reviewed by: Ashish Sinha and two anonymous referees
Agrawal, D. P.: The Indus Civilization: an interdisciplinary perspective, Aryan Books International, New Delhi, India, 2007.
Ahmad, N., Mohammad, A., and Khan, S. T.: Country Report on Water resources of Pakistan, in: South Asia Water Balance Workshop, 30 April–2 May 2001, San Diego, California, USA, Hansen Institute for World Peace, 2001.
Banse, K.: Overview of the hydrography and associated biological phenomena in the Arabian Sea off Pakistan, in Marine Geology and Oceanography of the Arabian Sea and Coastal Pakistan, edited by: Haq, B. U. and Milliman, J. D., Van Nostrand Reinhold, New York, USA, 273–301, 1984.
Bar-Matthews, M. and Ayalon, A.: Mid-Holocene climate variations revealed by high-resolution speleothem records from Soreq Cave, Israel and their correlation with cultural changes, Holocene, 21, 163–171, 2011.
Bar-Matthews, M., Ayalon, A., Gilmour, M., Matthews, A., and Hawkesworth, C. J.: Sea–land oxygen isotopic relationships from planktonic foraminifera and speleothems in the Eastern Mediterranean region and their implication for paleorainfall during interglacial intervals, Geochim. Cosmochim. Ac., 67, 3181–3199, 2003.
Bé, A. W. and Hutson, W. H.: Ecology of planktonic foraminifera and biogeographic patterns of life and fossil assemblages in the Indian Ocean, Micropaleontology, 23, 369–414, 1977.
Bemis, B. E., Spero, H. J., Bijma, J., and Lea, D. W.: Reevaluation of the oxygen isotopic composition of planktonic foraminifera: Experimental results and revised paleotemperature equations, Paleoceanography, 13, 150–160, 1998.
Berkelhammer, M., Sinha, A., Stott, L., Cheng, H., Pausata, F. S., and Yoshimura, K.: An abrupt shift in the Indian monsoon 4000 years ago, Geophys. Monogr. Ser, 198, 75–87, 2012.
Billups, K., Ravelo, A. C., Zachos, J. C., and Norris, R. D.: Link between oceanic heat transport, thermohaline circulation, and the Intertropical Convergence Zone in the early Pliocene Atlantic, Geology, 27, 319–322, 1999.
Blaauw, M. and Christen, J. A.: Flexible paleoclimate age-depth models using an autoregressive gamma process, Bayesian Anal., 6, 457–474, 2011.
Cannariato, K. G. and Ravelo, A. C.: Pliocene-Pleistocene evolution of eastern tropical Pacific surface water circulation and thermocline depth, Paleoceanography, 12, 805–820, https://doi.org/10.1029/97PA02514, 1997.
Cayre, O. and Bassinot, F.: Oxygen isotope composition of planktonic foraminiferal shells over the Indian Ocean: calibration to modern oceanographic data, Mineral. Mag., 62, 288–289, 1998.
Chaudhuri, P. and Marron, J. S.: SiZer for exploration of structures in curves, J. Am. Stat. Assoc., 94, 807–823, 1999.
Cheng, H., Sinha, A., Verheyden, S., Nader, F. H., Li, X. L., Zhang, P. Z., Yin, J. J., Yi, L., Peng., Y. B., Rao, Z. G., Ning, Y. F., and Edwards, R. L.: The climate variability in northern Levant over the past 20,000 years, Geophys. Res. Lett., 42, 8641–8650, 2015.
Cullen, H. M., deMenocal, P. B., Hemming, S., Hemming, G., Brown, F. H., Guilderson, T., and Sirocko, F.: Climate change and the collapse of the Akkadian empire: Evidence from the deep sea, Geology, 28, 379–382, 2000.
Curry, W. B., Ostermann, D. R., Guptha, M. V. S., and Ittekkot, V.: Foraminiferal production and monsoonal upwelling in the Arabian Sea: evidence from sediment traps, Geol. Soc. Spec. Publ., 64, 93–106, 1992.
Dahl, K. A. and Oppo, D. W.: Sea surface temperature pattern reconstructions in the Arabian Sea, Paleoceanography, 21, PA1014, https://doi.org/10.1029/2005PA001162, 2006.
Deotare, B. C., Kajale, M. D., Rajaguru, S. N., Kusumgar, S., Jull, A. J. T., and Donahue, J. D.: Palaeoenvironmental history of Bap-Malar and Kanod playas of western Rajasthan, Thar desert, J. Earth Syst. Sci., 113, 403–425, 2004.
Dimri, A. P.: Surface and upper air fields during extreme winter precipitation over the western Himalayas, Pure Appl. Geophys., 163, 1679–1698, 2006.
Dimri, A. P. and Dash, S. K.: Wintertime climatic trends in the western Himalayas, Climatic Change, 111, 775–800, 2012.
Dixit, Y., Hodell, D. A., and Petrie, C. A.: Abrupt weakening of the summer monsoon in northwest India ∼4100 yr ago, Geology, 42, 339–342, 2014.
Dixit, Y., Hodell, D. A., Giesche, A., Tandon, S. K., Gázquez, F., Saini, H. S., Skinner, L. C., Mujtaba, S. A. I., Pawar, V., Singh, R. N., and Petrie, C. A.: Intensified summer monsoon and the urbanization of Indus Civilization in northwest India, Sci. Rep., 8, 4225, https://doi.org/10.1038/s41598-018-22504-5, 2018.
Doose-Rolinski, H., Rogalla, U., Scheeder, G., Lückge, A., and Rad, U.: High-resolution temperature and evaporation changes during the late Holocene in the northeastern Arabian Sea, Paleoceanography and Paleoclimatology, 16, 358–367, 2001.
Duplessy, J. C., Labeyrie, L., Arnold, M., Paterne, M., Duprat, J., and van Weering, T. C.: Changes in surface salinity of the North Atlantic Ocean during the last deglaciation, Nature, 358, 485–488, https://doi.org/10.1038/358485a0, 1992.
Enzel, Y., Ely, L. L., Mishra, S., Ramesh, R., Amit, R., Lazar, B., Rajaguru, S. N., Baker, V. R., and Sandler, A.: High-resolution Holocene environmental changes in the Thar Desert, northwestern India, Science, 284, 125–128, 1999.
Farmer, E. C., Kaplan, A., de Menocal, P. B., and Lynch-Stieglitz, J.: Corroborating ecological depth preferences of planktonic foraminifera in the tropical Atlantic with the stable oxygen isotope ratios of core top specimens, Paleoceanography, 22, PA3205, https://doi.org/10.1029/2006PA001361, 2007.
Finné, M., Holmgren, K., Sundqvist, H. S., Weiberg, E., and Lindblom, M.: Climate in the eastern Mediterranean, and adjacent regions, during the past 6000 years – A review, J. Archaeol. Sci., 38, 3153–3173, 2011.
Fleitmann, D., Burns, S. J., Mudelsee, M., Neff, U., Kramers, J., Mangini, A., and Matter, A.: Holocene forcing of the Indian monsoon recorded in a stalagmite from southern Oman, Science, 300, 1737–1739, 2003.
Gadgil, S.: The Indian monsoon and its variability, Annu. Rev. Earth Pl. Sc., 31, 429–467, 2003.
Giesche, A., Staubwasser, M., Petrie, C. A., and Hodell, D. A.: 63KA_DataFile_CP.xlsx, available at: http://eprints.esc.cam.ac.uk/4371/, last access: 22 December 2018.
Giosan, L., Clift, P. D., Macklin, M. G., Fuller, D. Q., Constantinescu, S., Durcan, J. A., Stevens, T., Duller, G. A. T., Tabrez, A. R., Gangal, K., Adhikari, R., Alizai, A., Filip, F., VanLaningham, S., and Syvitski, J. P. M.: Fluvial landscapes of the Harappan civilization, P. Natl. Acad. Sci., 109, E1688–E1694, 2012.
Giosan, L., Orsi, W. D., Coolen, M., Wuchter, C., Dunlea, A. G., Thirumalai, K., Munoz, S. E., Clift, P. D., Donnelly, J. P., Galy, V., and Fuller, D. Q.: Neoglacial climate anomalies and the Harappan metamorphosis, Clim. Past, 14, 1669–1686, https://doi.org/10.5194/cp-14-1669-2018, 2018.
Green, A. S. and Petrie, C. A.: Landscapes of Urbanization and De-Urbanization: A Large-Scale Approach to Investigating the Indus Civilization's Settlement Distributions in Northwest India, J. Field Archaeol., 43, 284–299, https://doi.org/10.1080/00934690.2018.1464332, 2018.
Green, A. S., Bates, J., Acabado, S., Coutros, P., Glover, J., Miller, N., Sharratt, N., and Petrie, C. A.: How to Last a Millennium; Or a Global Perspective on the Long-Term Dynamics of Human Sustainability, under review for Nature Sustainability, 2018.
Gupta, A. K., Anderson, D. M., and Overpeck, J. T.: Abrupt changes in the Asian southwest monsoon during the Holocene and their links to the North Atlantic Ocean, Nature, 421, 354–357, https://doi.org/10.1038/nature01340, 2003.
Hastenrath, S. and Lamb, P. J.: Climatic atlas of the Indian Ocean. Part II: The oceanic heat budget, Wisconsin University Press, Madison, Wisconsin, USA, 18, 97 pp., 1979.
Hatwar, H. R., Yadav, B. P., and Rao, Y. R.: Prediction of western disturbances and associated weather over Western Himalayas, Curr. Sci., 88, 913–920, 2005.
Hemleben, C., Spindler, M., and Anderson, O. R.: Modern planktonic foraminifera, Springer Science and Business Media, New York, NY, USA, 2012.
Joseph, S. and Freeland, H. J.: Salinity variability in the Arabian Sea, Geophys. Res. Lett., 32, L09607, https://doi.org/10.1029/2005GL022972, 2005.
Karim, A. and Veizer, J.: Water balance of the Indus River Basin and moisture source in the Karakoram and western Himalayas: Implications from hydrogen and oxygen isotopes in river water, J. Geophys. Res.-Atmos., 107, 4362, https://doi.org/10.1029/2000JD000253, 2002.
Kathayat, G., Cheng, H., Sinha, A., Yi, L., Li, X., Zhang, H., Li, H., Ning, Y., and Edwards, R. L.: The Indian monsoon variability and civilization changes in the Indian subcontinent, Sci. Adv., 3, e1701296, https://doi.org/10.1126/sciadv.1701296, 2017.
Kim, S. T. and O'Neil, J. R.: Equilibrium and nonequilibrium oxygen isotope effects in synthetic carbonates, Geochim. Cosmochim. Ac., 61, 3461–3475, 1997.
Kumar, S. P. and Prasad, T. G.: Formation and spreading of Arabian Sea high-salinity water mass, J. Geophys. Res.-Oceans, 104, 1455–1464, 1999.
Lemcke, G. and Sturm, M.: δ18O and trace element measurements as proxy for the reconstruction of climate changes at Lake Van (Turkey): Preliminary results, in Third millennium BC climate change and Old World collapse, Springer, Berlin, Heidelberg, Germany, 653–678, 1997.
Locarnini, R. A., Mishonov, A. V., Antonov, J. I., Boyer, T. P., Garcia, H. E., Baranova, O. K., Zweng, M. M., Paver, C. R., Reagan, J. R., Johnson, D. R., Hamilton, M., and Seidov, D.: World Ocean Atlas 2013, Volume 1: Temperature, edited by: Levitus, S. and Mishonov, A., NOAA Atlas NESDIS 73, Silver Spring, MD, USA, 40 pp., 2013.
Lynch-Stieglitz, J.: Tracers of past ocean circulation, in: Treatise on geochemistry, 6, edited by: Elderfield, H., Holland, H. D., and Turekian, K. K., Elsevier, Amsterdam, the Netherlands, 433–451, 2006.
Madella, M. and Fuller, D. Q.: Palaeoecology and the Harappan Civilisation of South Asia: a reconsideration, Quaternary Sci. Rev., 25, 1283–1301, 2006.
Madhupratap, M., Kumar, S. P., Bhattathiri, P. M. A., Kumar, M. D., Raghukumar, S., Nair, K. K. C., and Ramaiah, N.: Mechanism of the biological response to winter cooling in the northeastern Arabian Sea, Nature, 384, 549–552, 1996.
Maslin, M. A., Shackleton, N. J., and Pflaumann, U.: Surface water temperature, salinity, and density changes in the northeast Atlantic during the last 45,000 years: Heinrich events, deep water formation, and climatic rebounds, Paleoceanography, 10, 527–544, 1995.
Mayewski, P. A., Rohling, E. E., Stager, J. C., Karlén, W., Maasch, K. A., Meeker, L. D., Meyerson, E. A., Gasse, F., van Kreveld, S., Holmgren, K., Lee-Thorp, J., Rosqvist, G., Rack, F., Staubwasser, M., Schneider, R. R., and Steig, E. J.: Holocene climate variability, Quaternary Res., 62, 243–255, 2004.
Menzel, P., Gaye, B., Mishra, P. K., Anoop, A., Basavaiah, N., Marwan, N., Plessen, B., Prasad, S., Riedel, N., Stebich, M., and Wiesner, M. G.: Linking Holocene drying trends from Lonar Lake in monsoonal central India to North Atlantic cooling events, Palaeogeogr. Palaeocl., 410, 164–178, 2014.
Nakamura, A., Yokoyama, Y., Maemoku, H., Yagi, H., Okamura, M., Matsuoka, H., Miyake, N., Osada, T., Adhikari, D. P., Dangol, V., Ikehara, M., Miyairi, Y., and Matsuzaki, H.: Weak monsoon event at 4.2 ka recorded in sediment from Lake Rara, Himalayas, Quatern. Int., 397, 349–359, 2016.
Norris, R. D.: Planktonic foraminifer biostratigraphy: eastern equatorial Atlantic, in: Proceedings of the Ocean Drilling Program: Scientific results, 159, 445–479, 1998.
Overpeck, J., Anderson, D., Trumbore, S., and Prell, W.: The southwest Indian Monsoon over the last 18000 years, Clim. Dynam., 12, 213–225, 1996.
Petrie, C. A. and Bates, J.: `Multi-cropping', Intercropping and Adaptation to Variable Environments in Indus South Asia, J. World Prehist., 30, 81–130, 2017.
Petrie, C. A., Bates, J., Higham, T., and Singh, R. N.: Feeding ancient cities in South Asia: dating the adoption of rice, millet and tropical pulses in the Indus civilisation, Antiquity, 90, 1489–1504, 2016.
Petrie, C. A., Singh, R. N., Bates, J., Dixit, Y., French, C. A., Hodell, D. A., Pandey, A. K., Parikh, D., Pawar, V., Redhouse, D. I., and Singh, D. P.: Adaptation to variable environments, resilience to climate change: Investigating land, water and settlement in Indus Northwest India, Curr. Anthropol., 58, 2017.
Phadtare, N. R.: Sharp decrease in summer monsoon strength 4000–3500 cal yr BP in the Central Higher Himalaya of India based on pollen evidence from alpine peat, Quaternary Res., 53, 122–129, 2000.
Pokharia, A. K., Agnihotri, R., Sharma, S., Bajpai, S., Nath, J., Kumaran, R. N., and Negi, B. C.: Altered cropping pattern and cultural continuation with declined prosperity following abrupt and extreme arid event at yrs BP: Evidence from an Indus archaeological site Khirsara, Gujarat, western India, PloS one, 12, e0185684, https://doi.org/10.1371/journal.pone.0185684, 2017.
Ponton, C., Giosan, L., Eglinton, T. I., Fuller, D. Q., Johnson, J. E., Kumar, P., and Collett, T. S.: Holocene aridification of India, Geophys. Res. Lett., 39, L03704, https://doi.org/10.1029/2011GL050722, 2012.
Possehl, G. L.: The transformation of the Indus civilization, J. World Prehist., 11, 425–472, 1997.
Possehl, G. L.: The Indus Civilization: a Contemporary Perspective, Rowman Altamira, Walnut Creek, CA, USA, 2002.
Possehl, G. L.: The Indus Civilization: an introduction to environment, subsistence, and cultural history, Indus ethnobiology, Lexington, Lanham, MD, USA, 1–20, 2003.
Prasad, S. and Enzel, Y.: Holocene paleoclimates of India, Quaternary Res., 66, 442–453, 2006.
Ramasastri, K. S.: Snow melt modeling studies in India, in: The Himalayan Environment, edited by: Dash, S. K. and Bahadur, J., New Age International, New Delhi, India, 59–70, 1999.
Rangachary, N. and Bandyopadhyay, B. K.: An analysis of the synoptic weather pattern associated with extensive avalanching in Western Himalaya, Int. Assoc. Hydrol. Sci. Publ, 162, 311–316, 1987.
Ravelo, A. C. and Hillaire-Marcel, C.: Chapter Eighteen the use of oxygen and carbon isotopes of foraminifera in Paleoceanography, Dev. Mar. Geol., 1, 735–764, 2007.
Ravelo, A. C. and Shackleton, N. J.: Evidence for surface-water circulation changes at Site 851 in the eastern Tropical Pacific Ocean, in: Proceedings of the Ocean Drilling Program, Scientific Results, College Station, TX, USA (Ocean Drilling Program), edited by: Pisias, N. G., Mayer, L. A., Janecek, T. R., Palmer-Julson, A., van Andel, T. H., 138, 503–514, https://doi.org/10.2973/odp.proc.sr.138.126.1995, 1995.
Reimer, P. J., Bard, E., Bayliss, A., Beck, J. W., Blackwell, P. G., Ramsey, C. B., Buck, C. E., Cheng, H., Edwards, R. L., Friedrich, M., Grootes, P. M., Guilderson, T. P., Haflidason, H., Hajdas, I., Hatté, C., Heaton, T. J., Hoffmann, D. L., Hogg, A. G., Hughen, K. A., Kaiser, K. F., Kromer, B., Manning, St.W., Niu, M., Reimer, R. W., Richards, D. A., Scott, E. M., Southon, J. R., Staff, R. A., Turney, C. S. M., and van der Plicht, J.: IntCal13 and Marine13 radiocarbon age calibration curves 0–50,000 years cal BP, Radiocarbon, 55, 1869–1887, 2013.
Rohling, E. J.: Paleosalinity: confidence limits and future applications, Mar. Geol., 163, 1–11, 2000.
Sautter, L. R. and Thunell, R. C.: Seasonal variability in the δ18O and δ13C of planktonic foraminifera from an upwelling environment: sediment trap results from the San Pedro Basin, Southern California Bight, Paleoceanography, 6, 307–334, 1991.
Schneider, U., Becker, A., Finger, P., Meyer-Christoffer, A., Bruno, R., and Ziese, M.: GPCC Full Data Reanalysis Version 7.0 at 0.5∘: Monthly Land-Surface Precipitation from Rain-Gauges built on GTS-based and Historic Data, Deutscher Wetterdienst/Global Precipitation Climatology Centre, Offenbach, Germany, 2015.
Schulz, H., von Rad, U., and Ittekkot, V.: Planktic foraminifera, particle flux and oceanic productivity off Pakistan, NE Arabian Sea: modern analogues and application to the palaeoclimatic record, Geol. Soc. Spec. Publ., 195, 499–516, 2002.
Shackleton, N. J.: Attainment of isotopic equilibrium between ocean water and the benthonic foraminifera genus Uvigerina: isotopic changes in the ocean during the last glacial, Colloques Internationaux du C.N.R.S., Paris, France, 219, 203–209, 1974.
Shenoi, S. S. C., Shankar, D., and Shetye, S. R.: Differences in heat budgets of the near-surface Arabian Sea and Bay of Bengal: Implications for the summer monsoon, J. Geophys. Res.-Oceans, 107, 3052, https://doi.org/10.1029/2000JC000679, 2002.
Singh, G., Wasson, R. J., and Agrawal, D. P.: Vegetational and seasonal climatic changes since the last full glacial in the Thar Desert, northwestern India, Rev. Palaeobot. Palyno., 64, 351–358, 1990.
Sinha, R., Smykatz-Kloss, W., Stüben, D., Harrison, S. P., Berner, Z., and Kramar, U.: Late Quaternary palaeoclimatic reconstruction from the lacustrine sediments of the Sambhar playa core, Thar Desert margin, India, Palaeogeogr. Palaeocl., 233, 252–270, 2006.
Sirocko, F.: Deep-sea sediments of the Arabian Sea: A paleoclimatic record of the southwest-Asian summer monsoon, Geol. Rundsch., 80, 557–566, 1991.
Sonderegger, D. L., Wang, H., Clements, W. H., and Noon, B. R.: Using SiZer to detect thresholds in ecological data, Front. Ecol. Environ., 7, 190–195, 2009.
Staubwasser, M.: Late Holocene drought pattern over West Asia, Climates, Landscapes, and Civilizations, Geophys. Monogr. Ser., 198, 89–96, 2012.
Staubwasser, M. and Weiss, H.: Holocene climate and cultural evolution in late prehistoric–early historic West Asia, Quaternary Res., 66, 372–387, 2006.
Staubwasser, M., Sirocko, F., Grootes, P. M., and Erlenkeuser, H.: South Asian monsoon climate change and radiocarbon in the Arabian Sea during early and middle Holocene, Paleoceanography and Paleoclimatology, 17, 1063, https://doi.org/10.1029/2000PA000608, 2002.
Staubwasser, M., Sirocko, F., Grootes, P. M., and Segl, M.: Climate change at the 4.2 ka BP termination of the Indus valley civilization and Holocene south Asian monsoon variability, Geophys. Res. Lett., 30, 1425, https://doi.org/10.1029/2002GL016822, 2003.
Steinke, S., Mohtadi, M., Groeneveld, J., Lin, L. C., Löwemark, L., Chen, M. T., and Rendle-Bühring, R.: Reconstructing the southern South China Sea upper water column structure since the Last Glacial Maximum: Implications for the East Asian winter monsoon development, Paleoceanography and Paleoclimatology, 25, PA2219, https://doi.org/10.1029/2009PA001850, 2010.
Steph, S., Regenberg, M., Tiedemann, R., Mulitza, S., and Nürnberg, D.: Stable isotopes of planktonic foraminifera from tropical Atlantic/Caribbean core-tops: Implications for reconstructing upper ocean stratification, Mar. Micropaleontol., 71, 1–19, 2009.
Tian, J., Wang, P., Chen, R., and Cheng, X.: Quaternary upper ocean thermal gradient variations in the South China Sea: Implications for east Asian monsoon climate, Paleoceanography, 20, PA4007, https://doi.org/10.1029/2004PA001115, 2005.
Von Rad, U.: Physical oceanography during SONNE cruise SO90, PANGAEA, https://doi.org/10.1594/PANGAEA.805802, 2013.
Von Rad, U., Schulz, H., Khan, A. A., Ansari, M., Berner, U., Čepek, P., Cowie, G., Dietrich, P., Erlenkeuser, H., Geyh, M., Jennerjahn, T., Lückge, A., Marchig, V., Riech, V., Rösch, H., Schäfer, P., Schulte, S., Sirocko, F., and Tahir, M.: Sampling the oxygen minimum zone off Pakistan: glacial-interglacial variations of anoxia and productivity (preliminary results, SONNE 90 cruise), Mar. Geol., 125, 7–19, 1995.
Walker, M. J., Berkelhammer, M., Björck, S., Cwynar, L. C., Fisher, D. A., Long, A. J., Lowe, J. J., Newnham, R. M., Rasmussen, S. O., and Weiss, H.: Formal subdivision of the Holocene Series/Epoch: a Discussion Paper by a Working Group of INTIMATE (Integration of ice-core, marine and terrestrial records) and the Subcommission on Quaternary Stratigraphy (International Commission on Stratigraphy), J. Quaternary Sci., 27, 649–659, 2012.
Walker, M. J., Head, J. H., Berkelhammer, M., Björck, S., Cheng, H., Cwynar, L., Fisher, D., Gkinis, V., Long, A., Lowe, J., Newnham, R., Rasmussen, S. O., and Weiss, H.: Formal ratification of the subdivision of the Holocene Series/Epoch (Quaternary System/Period): two new Global Boundary Stratotype Sections and Points (GSSPs) and three new stages/subseries, Episodes, 41, 213–223, https://doi.org/10.18814/epiiugs/2018/018016, 2018.
Wang, L., Sarnthein, M., Duplessy, J. C., Erlenkeuser, H., Jung, S., and Pflaumann, U.: Paleo sea surface salinities in the low-latitude Atlantic: The δ18O record of Globigerinoides ruber (white), Paleoceanography, 10, 749–761, 1995.
Wanner, H., Beer, J., Bütikofer, J., Crowley, T. J., Cubasch, U., Flückiger, J., Goosse, H., Grosjean, M., Joos, F., Kaplan, J. O., Küttel, M., Müller, S. A., Prentice, C., Solomina, O., Stocker, T. F., Tarasov, P., Wagner, M., and Widmann, M.: Mid-to Late Holocene climate change: an overview, Quaternary Sci. Rev., 27, 1791–1828, 2008.
Weatherall, P., Marks, K., Jakobsson, M., Schmitt, T., Tani, S., Arndt, J. E., Rovere, M., Chayes, D., Ferrini, V., and Wigley, R.: A new digital bathymetric model of the world's oceans, Earth and Space Science, 2, 331–345, 2015.
Weber, S. A.: Seeds of urbanism: palaeoethnobotany and the Indus Civilization, Antiquity, 73, 813–826, 1999.
Weber, S. A.: Archaeobotany at Harappa: Indications for Change, Indus Ethnobiology: New Perspectives from the Field, edited by: Weber, S. and Belcher, B., Lexington Books, Lanham, MD, USA, 175–198, 2003.
Weber, S. A., Barela, T., and Lehman, H.: Ecological continuity: An explanation for agricultural diversity in the Indus Civilization and beyond, Man and Environment, 35, 62–75, 2010.
Weiss, H.: Global megadrought, societal collapse and resilience at 4.2–3.9 ka BP across the Mediterranean and West asia, Clim. Chang. Cult. Evol., PAGES Mag., 24, 62–63, https://doi.org/10.22498/pages.24.2.62, 2016.
Wick, L., Lemcke, G., and Sturm, M.: Evidence of Lateglacial and Holocene climatic change and human impact in eastern Anatolia: high-resolution pollen, charcoal, isotopic and geochemical records from the laminated sediments of Lake Van, Turkey, Holocene, 13, 665–675, 2003.
Wright, R. P.: The ancient Indus: Urbanism, economy and society, Case Studies in Early Societies, Cambridge University Press, Cambridge, UK, 10, 416 pp., 2010.
Yadav, R. K., Kumar, K. R., and Rajeevan, M.: Characteristic features of winter precipitation and its variability over northwest India, J. Earth Syst. Sci., 121, 611–623, 2012.
Yu, W., Yang, Y. C., Savitsky, A., Alford, D., Brown, C., Wescoat, J., Debowicz, D., and Robinson, S.: The Indus basin of Pakistan: The impacts of climate risks on water and agriculture, The World Bank, Washington, D.C., USA, 2013.
Zaric, S.: Planktic foraminiferal flux of sediment trap EAST-86/90_trap, PANGAEA, https://doi.org/10.1594/PANGAEA.264508, 2005.
Zweng, M. M., Reagan, J. R., Antonov, J. I., Locarnini, R. A., Mishonov, A. V., Boyer, T. P., Garcia, H. E., Baranova, O. K., Johnson, D. R., Seidov, D., and Biddle, M. M.: World Ocean Atlas 2013, Volume 2: Salinity, edited by: Levitus, S. and Mishonov, A., NOAA Atlas NESDIS 74, 39 pp., 2013.