the Creative Commons Attribution 4.0 License.
the Creative Commons Attribution 4.0 License.
 | 22 Jan 2020
The effect of mountain uplift on eastern boundary currents and upwelling systems
Matthias Prange
All major mountain ranges are assumed to have been subject to increased uplifting processes during the late Miocene and Pliocene. Previous work has demonstrated that African uplift is an important element to explain Benguela upper-ocean cooling in the late Miocene–Pliocene. According to proxy records, a surface ocean cooling also occurred in other eastern boundary upwelling regions during the late Neogene. Here we investigate a set of sensitivity experiments altering topography in major mountain regions (Andes, North American Cordillera, and southern and East African mountains) separately with regard to the potential impact on the intensity of near-coastal low-level winds, Ekman transport and Ekman pumping, and upper-ocean cooling. The simulations show that mountain uplift is important for upper-ocean temperature evolution in the area of eastern boundary currents. The impact is primarily on the atmospheric circulation which is then acting on upper-ocean temperatures through changes in strengths of upwelling, horizontal heat advection and surface heat fluxes. Different atmosphere–ocean feedbacks additionally alter the sea surface temperature response to uplift. The relative importance of the different feedback mechanisms depends on the region, but it is most likely also influenced by model and model resolution.
- Article
(11695 KB) -
Supplement
(3326 KB) - BibTeX
- EndNote


Eastern boundary upwelling systems (EBUSs) are found off the west coasts of all continents bordering the Atlantic Ocean and Pacific Ocean. These upwelling systems are characterized by high biological activity and the world's richest fishing grounds due to the upwelling of cool subsurface nutrient-rich waters (Garcia-Reyes and Largier, 2012). The upwelling systems also influence climatic patterns of the land region because local sea surface temperature (SST) is strongly linked to rainfall distribution (e.g., Rouault et al., 2003).
Coastal upwelling is mainly occurring as a response to Ekman transport by alongshore winds and due to wind-stress-curl-driven ocean-surface divergence offshore (in this study we refer to both processes as Ekman pumping and define upward pumping, sometimes called “Ekman suction”, to be positive). Strength of upwelling also depends on coastal mountain topography that has an influence on the intensity of coastal low-level jets (Ma et al., 2019). Furthermore, a strong feedback exists between near-coastal winds and SST (Nicholson, 2010; Garcia-Reyes and Largier, 2012), since SST has a strong influence on the wind field through atmospheric boundary layer stability and dynamics. The major eastern boundary currents are formed by equatorward directed winds at the eastern flanks of the subtropical gyres. Due to the presence of the coastline, the associated winds induce an Ekman-driven upwelling near the coast (Chavez and Messie, 2009). Apart from coastal and large-scale winds, also offshore and remote ocean conditions (e.g., the strength and depth of the thermocline) influence upwelling activity (Garcia-Reyes and Largier, 2012). The characteristics of EBUSs are also determined by water column stratification, coastal topography and latitudinal position (i.e., influencing seasonality and through the latitudinal dependence of the Coriolis parameter) (Chavez and Messie, 2009). Additionally, the size of the ocean basin is important, where smaller basins, like the Atlantic, are less influenced by thermocline perturbations than the larger Pacific Ocean (Chavez and Messie, 2009).
Proxy data from all major EBUSs of the world indicate a strengthening of upwelling intensity during the late Neogene (Dekens et al., 2007). The South American continent (Strecker et al., 2007), as well as the North American and African continents, was situated at approximately the same geographic location throughout most of the Neogene (Scotese, 1998), hence an upwelling intensification through continental shifts is not a very likely scenario. Different proxy studies indicate that all major near-coastal mountain ranges showed significant uplift during the period of upwelling intensification (see below). As mountains act by enhancing the land–ocean temperature gradient, mountain uplift has an impact on thermal wind and baroclinity in the atmospheric boundary layer. Therefore, topographic uplift of, especially, the coastal regions might well serve to intensify upwelling in EBUSs, as was demonstrated by Jung et al. (2014) for the Benguela upwelling system.
In the present study we use a coupled ocean–atmosphere general circulation model (GCM) including a dynamic vegetation module. Different model experiments were performed altering topography of eastern and southern Africa, the Andes, and the North American Cordillera separately. In these sensitivity experiments, topography is the only boundary condition that is altered. Therefore this study aims at understanding the role of continental-scale topography uplift in Neogene upwelling intensification in three major eastern boundary upwelling systems. Since these experiments are sensitivity experiments, altering one boundary condition at a time, the major goal is to gain process understanding, and we do not aim at representing a specific time in Earth's history. We compare the responses of (1) the Humboldt Current and upwelling system to Andean uplift, (2) the California upwelling system to an uplift of the North American Cordillera, and (3) the Benguela upwelling system to African uplift (as discussed in Jung et al., 2014).
2.1 Modern eastern boundary upwelling systems
The Benguela upwelling system is confined by the Angola–Benguela front to the north and by the Agulhas Current to the south. The upwelling cell at Lüderitz persists all year, whereas north of Lüderitz the main upwelling season is in austral winter and south of Lüderitz in austral summer (Hutchings et al., 2009). The main zone of year-round upwelling reaches from ∼15 to ∼30∘ S (Chavez and Messie, 2009), and the most important driver of Benguela upwelling is the wind stress of the low-level Benguela Jet (Nicholson, 2010).
The California upwelling region contains several upwelling regimes and extends from the North Pacific Current to off Mexico. The zone of strongest upwelling lies between ∼34 and ∼44∘ N (Chavez and Messie, 2009). It is forced by the North Pacific High, which is especially strong during boreal summer season. California upwelling is characterized by a strong seasonality with the main upwelling season occurring from April to June with strong upwelling-favorable winds of the low-level jet (Garcia-Reyes and Largier, 2012). The formation and dynamics of the coastal jet along the California coast has extensively been studied (e.g., Holt, 1996; Doyle, 1997; Burk and Thompson, 1996; Parish, 2000). In winter the Aleutian Low is dominantly strong, leading to winds directed to the north and hence favoring downwelling in most of the area. Only south of about Cape Mendicino there is a year-round, but weak, upwelling zone (Checkley and Barth, 2009).
The EBUS of the South Pacific Ocean in the region of the Humboldt Current (also called the Peru Current) is referred to as the Humboldt (or Peru–Chile) upwelling system. Coastal upwelling is quasi-permanent off Peru and northern Chile, but it shows a strong seasonality south of 30∘ S with maximum upwelling-favorable winds in austral summer (Montecino and Lange, 2009). Only Peru upwelling shows a year-round activity between ∼4 to ∼16∘ S (Chavez and Messie, 2009), but it is periodically disrupted by the El Niño–Southern Oscillation (ENSO). The characteristics of the upwelling system are set by wind strength related to the South Pacific anticyclone and the effects of coastal topography on the alongshore wind. The coastal jet off Chile at the eastern flank of the South Pacific anticyclone (Garreaud and Munoz, 2005; Munoz and Garreaud, 2005) also plays an important role in the feedback mechanism regarding SST conditions and upwelling activity (Renault et al., 2009).
2.2 Global upwelling intensification during the Neogene
Paleoclimatological proxy records off the western coasts of the continents indicate a cooling for all EBUSs at least since the Pliocene. The strongest cooling is found for the Benguela (−9.3 ∘C) and Californian (−8.8 ∘C) upwelling systems, whereas a weaker cooling (−2.9 ∘C) is found for the Humboldt (Peru and Chile) upwelling region (Dekens et al., 2007).
Benguela upwelling is suggested to have initiated and successively intensified since ∼14 Ma (Rommerskirchen et al., 2011; Marlow et al., 2000). The Miocene initiation of Benguela upwelling is also assumed to be related to a northward migration of the Angola–Benguela front (Bergh et al., 2018). This is also evident in vegetation changes that indicate an aridification of the adjacent land of southern Africa (Hoetzel et al., 2015; Dupont et al., 2013).
The Humboldt Current, as well as the Humboldt upwelling system, is suggested to have been active since the early Cenozoic (Keller et al., 1997). Also, aridity in the Atacama desert already existed prior to the Miocene–Pliocene (Clarke, 2006). Nevertheless, aridity in the southern Central Andes is a function of the latitudinal position of the cold upwelling zone along the Chilean coast (Strecker et al., 2007) and hence is influenced by upwelling intensity. According to proxy records the Peru upwelling system showed a gradual cooling since about 4 Ma (Dekens et al., 2007), whereas the California upwelling system intensification began in the early mid-Miocene (White et al., 1992).
All major mountain areas of the world were subject to uplift in the late Neogene. The related processes are likely connected to the activity of two superplumes (Potter and Szatmari, 2009). But studies on the timings of uplift and estimates of uplift rates are rarely in consensus and paleoaltimetry based on stable-isotope methods might overestimate rapid uplift, as has been demonstrated in a study for the Andes by Ehlers and Poulsen (2009). Hence the uplift histories of the world's major mountain ranges are still a matter of debate.
3.1 Africa
The southern African and East African plateaus belong to the African superswell (Nyblade and Robinson, 1994). This topographic anomaly is considered to have developed since the early Miocene (Seranne and Anka, 2005), and it was subject to strong tectonic uplift during the past 30 Myr with a maximum rate in the late Pliocene and early Pleistocene (Moucha and Forte, 2011; Pik, 2011). For southern Africa, proxy evidence suggests that most of the landscape has been formed during the Neogene, with regional differences ranging from an initiation of uplift in the Namibian region around 30 Ma to more recent uplift intensifications of 10 Ma for the South African swell and the Bié Plateau (Roberts and White, 2010). East African uplift can also be attributed to the uplift of rift shoulders that are superimposed on the swell due to volcanism and rifting. Recently, evidence for a rather synchronous beginning of uplift of the eastern and western parts of East Africa around 25 Ma was found (Roberts et al., 2012), in contrast to a later uplift of the western part around 5 Ma as previously assumed (Sepulchre et al., 2006). High paleotopography was supposed to have existed in Kenya by at least 13.5 Ma (Wichura et al., 2010), but the remains of a whale found in Kenya well above present-day sea level, dating back to the mid-Miocene, constrains the start of the East African Plateau uplift to between 17 and 13.5 Ma (Wichura et al., 2015).
3.2 Andes
Late Miocene climatic changes in the southern Central Andes, with increasingly humid conditions east of the Puna, and the development of hyperarid conditions at the western flanks of the southern Central Andes is in contrast to the expected aridity due to late-Miocene global cooling and hence points to a tectonic origin (Strecker et al., 2007). The precordillera in the southern Atacama Desert is suggested to have attained an elevation of at least 3000 m already in the early Oligocene, prior to the uplift of the Altiplano (Bissig and Riquelme, 2010). A recent study of pollen records from western equatorial South America indicated that the Central Andes were already at a reasonable height for blocking air flow and influencing precipitation patterns by the middle Miocene (Grimmer et al., 2018). Most of the Andean uplift is supposed to have occurred during the middle and late Miocene (Potter and Szatmari, 2009). It is suggested that exhumation in the Central Andes moved eastward, beginning in the eastern cordillera at ∼50–15 Ma, reaching about 75 % of present-day elevation in the Bolivian Andes at ∼15–11 Ma (Barnes et al., 2012). In the Central Altiplano rapid uplift pulses, that occurred earlier in the southern and later in the northern region, were found to be related to lower lithosphere removal after long-term thickening (Garzione, 2008; Garzione et al., 2014; Leier et al., 2013). Uplift was estimated as 2.5 to 3.5 km between about 10 and 6 Ma (Garzione et al., 2006; Ghosh et al., 2006).
According to Gregory-Wodzicki (2000), the Central Andean Cordillera reached about a third of its present altitude at 20 Ma and about 50 % of present elevation by 10.7 Ma, implying a magnitude of uplift of around 2300–3400 m since the late Miocene. For the Colombian Andes, rapid uplift between 2 and 5 Ma was suggested (Gregory-Wodzicki, 2000). These timings of uplift of the Central Andes are in agreement with a recorded change in South American seasonality indicating a southward deflection of the South American low-level jet at around 8–9 Ma (Mulch et al., 2010) and with the onset of humid conditions on the eastern side of the southern Central Andes in the late Miocene (Strecker et al., 2007). Miocene surface uplift is also documented for the southern Patagonian Andes (Blisniuk et al., 2005). Uplift of the Bolivian Altiplano was estimated as 2.5 to 3.5 km between about 10 and 6 Ma (Ghosh et al., 2006; Garzione et al., 2006).
3.3 North American Cordillera
The North American Cordillera comprises different mountain and plateau areas as the Sierra Nevada, the Rocky Mountains, the High Plains and the Colorado Plateau. These also have distinct uplift histories with high levels of uncertainty. Parts of the North American Cordillera were already at a high elevation since the early Cenozoic (Foster et al., 2010, and references therein). Nevertheless major uplift events also took place from the middle Miocene onwards. Uplift in the Rocky Mountains initiated in the middle Miocene, whereas the northern coastal mountains of Canada show a steady rise since 10 Ma (Potter and Szatmari, 2009). The coastal ranges of central and southern California are still rising. They were subject to deformation in the late Miocene, as well as to folding and uplift that initiated around 3.5 Ma (Page et al., 1999; Montgomery, 1993).
4.1 Model description
The model simulations were performed with the National Center for Atmospheric Research (NCAR) Community Climate System Model Version 3 (CCSM3) (Collins et al., 2006). The model is run in a fully coupled mode, including the four components atmosphere, land, ocean and sea ice. The atmospheric component (CAM3) and the land surface model (CLM3) are run at a horizontal resolution of ∼1.4∘ (T85); the atmosphere is discretized with 26 vertical layers. The ocean (POP) and sea-ice models (CSIM) are run with a variable grid resolution of 1.125∘ in zonal direction and roughly 0.5∘ in meridional direction, with a refinement down to 0.3∘ towards the Equator. The ocean model uses 40 levels in the vertical and employs Gent and Mcwilliams (1990) isopycnal mixing for tracers using the skew-flux form (Griffies, 1998). The vertical mixing coefficients are determined using the nonlocal K-profile parameterization (KPP) scheme by Large et al. (1994). Therefore, surface forcing, including the surface friction velocity which is a function of wind stress, has a direct effect on vertical mixing coefficients. For further details on the ocean model physics, the reader is referred to Danabasoglu et al. (2006). The land model includes a dynamical global vegetation model (DGVM) (Bonan et al., 2003; Levis et al., 2004) and improved parameterizations for canopy interception and soil evaporation (Oleson et al., 2008; Handiani et al., 2013; Rachmayani et al., 2015). This enables not only the direct simulation of vegetation coverage response to climatic conditions but also the consideration of biogeophysical feedbacks between climate and vegetation. Clouds are, in CCSM3, implemented as convective or stratiform clouds at three levels (low, middle, high) using different parameterizations dependent on shallow or deep convection. Cloud water is present as ice and liquid, dependent on temperature, explicitly accounting for cloud ice and solid precipitate (Vavrus and Waliser, 2008, and references therein).
4.2 Experimental design
Five model runs were performed. A control simulation (CTRL), as in Jung et al. (2014) which is also described in detail further down, was run using present-day topography. Three sensitivity studies were performed that are identical to CTRL, except that topography was lowered to 50 % of the present-day altitude for eastern and southern Africa (AF), for the Andes (AND), and for the North American Cordillera (NA) (Fig. 1). Additionally, a pure preindustrial simulation (PI) was performed for model evaluation purposes.
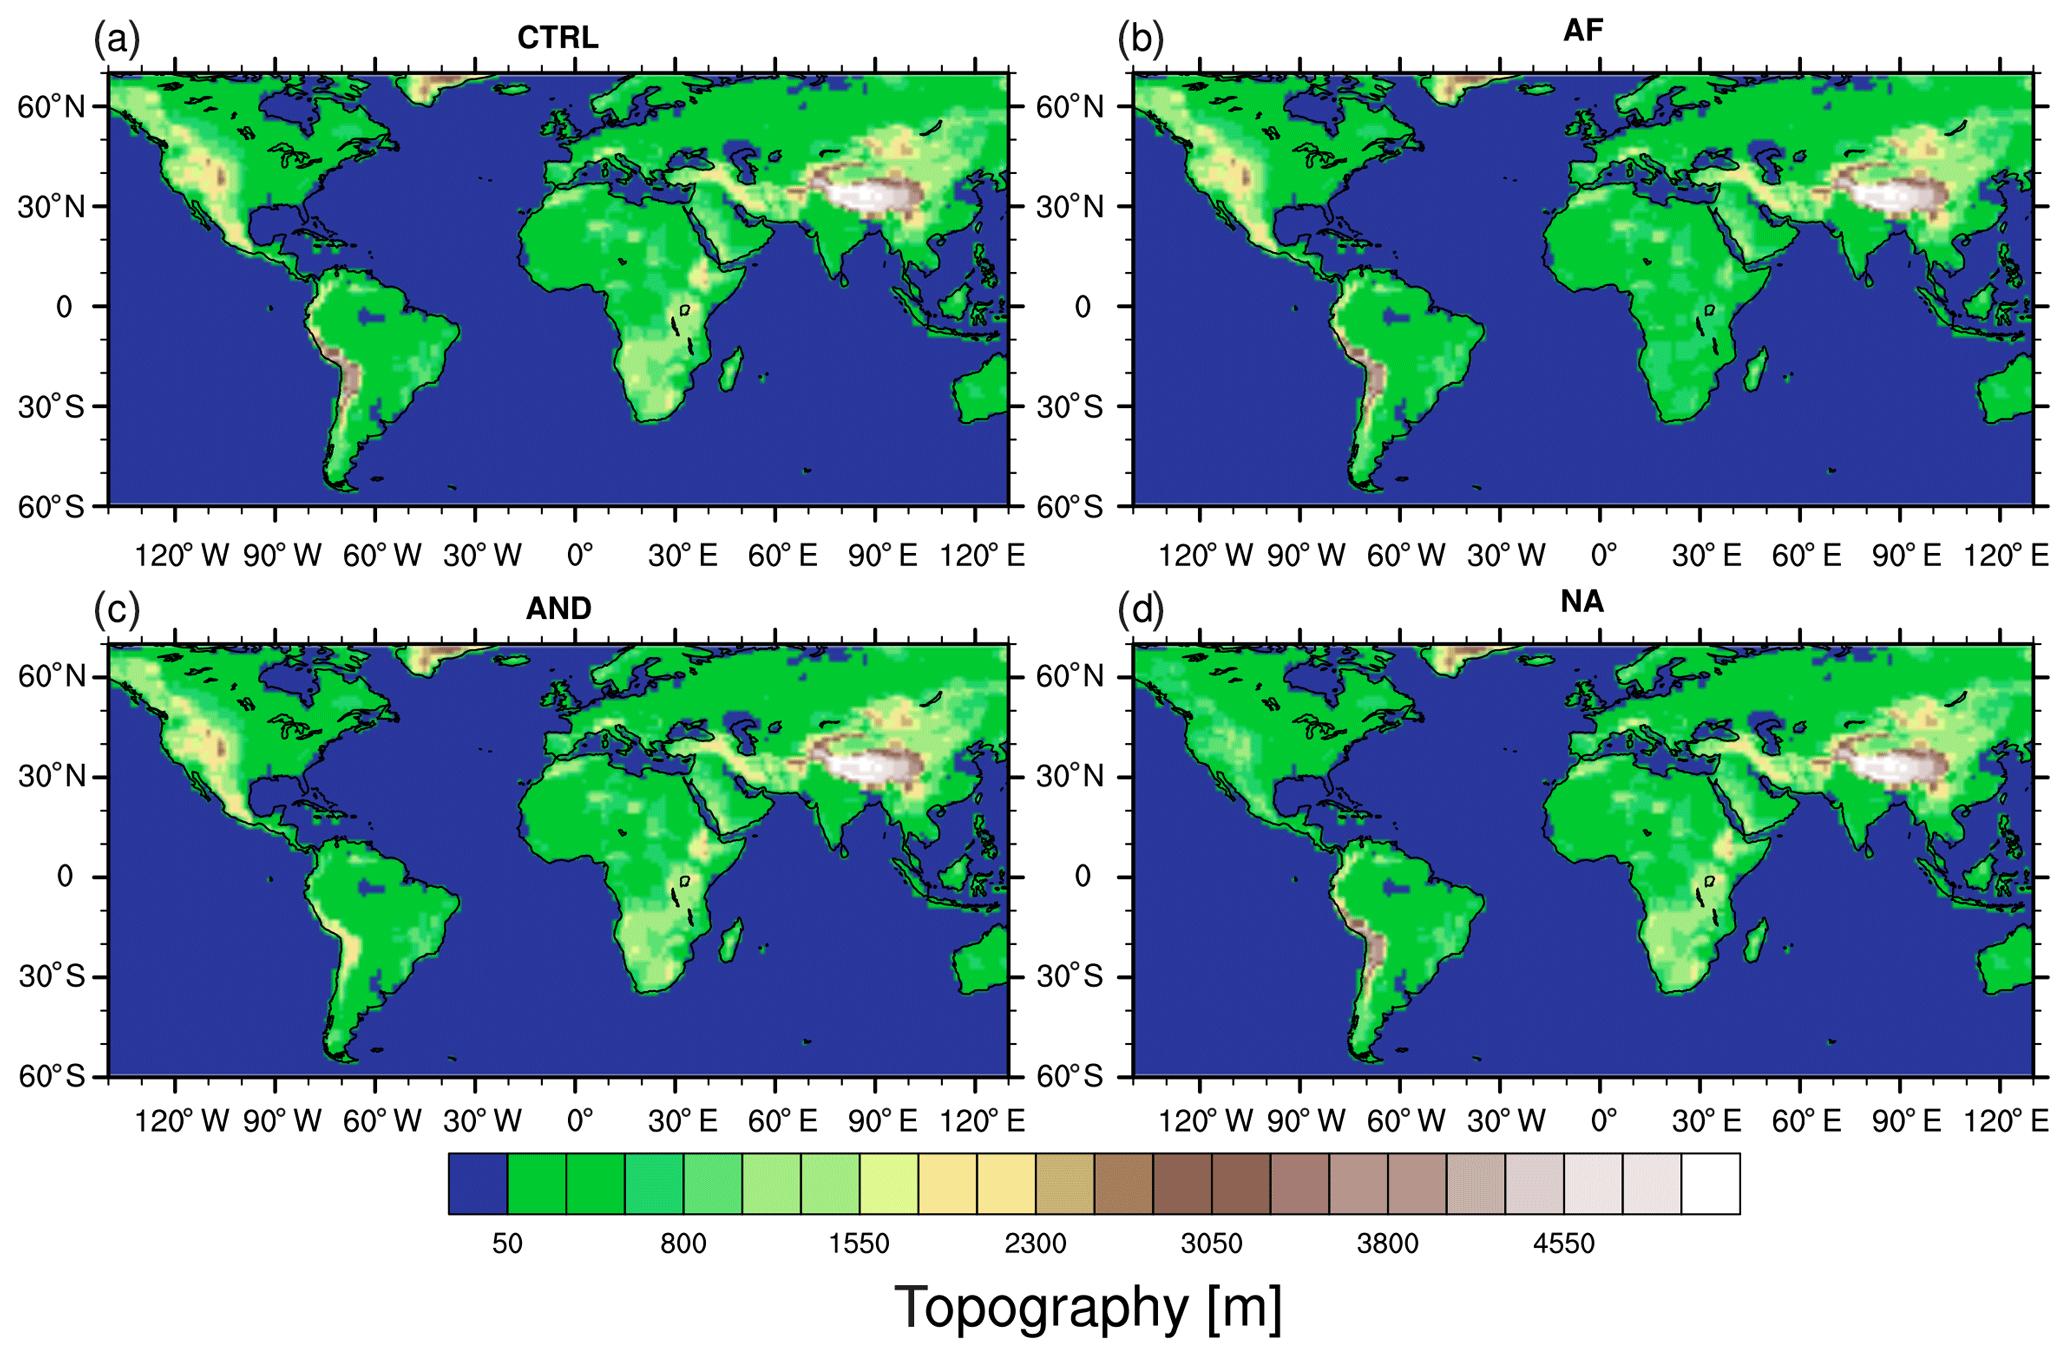
Figure 1Model topographies of the different experiments: present-day topography (CTRL) (a), southern and East African topography 50 % of CTRL (AF) (b), Andean topography 50 % of CTRL (AND) (c) and North American Cordilleran topography 50 % of CTRL (NA) (d).
The boundary conditions for the preindustrial simulation (PI) followed the PMIP2 setup (Braconnot et al., 2007). The simulation that serves as a control run in the performed sensitivity experiments (CTRL) has, similarly, present-day boundary conditions with respect to geography, topography and preindustrial boundary conditions with respect to greenhouse gases, ozone concentrations, sulfate and carbonaceous aerosols (Braconnot et al., 2007), but it differs from the pure preindustrial setting in aerosols, soil texture and color, and in orbital conditions. Assuming predesert conditions, the effect of dust aerosols on radiative transfer was set to zero, and soil texture and color were adapted to represent loam in the Sahara. To avoid extreme insolation forcing, the orbital parameters were set to represent average values over a period of 2–10 Myr with an eccentricity of 0.027 and an obliquity of 23.25∘. The perihelion was set to autumn (359.47∘). In comparison to PI, our control simulation is characterized by stronger insolation in the northern Hemisphere in summer and weaker insolation during winter, which leads to an increase in seasonality, which is most pronounced in the Northern Hemisphere. The control run and the preindustrial run were both started from a spun-up preindustrial simulation of 500 years obtained from NCAR and run for another 300 (PI) or 600 (CTRL) years. The sensitivity experiments were branched off from the control run at year 301 and run for another 300 years. It was demonstrated by Jung et al. (2014, Supplement) that the spinup period was sufficient to get the upper ocean in equilibrium. Also the vegetation cover was in equilibrium after the spinup.
All model outputs shown in the following section are averages over a period of 100 years. Differences in the model results section are defined, indicating the anomaly of the control simulation (present-day topography) with respect to the experiment with lowered topography (CTRL minus AF, CTRL minus AND, and CTRL minus NA, respectively). Hence the presented results show the simulated response of the variables to mountain uplift.
5.1 Evaluation of upwelling velocities
For an evaluation of the models' representation of upwelling activity, in the following, the vertical oceanic velocities of all regions are compared to observations, or high-resolution modeling results, regarding seasonality and magnitude. Therefore we evaluate the pure preindustrial simulation (PI) which hence differs from the control run (CTRL) especially in the orbital configuration, whereas model geography and topography are identical. Qualitatively, the CTRL run outputs are similar to the PI results illustrated in the following in terms of upwelling velocities and seasonalities (see the Supplement for a comparison between PI, CTRL and Carton–Giese SODA 2.2.4 reanalysis).
In Jung et al. (2014) it was discussed, based on a comparison between our control run (CTRL) and observations and high-resolutions modeling results, that upwelling location and seasonality are correctly simulated for the Benguela region, but the magnitude of upwelling velocity is underestimated. The same holds true if we consider a run with present-day topography and strictly preindustrial boundary conditions (Fig. 2). High-resolution model simulations (e.g., Tim et al., 2015; Veitch et al., 2010) indicate that the location of the main upwelling zones, as well as their seasonality, is captured by CCSM3. We also find a northern and a southern upwelling area with main upwelling in boreal summer and autumn to winter, respectively. In between, in the central Benguela region, we find a region of reduced seasonality. But comparison to these high-resolution simulations also shows that the upwelling velocities are generally underestimated by almost 1 order of magnitude.
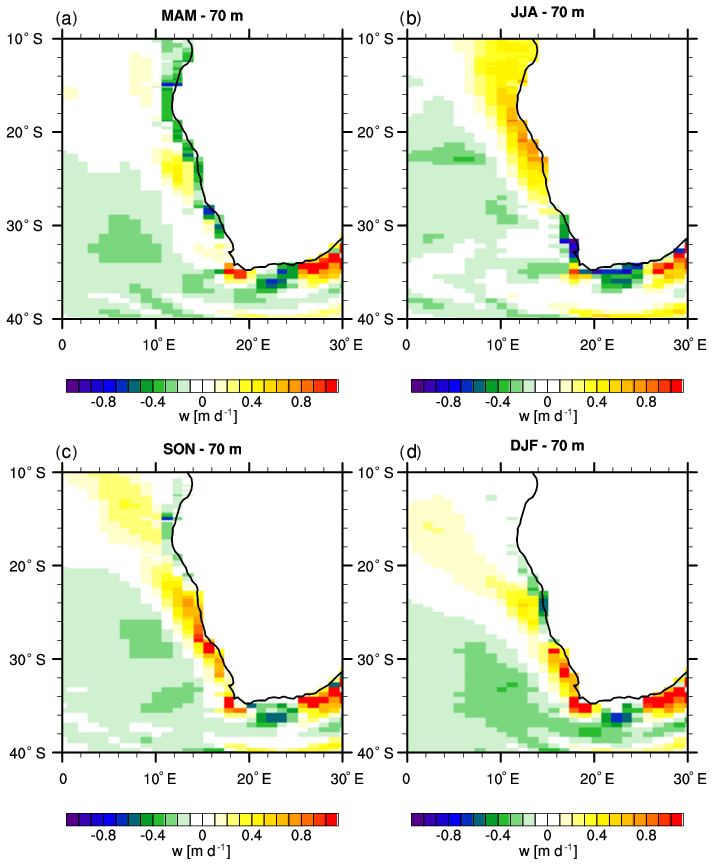
Figure 2Seasonal mean vertical velocity (m d−1) at a depth of 70 m in a preindustrial simulation (PI) for MAM (a), JJA (b), SON (c) and DJF (d). Positive (negative) values denote upward (downward) motion.
For the California upwelling region (Fig. 3), the position of the main upwelling zone matches well with the observations (34–44∘ N; Chavez and Messie, 2009). As in Chavez and Messie (2009), upwelling does not occur all year round, but only from spring to summer. In Southern California, where upwelling is weaker, upwelling velocities range from a maximum of 2.5±1.3 m d−1 in May to a minimum of 0.5±0.6 m d−1 in January (Haskell et al., 2015a). Peak summer vertical velocities of about 10 m d−1 were estimated for central California upwelling by Pickett and Paduan (2003). Hence, with values mostly below 1 m d−1, upwelling velocities in the CCSM3 simulations are underestimated despite showing the correct seasonality.
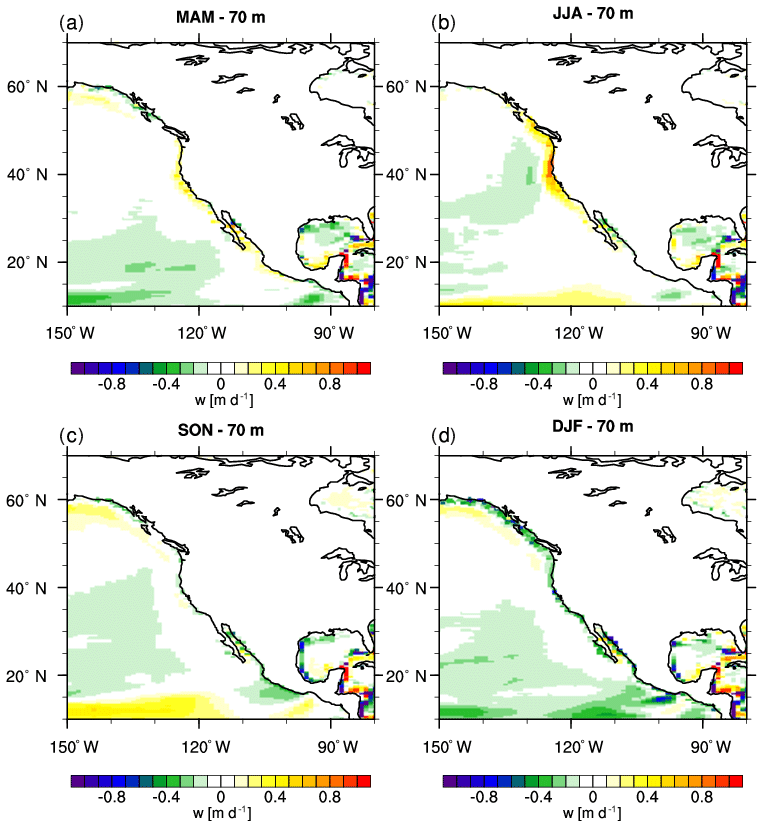
Figure 3Seasonal mean vertical velocity (m d−1) at a depth of 70 m in a preindustrial simulation (PI) for MAM (a), JJA (b), SON (c) and DJF (d). Positive (negative) values denote upward (downward) motion.
Regarding the Humboldt upwelling region, a comparison of our model results (Fig. 4) to higher-resolved model results by Belmadani et al. (2014), using a GCM of variable resolution down to 0.5∘ over the region of interest, shows reasonably good agreement. Based on observations, upwelling velocities of the eastern tropical South Pacific range from ∼0.0 to 1.1 m d−1, depending on location and season (Haskell et al., 2015b). Therefore our model results compare well with ∼0.5 m d−1 (up to 0.8 m d−1 during JJA in the Peru upwelling region).
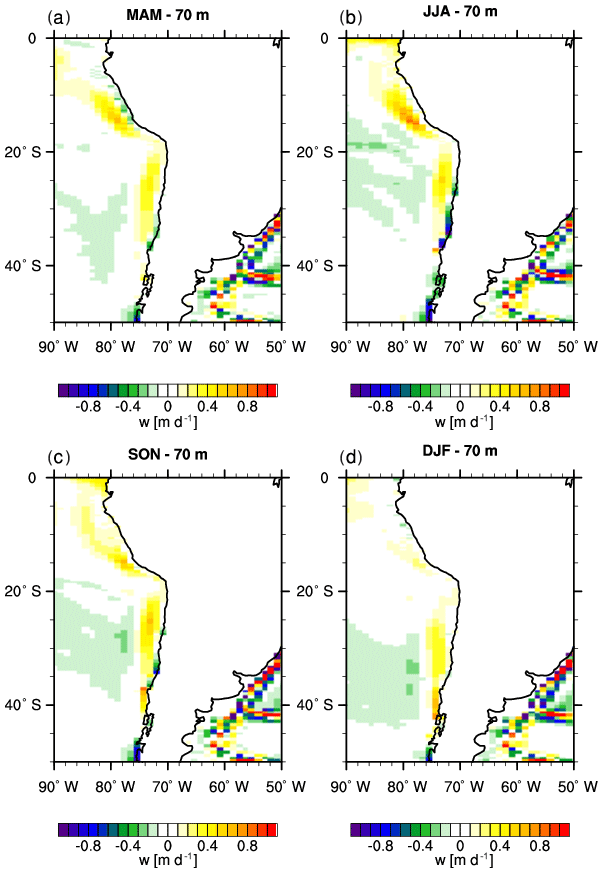
Figure 4Seasonal mean vertical velocity (m d−1) at a depth of 70 m in a preindustrial simulation (PI) for MAM (a), JJA (b), SON (c) and DJF (d). Positive (negative) values denote upward (downward) motion.
Figures S1–S3 in the Supplement show seasonal averages of the vertical oceanic velocities of the Carton–Giese SODA 2.2.4 reanalysis data (Carton et al., 2018) for the different upwelling regions. In general the seasonalities are similar to our model results, even though the magnitude of upwelling intensity in our runs is underestimated. In the Benguela region, the seasonality is lower in the SODA data than in the CCSM3 experiments, where upwelling is almost absent in boreal spring.
It was discussed by Small et al. (2015) that a resolution of about 0.5∘ and an adjustment to observational data in the coastal zone in the atmospheric model, together with a high-resolution eddy-resolving model, would be needed to receive a realistic representation of upwelling for the Benguela region. Ma et al. (2019) also showed that a higher-resolution atmospheric component in the coupled model CESM (of ∼0.5∘) leads to a better representation of oceanic upwelling due to a more realistic representation of the low-level coastal jet. Therefore one has to keep in mind that the effects on upwelling dynamics and feedbacks simulated in this study are likely to be underestimated, as is the general upwelling signal. Even though upwelling is underestimated in all areas, representation of upwelling is sufficient in the chosen model resolution to draw some conclusions regarding the posed scientific question. Without going into too much detail, since the focus of the study is on eastern boundary upwelling systems, additional confidence stems from the fact that CCSM3 in the used setup and resolution is also able to reproduce upwelling and its seasonalities in other upwelling areas, e.g., in the Caribbean (Rueda-Roa and Muller-Karger, 2013; Andrade and Barton, 2005; Montoya-Sanchez et al., 2018), and in the south Brazilian (Palma and Matano, 2009) coastal areas.
5.2 Response to mountain uplift
5.2.1 Surface wind and Ekman pumping
For the Benguela region (Fig. 5), as well as for the California upwelling region (Fig. 6), a clear intensification of low-level winds and Ekman pumping velocities is simulated in our experiments upon uplift.
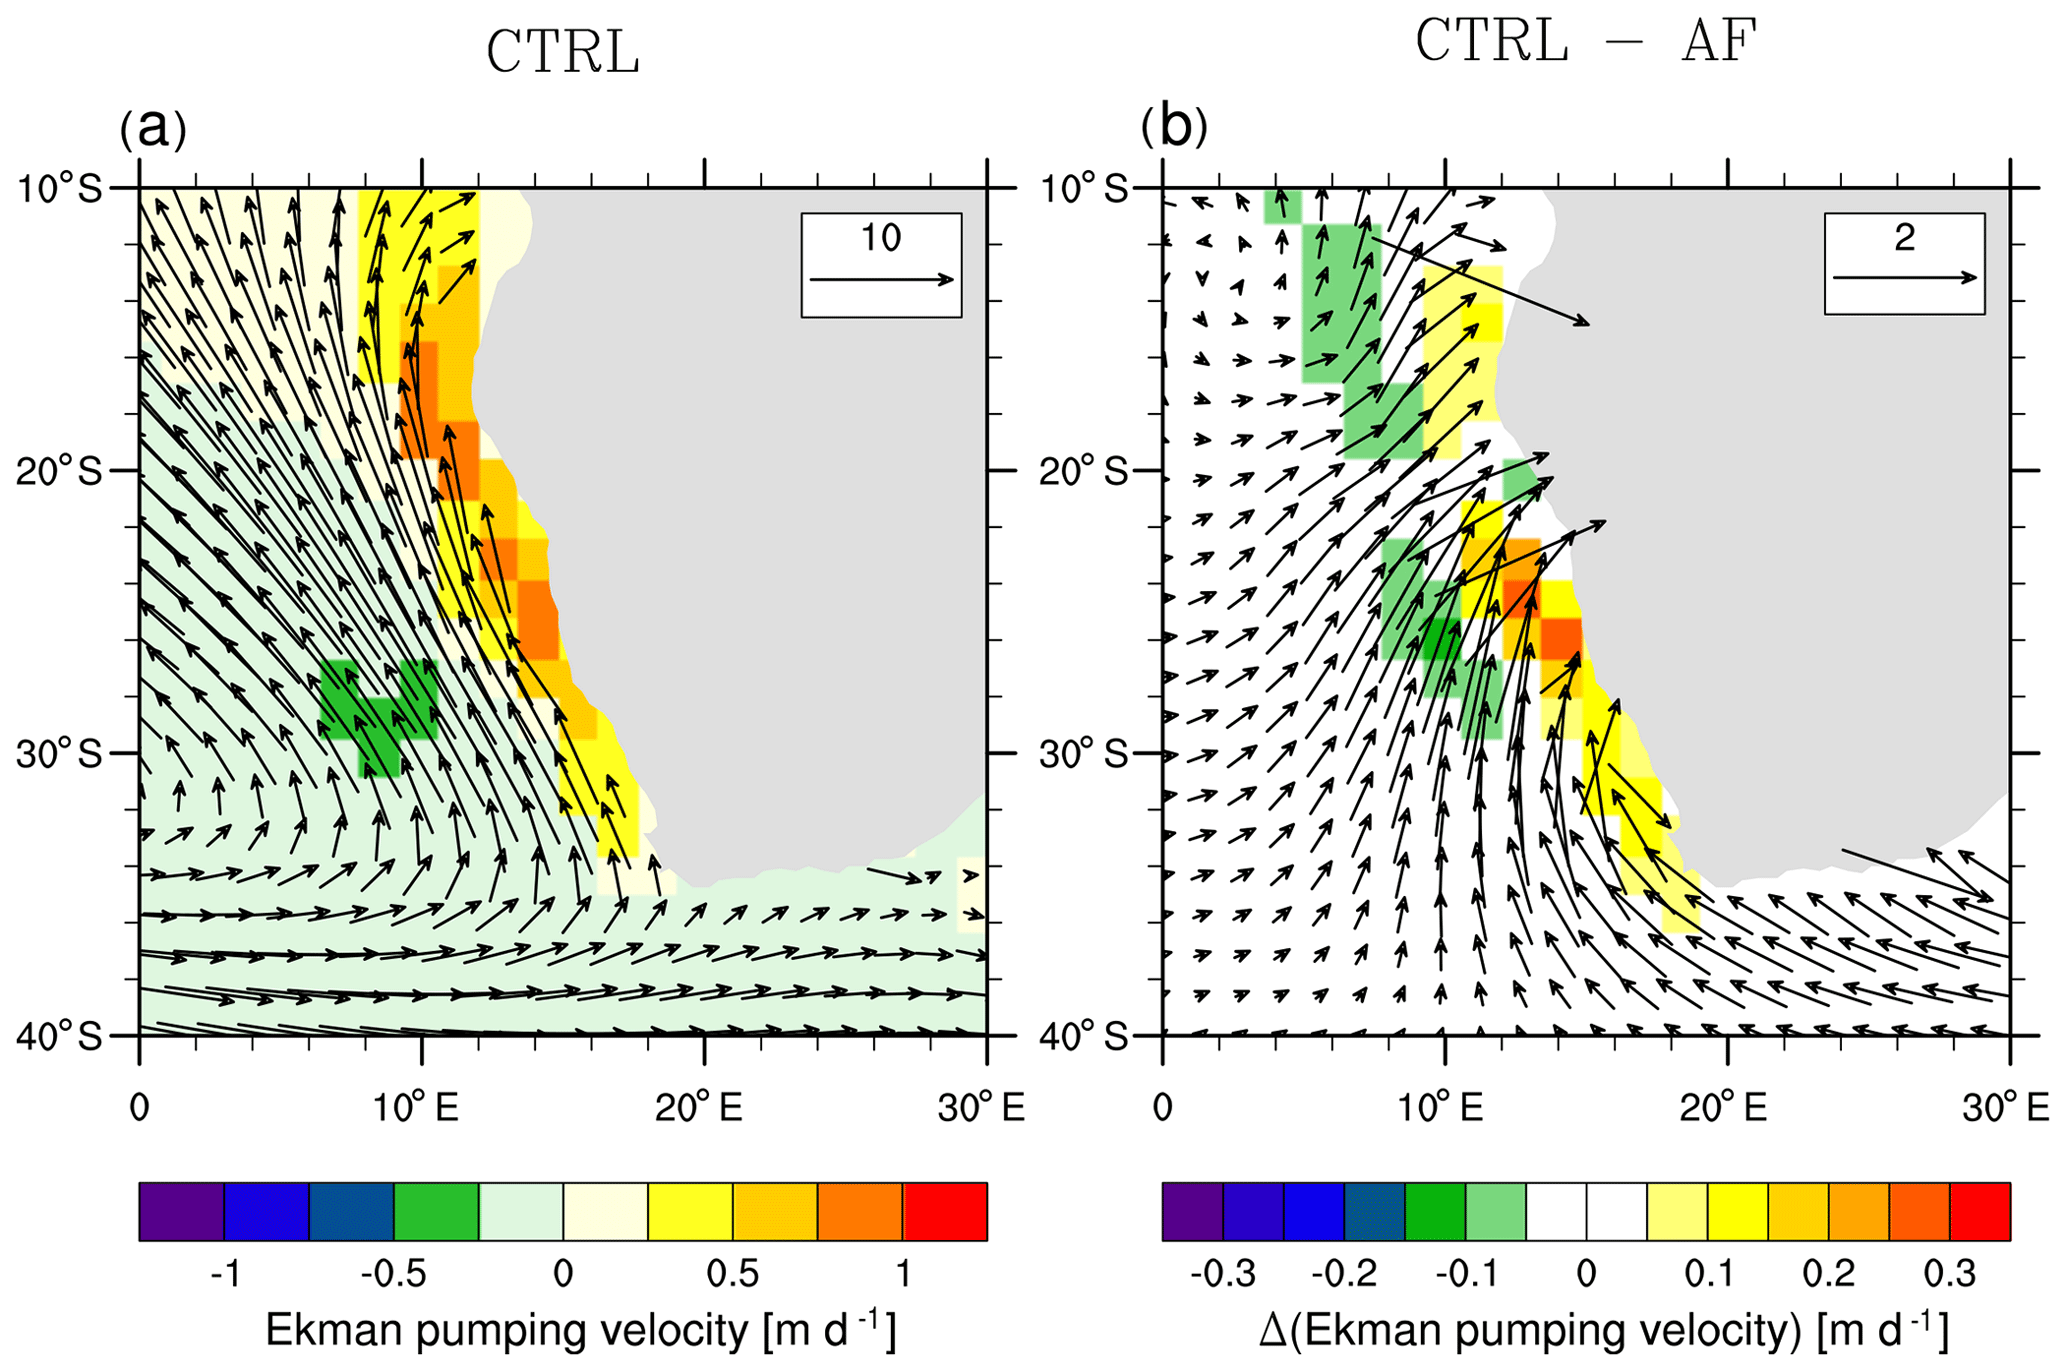
Figure 5Annual mean surface wind (arrows) (m s−1) and Ekman pumping velocity (m d−1) (shading) for CTRL (a) and response to African mountain uplift (CTRL – AF) (b). Positive Ekman pumping velocities imply upwelling.
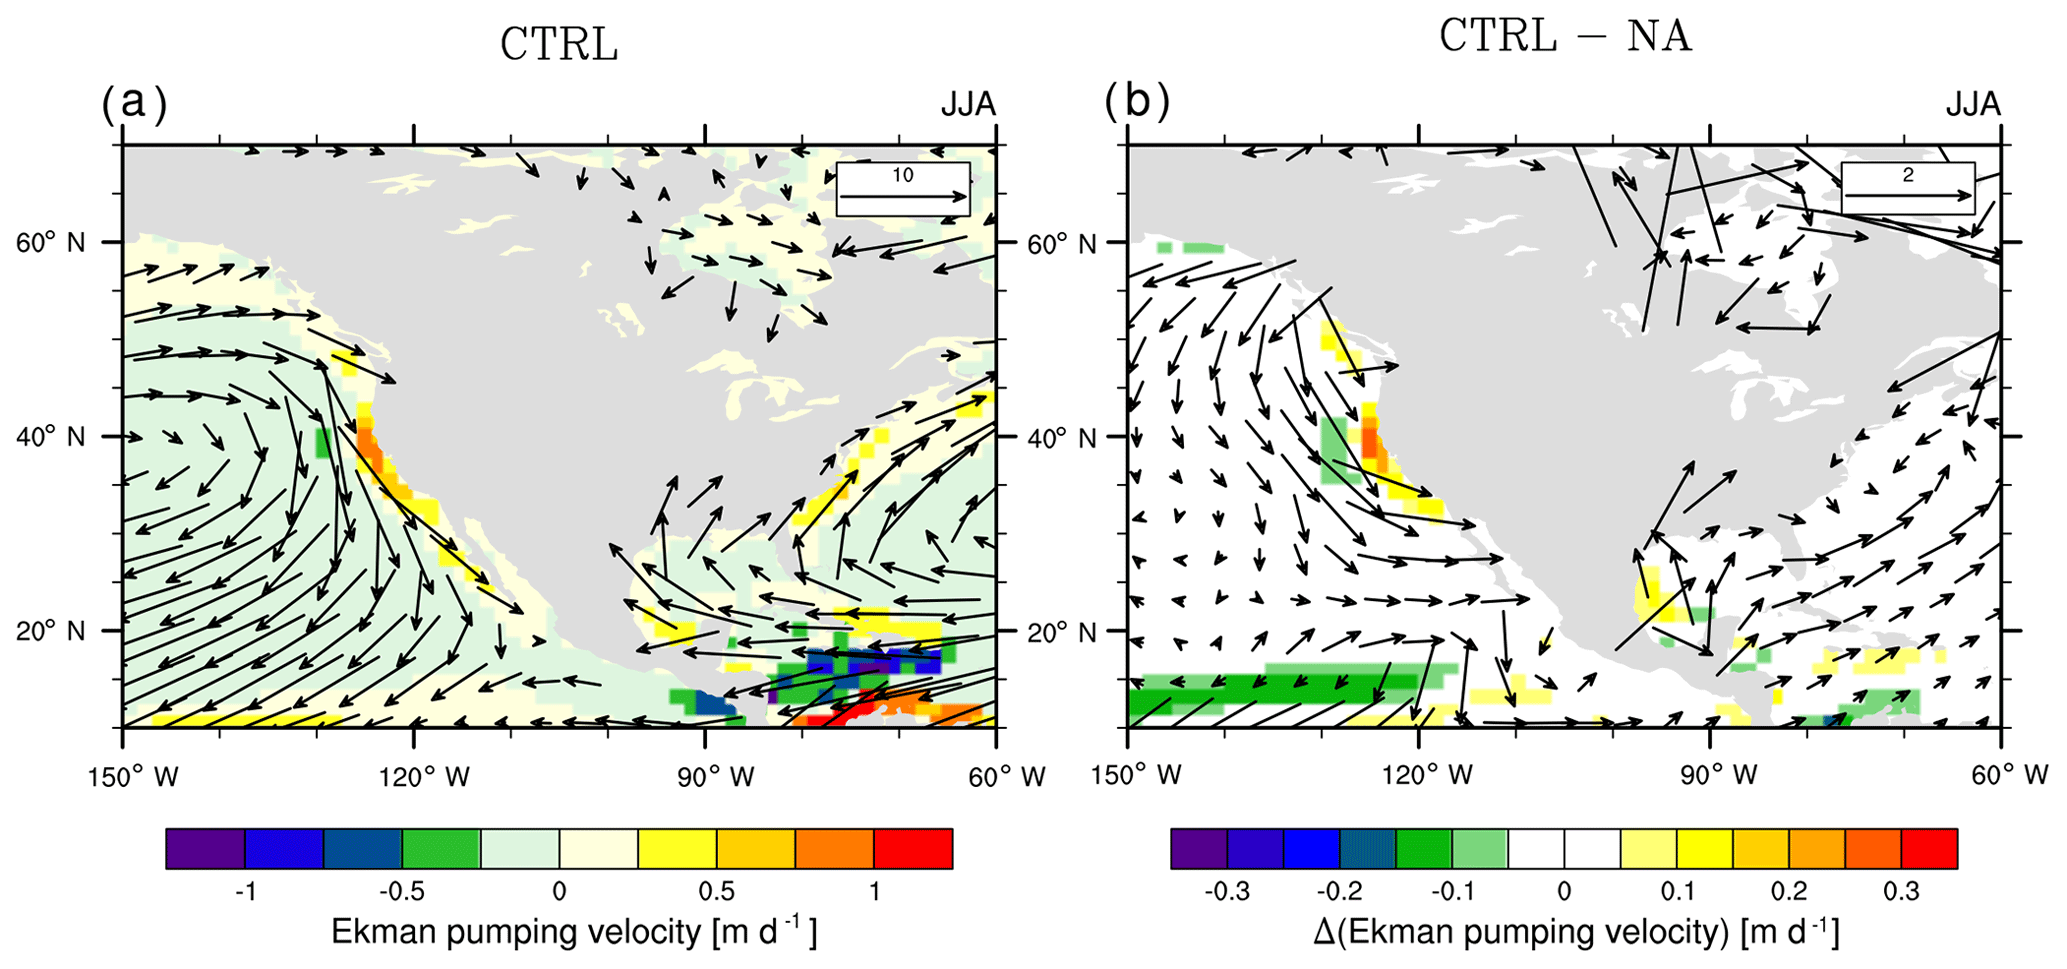
Figure 6Seasonal mean surface wind (arrows) (m s−1) and Ekman pumping velocity (m d−1) (shading) for CTRL (a) and response to North American mountain uplift (CTRL – NA) (b), both for the summer season (JJA).
For the Benguela region, Ekman pumping is already relatively strong with lower mountains and further increases by about 60 %. For the California upwelling region, the average simulated Ekman pumping intensity is rather weak with low mountains and increases by up to 100 % with mountain uplift. Here we illustrate only the summer season for the California upwelling region since most intense upwelling activity is found in that season and upwelling is almost absent in autumn and winter.
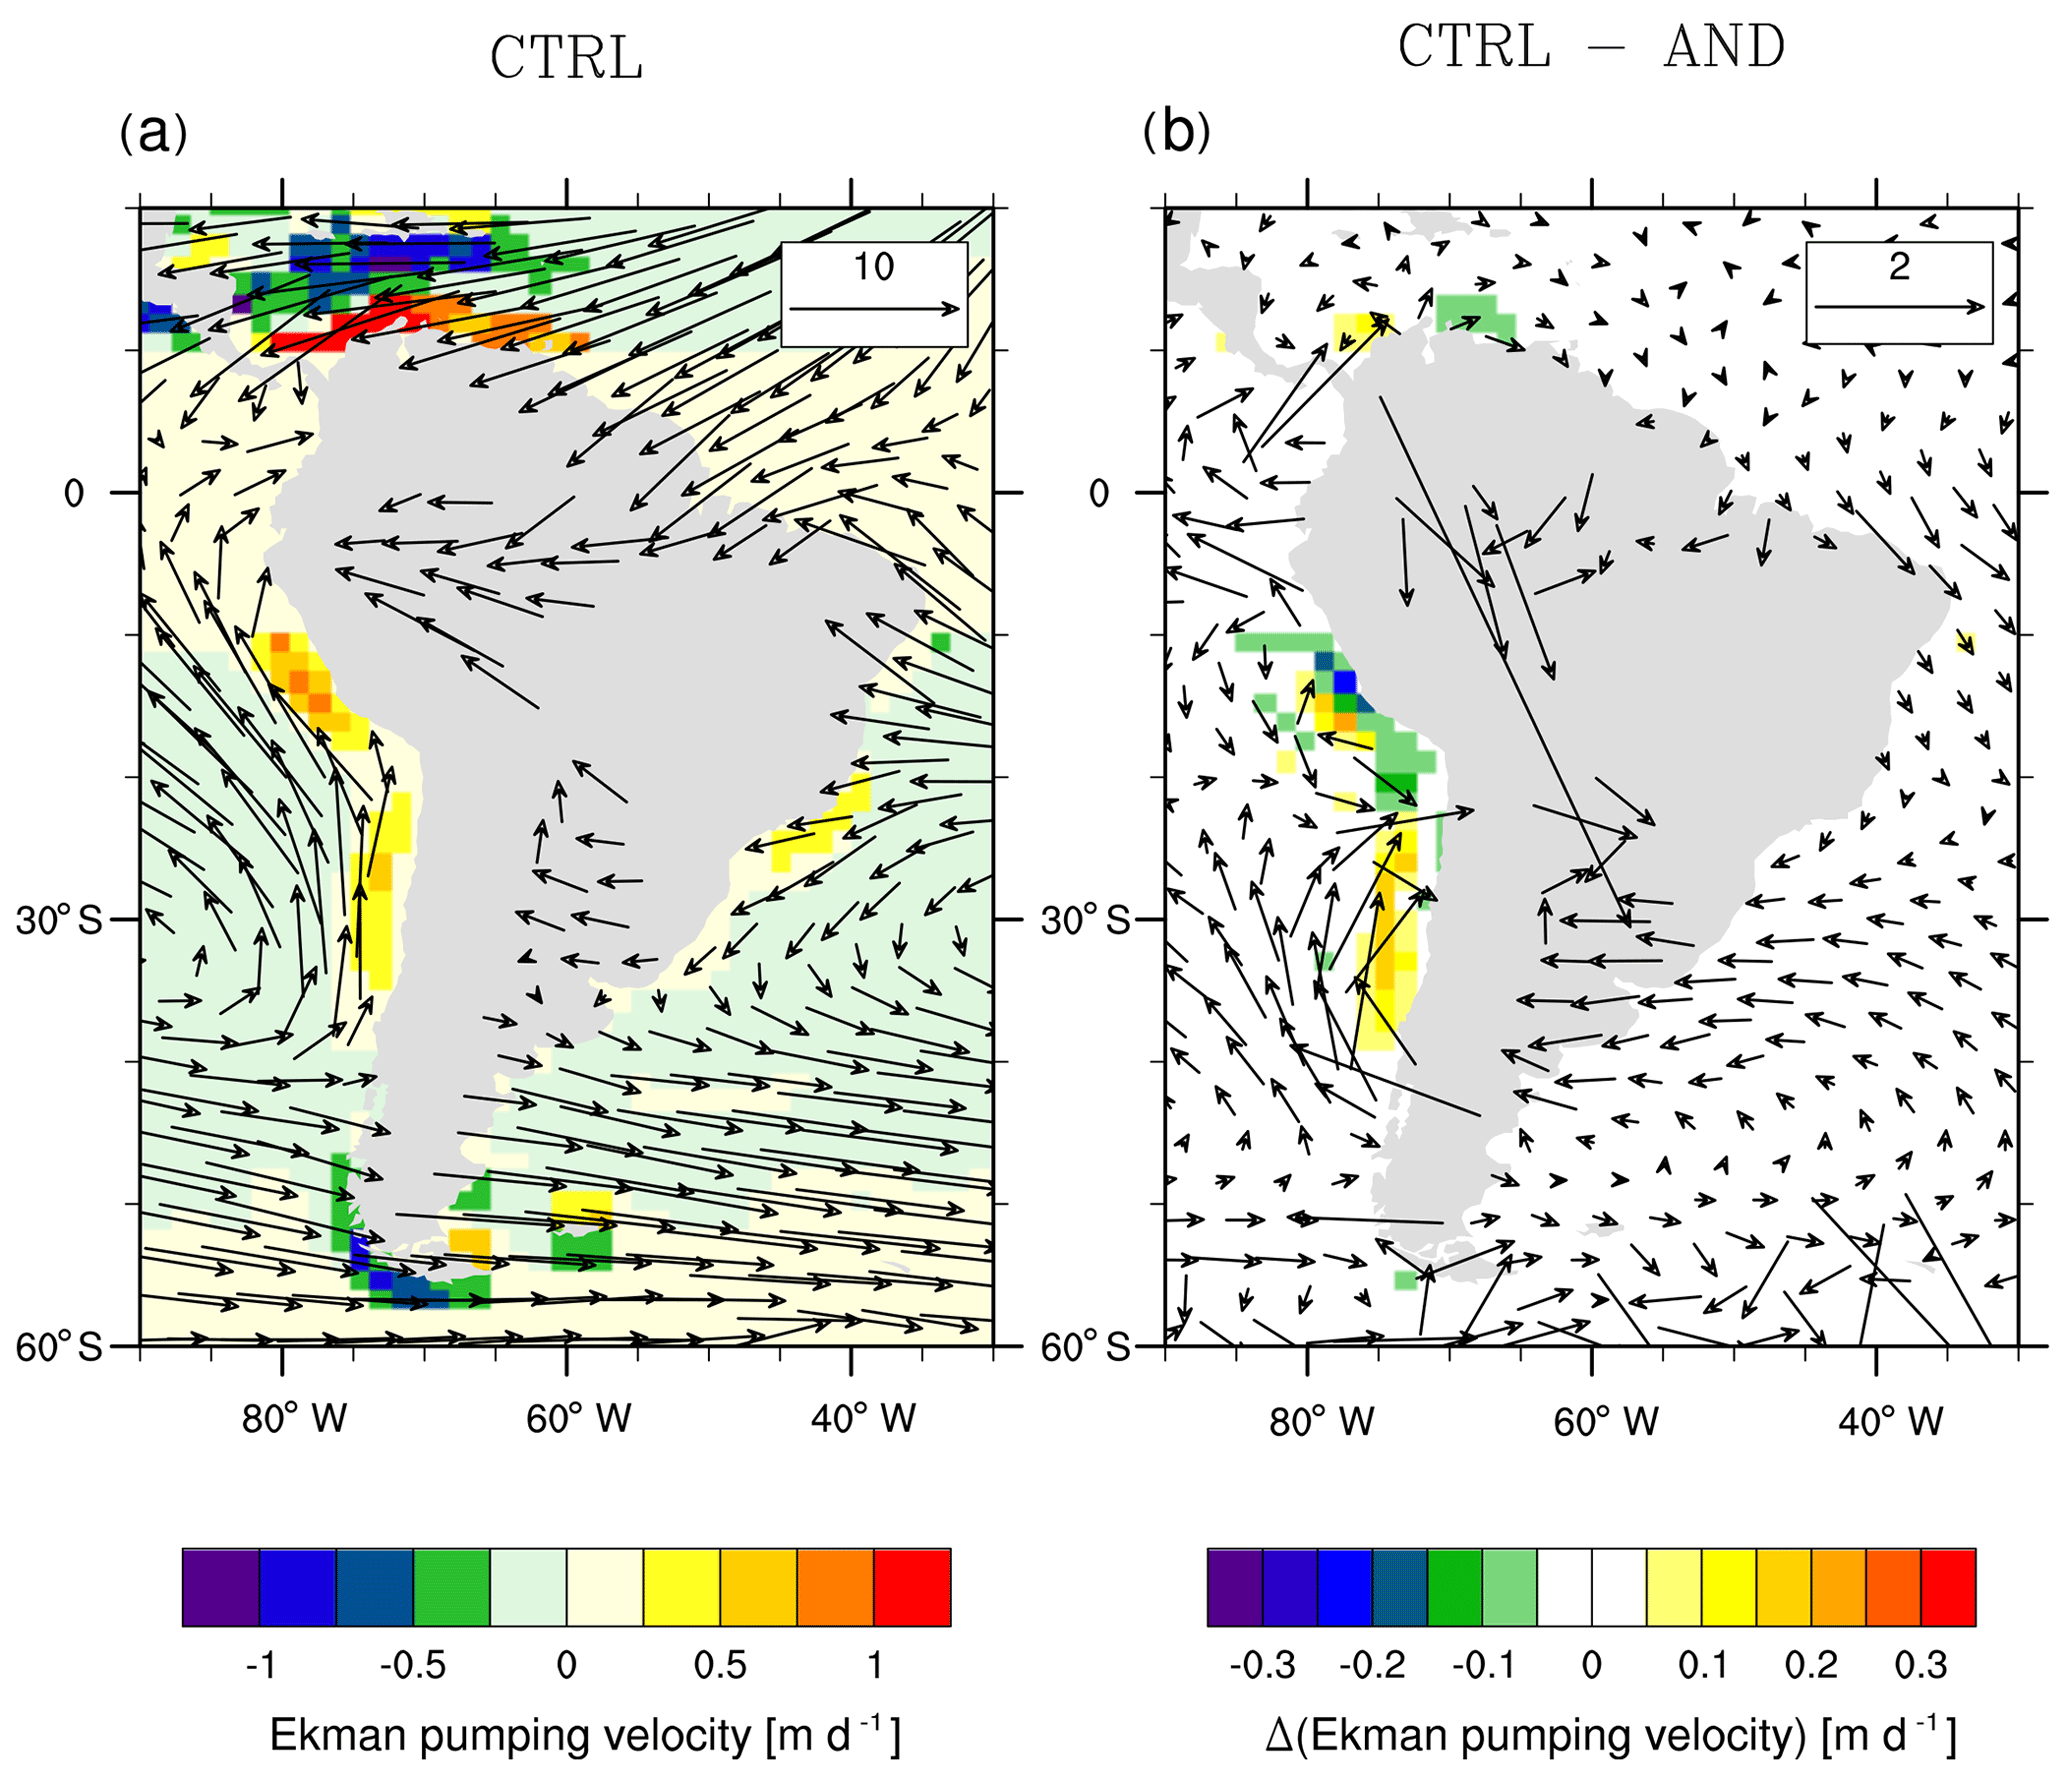
Figure 7Annual mean surface wind (arrows) (m s−1) and Ekman pumping velocity (m d−1) (shading) for CTRL (a) and response to South American mountain uplift (CTRL – AND) (b).
For the Andean uplift experiment (Fig. 7), the intensification of wind and Ekman pumping occurs mainly south of ∼22.5∘ S in the Chile upwelling region, whereas annual mean Ekman pumping, as well as wind stress, north of that latitude, in the Peru upwelling region, decreases. For the southern Humboldt (Chile upwelling) region, we find an intensification of the southerly branch of the South Pacific anticyclone, leading to increased wind stress and Ekman pumping. Not only is the alongshore wind component strengthened but also the wind is directed more towards the coast.
5.2.2 Upper-ocean temperatures
Considering changes in SSTs (Fig. 8) we find that in the Benguela, as well as in the California upwelling region, there is a cooling of the upper ocean (up to 2.5 and up to 1.5 ∘C, respectively). For the Humboldt Current and upwelling region, we find a cooling with uplift in the region north of ∼22.5∘ S despite a decrease in upwelling-favorable winds and Ekman pumping intensities. South of that latitude we observe a warming even though Ekman pumping and low-level winds indicate intensified upwelling.

Figure 8Annual mean SST response (∘C) to African mountain uplift (CTRL – AF) (a), North American uplift (CTRL – NA) (b) and Andean uplift (CTRL – AND) (c); regions of high significance according to t test (p<0.01) are shown by the hatching.

Figure 9Vertical velocity responses (m d−1) (shading) and temperature responses (∘C) (contours) to African (a), North American (b) and South American (c) mountain uplift. For African (a) and South American uplift (c), the annual mean responses are illustrated for 70 m depth, whereas for North American uplift (b) the response is illustrated for a depth of 47 m (which represents the respective depth of the largest change signal) in the upwelling season in boreal summer (JJA).
In the following we examine whether the changes in Ekman pumping velocities, which are driven by surface wind modifications, are translated into vertical velocity changes in the oceanic column by the ocean model and whether or not this results in a change in the vertical advective heat flux, that is dominating the temperature signal of the different upwelling regions. To this end we illustrate the temperature response together with the vertical motion change of the model layer with the largest response in upwelling velocity for the respective regions (Fig. 9).
In the Benguela region, zones with increased upwelling velocity clearly coincide with cooling areas (Fig. 9a) down to about 150 m (not shown) with temperature responses reaching over 3 ∘C. This was discussed and illustrated also in Jung et al. (2014). In the California region, the match of the spatial distribution of vertical velocity change and temperature change is not as good as in the Benguela upwelling system. The best overlap is found mostly during boreal summer (Fig. 9b) and autumn seasons (not illustrated), the major upwelling seasons of the California upwelling system. For the Humboldt region (Fig. 9c), this comparison shows that there is no obvious connection between upwelling or vertical heat advection change and temperature change for Andean uplift (neither in the Peru nor in the Chile upwelling region). Indeed, in the Chile area, despite an increase in upwelling velocities, there is a warming of up to 3 ∘C down to over 200 m depth (not shown).
5.2.3 Vertical velocity and ocean stratification
Even though there is a clear connection between surface wind strength (and direction) and the intensity of oceanic upwelling, an increase in upwelling velocities does not necessarily lead to an upper-ocean cooling. A second ingredient that is needed is a stratified coastal surface ocean. In the case of a very small vertical temperature gradient in the upper ocean, even a large increase in upwelling velocities will not lead to a major cooling.
The following figures illustrate vertical cross sections at the latitude of maximum upwelling velocities in the coastal zones of the investigated upwelling areas. The cross sections illustrate vertical velocities and temperatures in the simulation with low mountains and the changes of both variables with respect to mountain uplift. To see a clearer relationship, instead of annual means, we show seasonal averages for the seasons with the largest upwelling intensities and upwelling response intensities (i.e., SON for the Chile upwelling area and JJA for the other regions).

Figure 10Vertical cross sections (at ∼25∘ S): seasonal means of temperature with low topography (a) and high topography (b), temperature response to mountain uplift (c), vertical oceanic velocity with low topography (d) and high topography (e) and response of upwelling velocity to mountain uplift (f) for the Benguela upwelling region for boreal summer (JJA).
As discussed in Jung et al. (2014), in the Benguela region, clearly an intensification of upwelling is found that leads to a significant cooling of the upper ocean that is strongest at a depth of ∼50–100 m. Here, the upwelling intensification works in concert with the strongest vertical temperature gradient that is found exactly at this depth (Fig. 10).
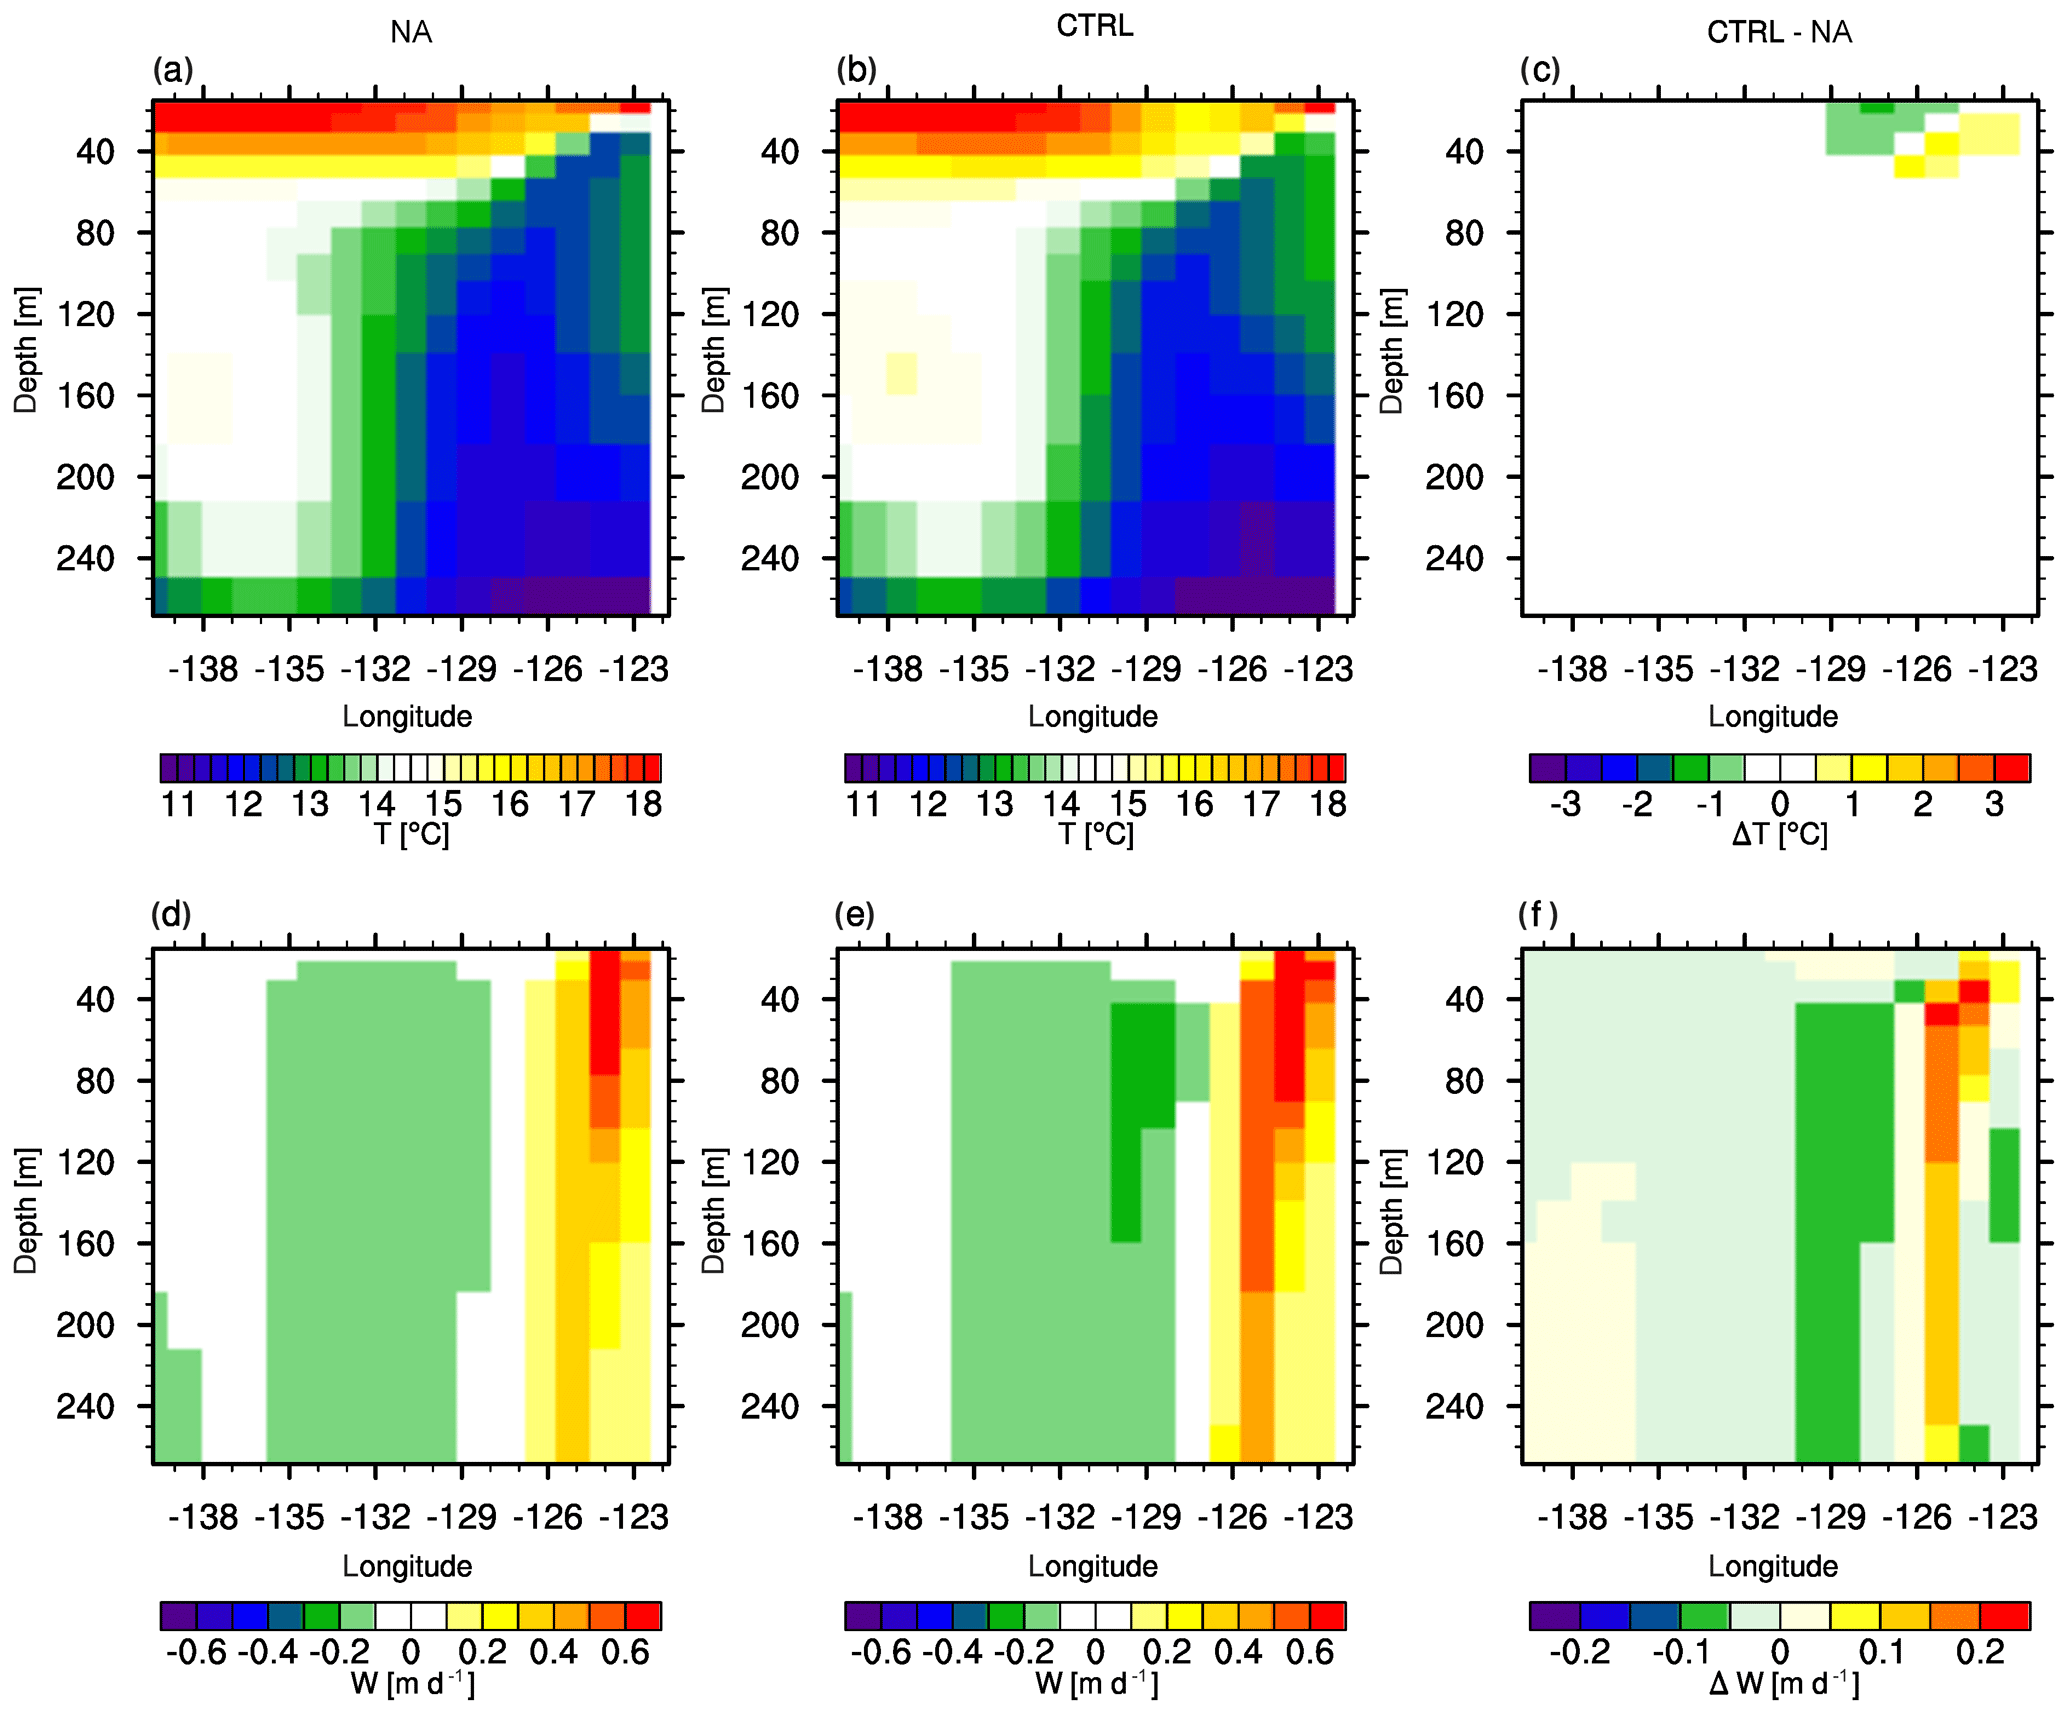
Figure 11Vertical cross sections (at ∼39∘ N): seasonal means of temperature with low topography (a) and high topography (b), temperature response to mountain uplift (c), vertical oceanic velocity with low topography (d) and high topography (e) and response of upwelling velocity to mountain uplift (f) for the California upwelling region for boreal summer (JJA).
The California upwelling region is characterized by a clear intensification of upwelling velocities, which is shown in a vertical cross section at 39∘ N (Fig. 11f). Despite this intensification of upwelling velocity, no cooling signal of the upper ocean is found in the region of maximum upwelling response (Fig. 11c). This is explained by the weak vertical temperature gradient of the surface ocean in that area (Fig. 11a). The observed surface cooling that is most prominent south of 30∘ N is hence most likely not mainly influenced by upwelling intensification in this model experiment. In the case of a more stratified ocean in combination with a stronger upwelling response (which might be the case in a higher-resolved model and in reality), this might indeed have a larger contribution to upper-ocean cooling, since it was illustrated that simulated upwelling velocities are underestimated.
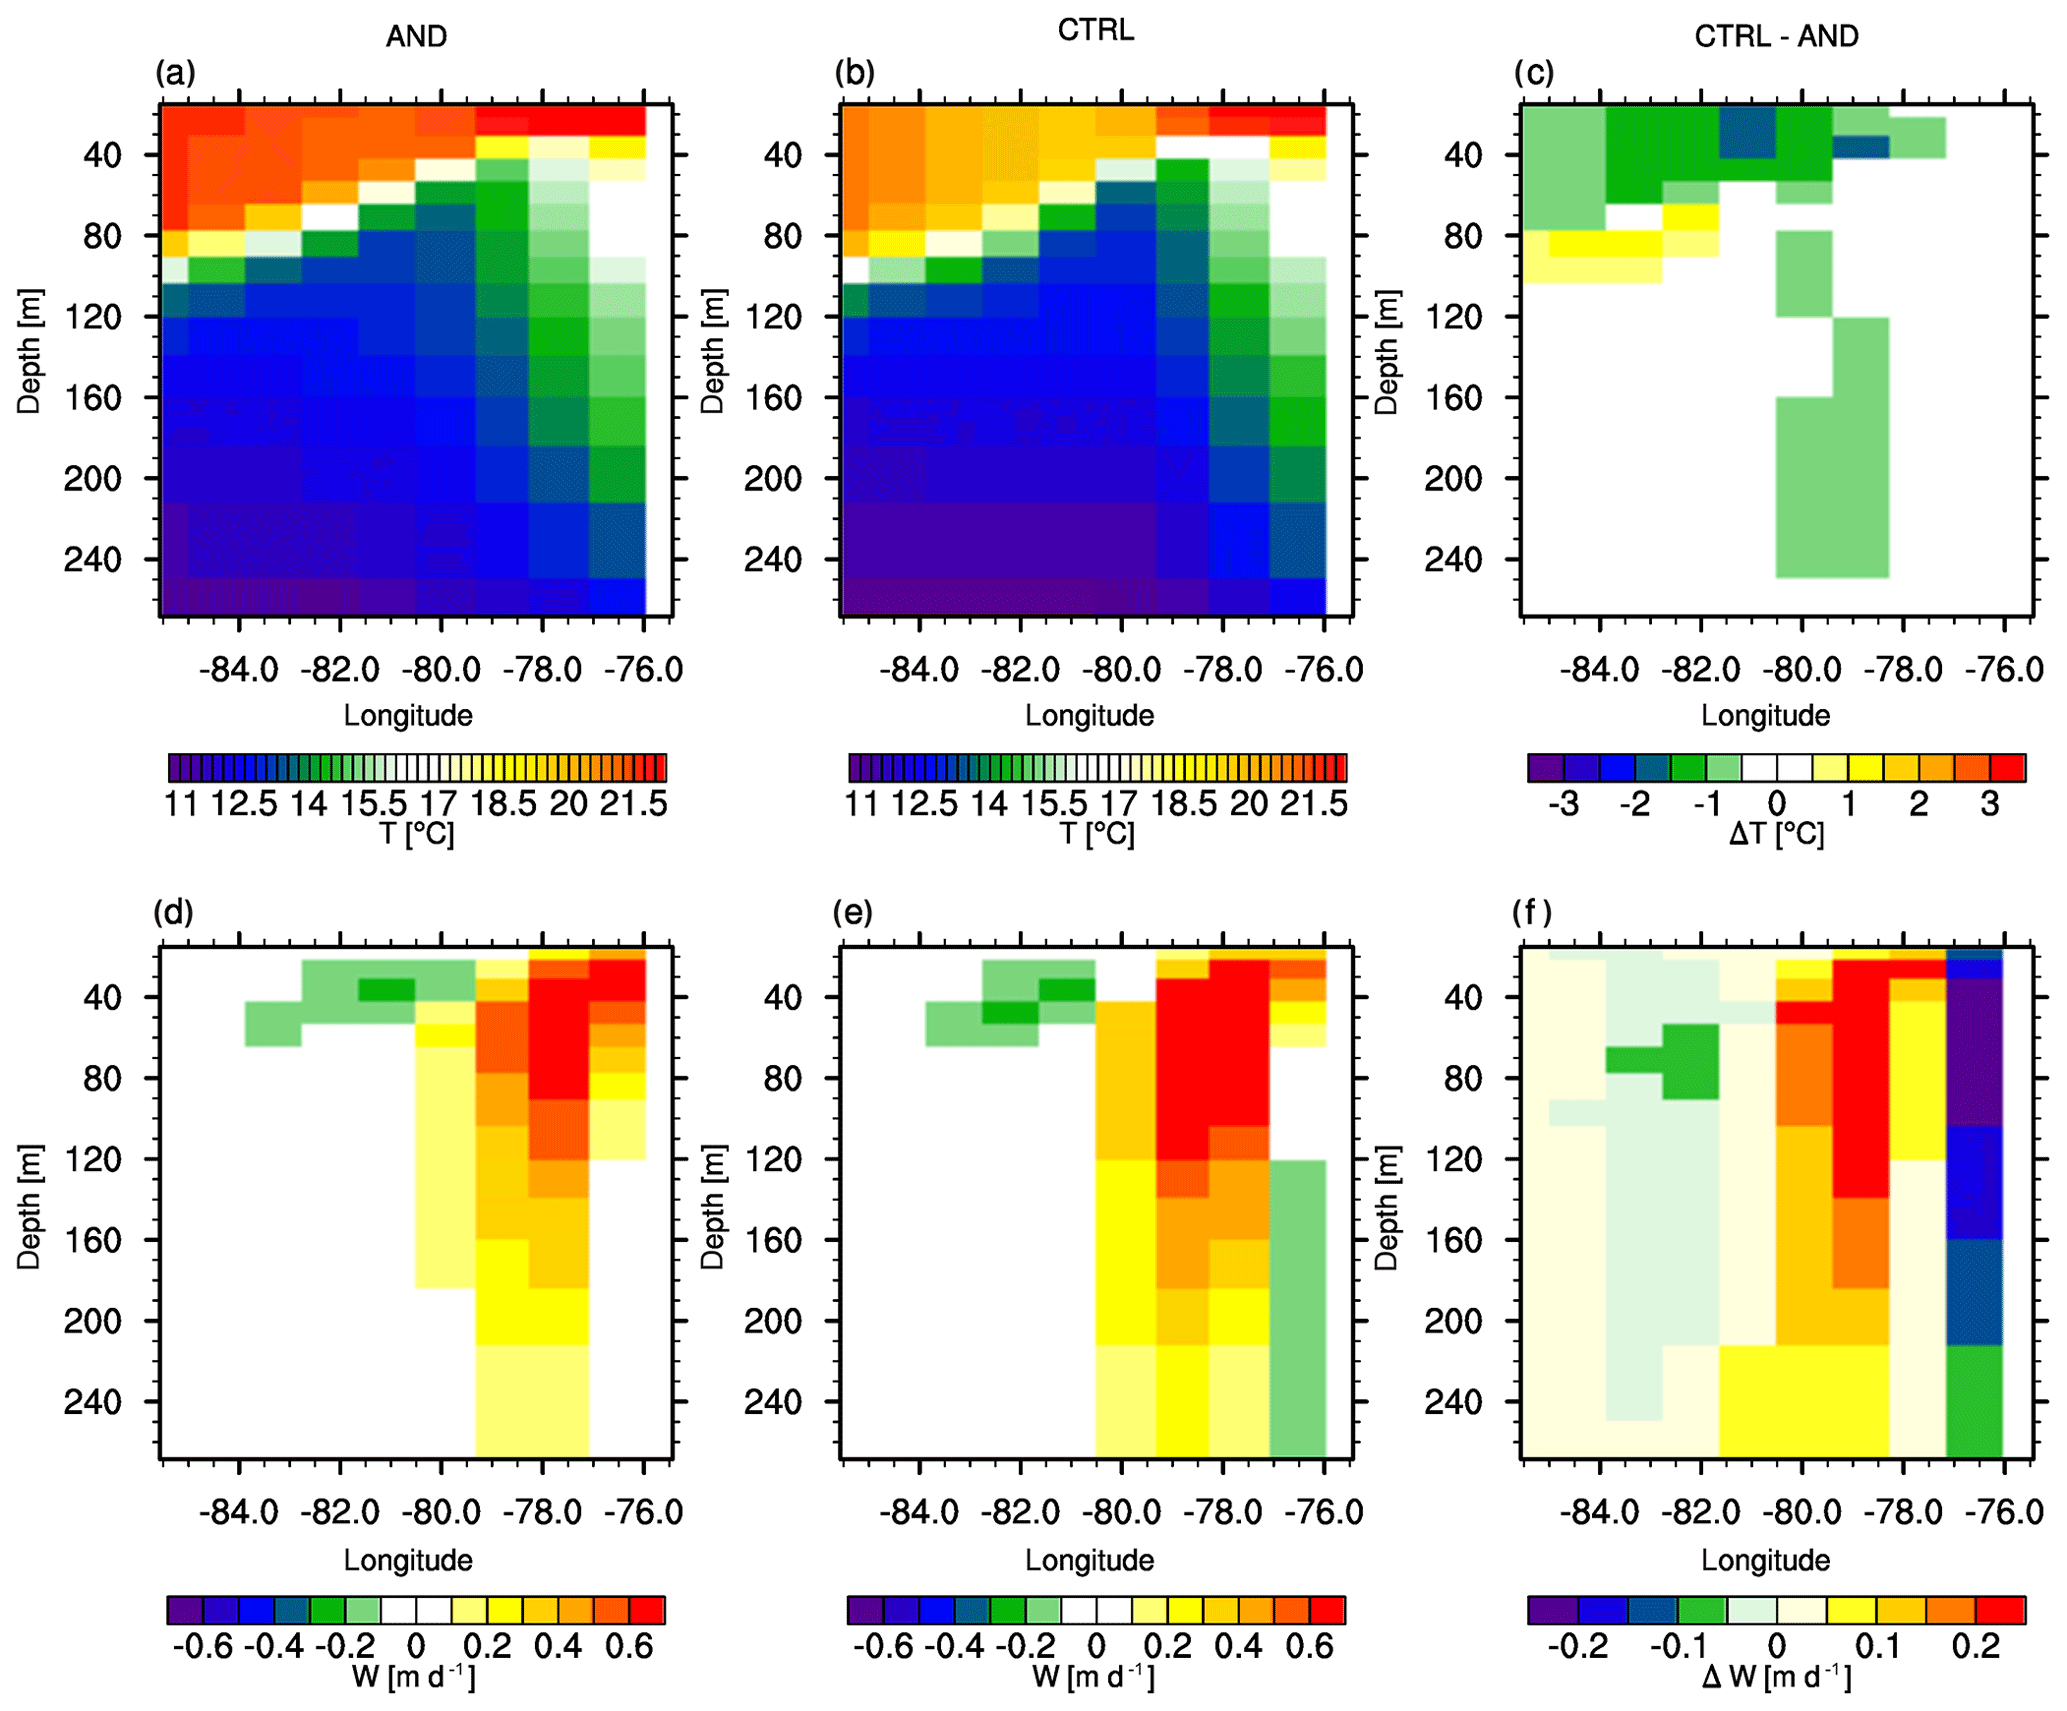
Figure 12Vertical cross sections (at ∼15∘ S): seasonal means of temperature with low topography (a) and high topography (b), temperature response to mountain uplift (c), vertical oceanic velocity with low topography (d) and high topography (e) and response of upwelling velocity to mountain uplift (f) for the northern Humboldt area (Peru upwelling region) for boreal summer (JJA).
In the Peru zone upwelling is evident and we find a small decrease in upwelling intensity in the vicinity of the coast (Fig. 12f), as also evident in Fig. 9. Nevertheless, we observe a slight surface cooling (Fig. 12c), even though the stratification of the surface ocean is not minor. Hence other reasons for the temperature change signal with mountain uplift are to be found.
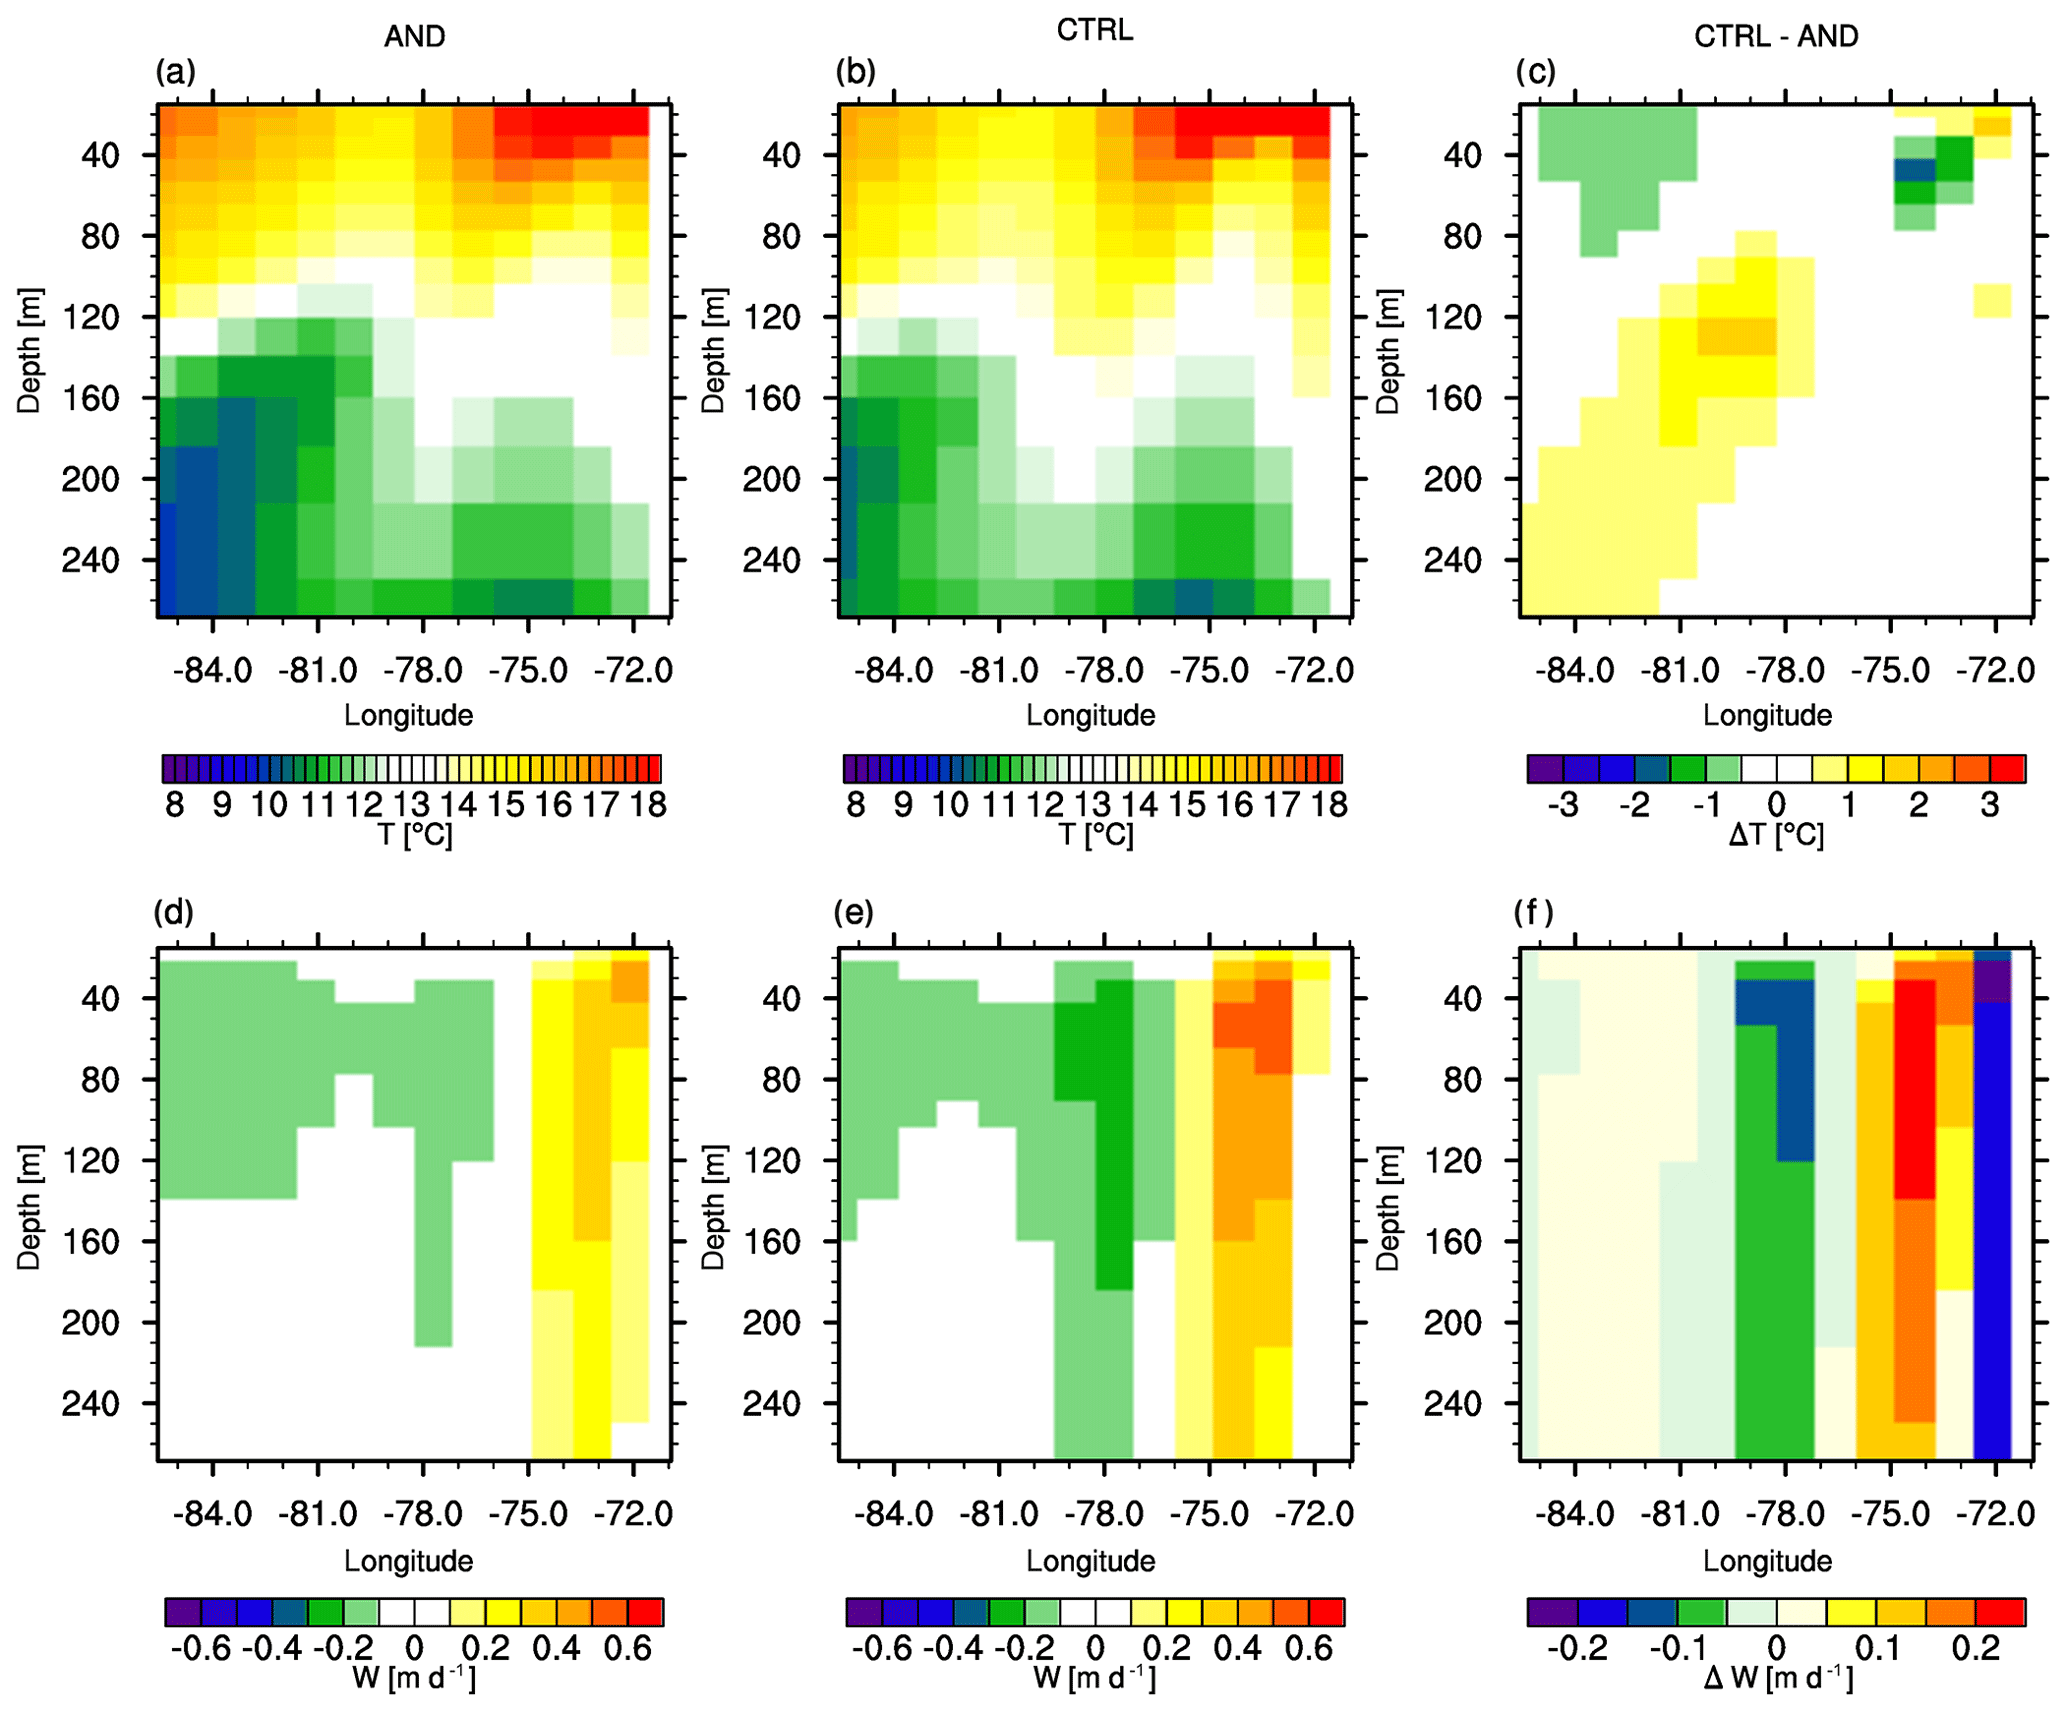
Figure 13Vertical cross sections (at ∼29∘ S): seasonal means of temperature with low topography (a) and high topography (b), temperature response to mountain uplift (c), vertical oceanic velocity with low topography (d) and high topography (e) and response of upwelling velocity to mountain uplift (f) for the southern Humboldt area (Peru upwelling region) for boreal autumn (SON).
In the southern Humboldt region, upwelling in the major upwelling zone is rather weak in the model representation for boreal fall (SON) with low mountains, but it increases with mountain uplift (Fig. 13). What was not evident from the SST warming in Fig. 8 is that there is indeed a response to the upwelling intensification that manifests in a weak cooling signal at a depth of ∼40–80 m. However, upwelling velocities, as well as the ocean stratification, are still relatively small with high mountains.
Nevertheless, there is a warming signal at the surface and further off the coast down to greater depth (max at ∼120 m) that is not related to upwelling activity changes and dominates the response in SST. This temperature change maximum (Fig. 8) is found further south (∼33∘ S) than the one illustrated by the cross section, which is situated at the latitude of maximum upwelling response (∼29∘ S).
5.2.4 Surface heat fluxes and low clouds
Surface heat fluxes are likely to alter SSTs in addition to the changes in upwelling strength, but they are also affected by SST changes and hence play a crucial role in atmosphere–ocean feedbacks. In the following we compare surface heat fluxes and illustrate them with respect to their effect on the oceanic heat content. Hence, a reduced solar radiative flux (directed from the atmosphere to the ocean) would lead to a cooling of the ocean, whereas reduced latent and sensible heat fluxes would contribute to a warming of the ocean and hence be displayed as such.
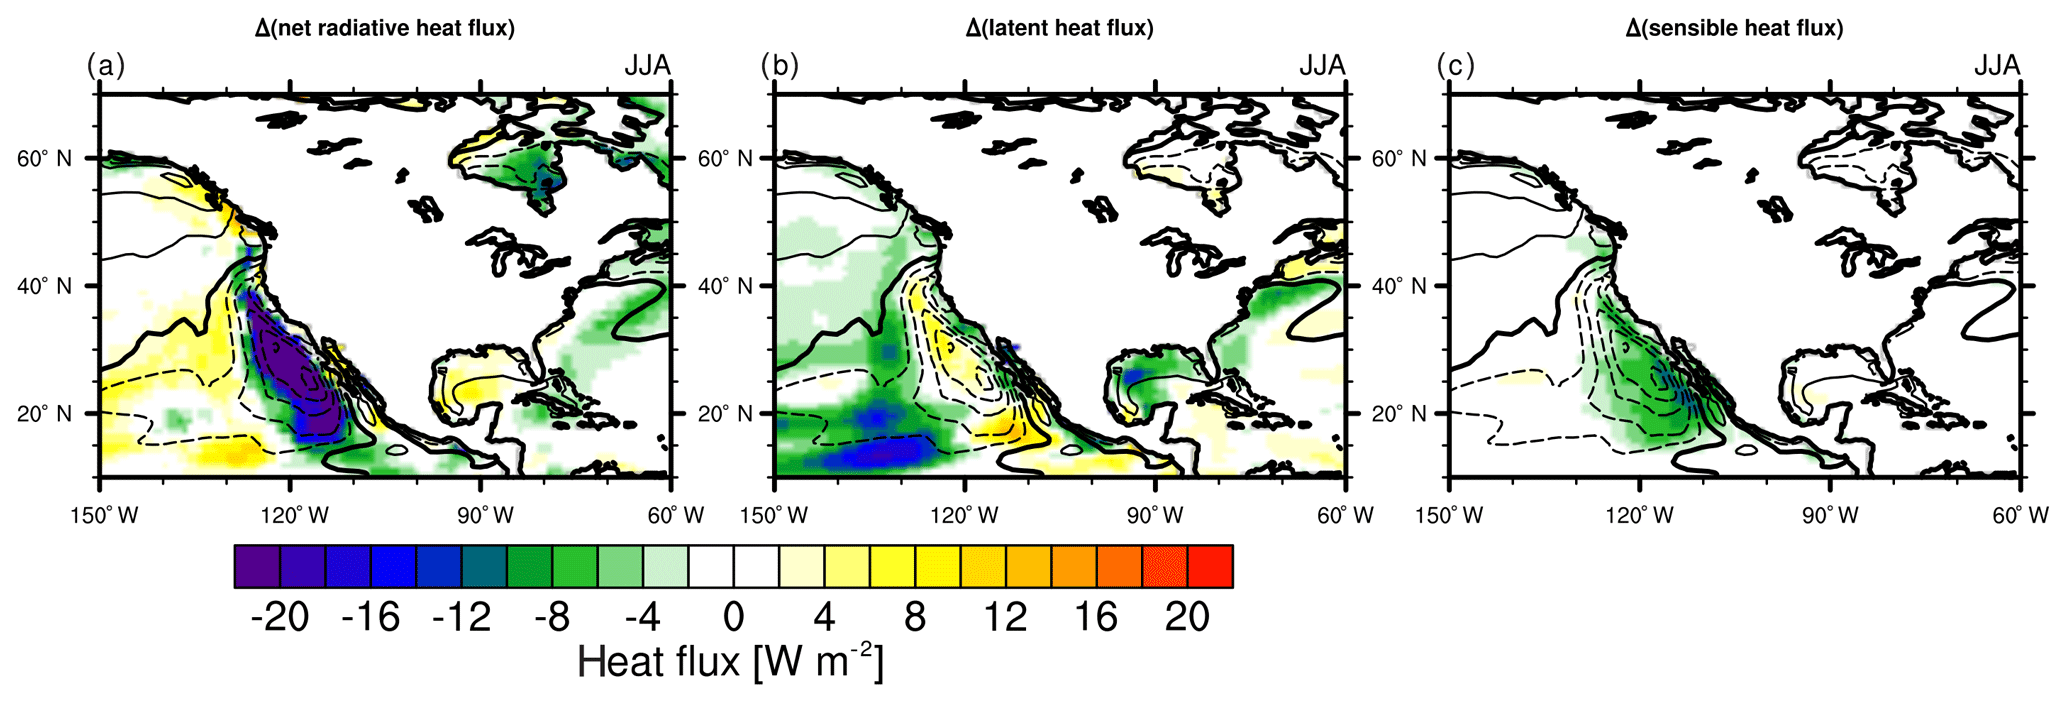
Figure 14Annual mean responses of surface heat fluxes to African uplift (W m−2): net radiative heat flux (a), latent heat flux (b), sensible heat flux (c); note: what is illustrated is the effect of the surface heat fluxes on the ocean heat content; contours: SST response (intervals: 0.5 ∘C).
As illustrated in Fig. 14 (and similarly in Jung et al., 2014), in the Benguela upwelling area, the cooling is mainly determined by vertical advective heat fluxes, whereas the surface heat fluxes approximately cancel out. The latent heat flux to the atmosphere is strongly reduced due to reduced SSTs, contributing to a positive change in the surface ocean heat balance. The changes in net surface radiative heat flux and sensible heat flux are negative. Reasons might be an increase in low-cloud coverage and the increase in near-coastal wind strength in combination with increased cold-air advection from the south.
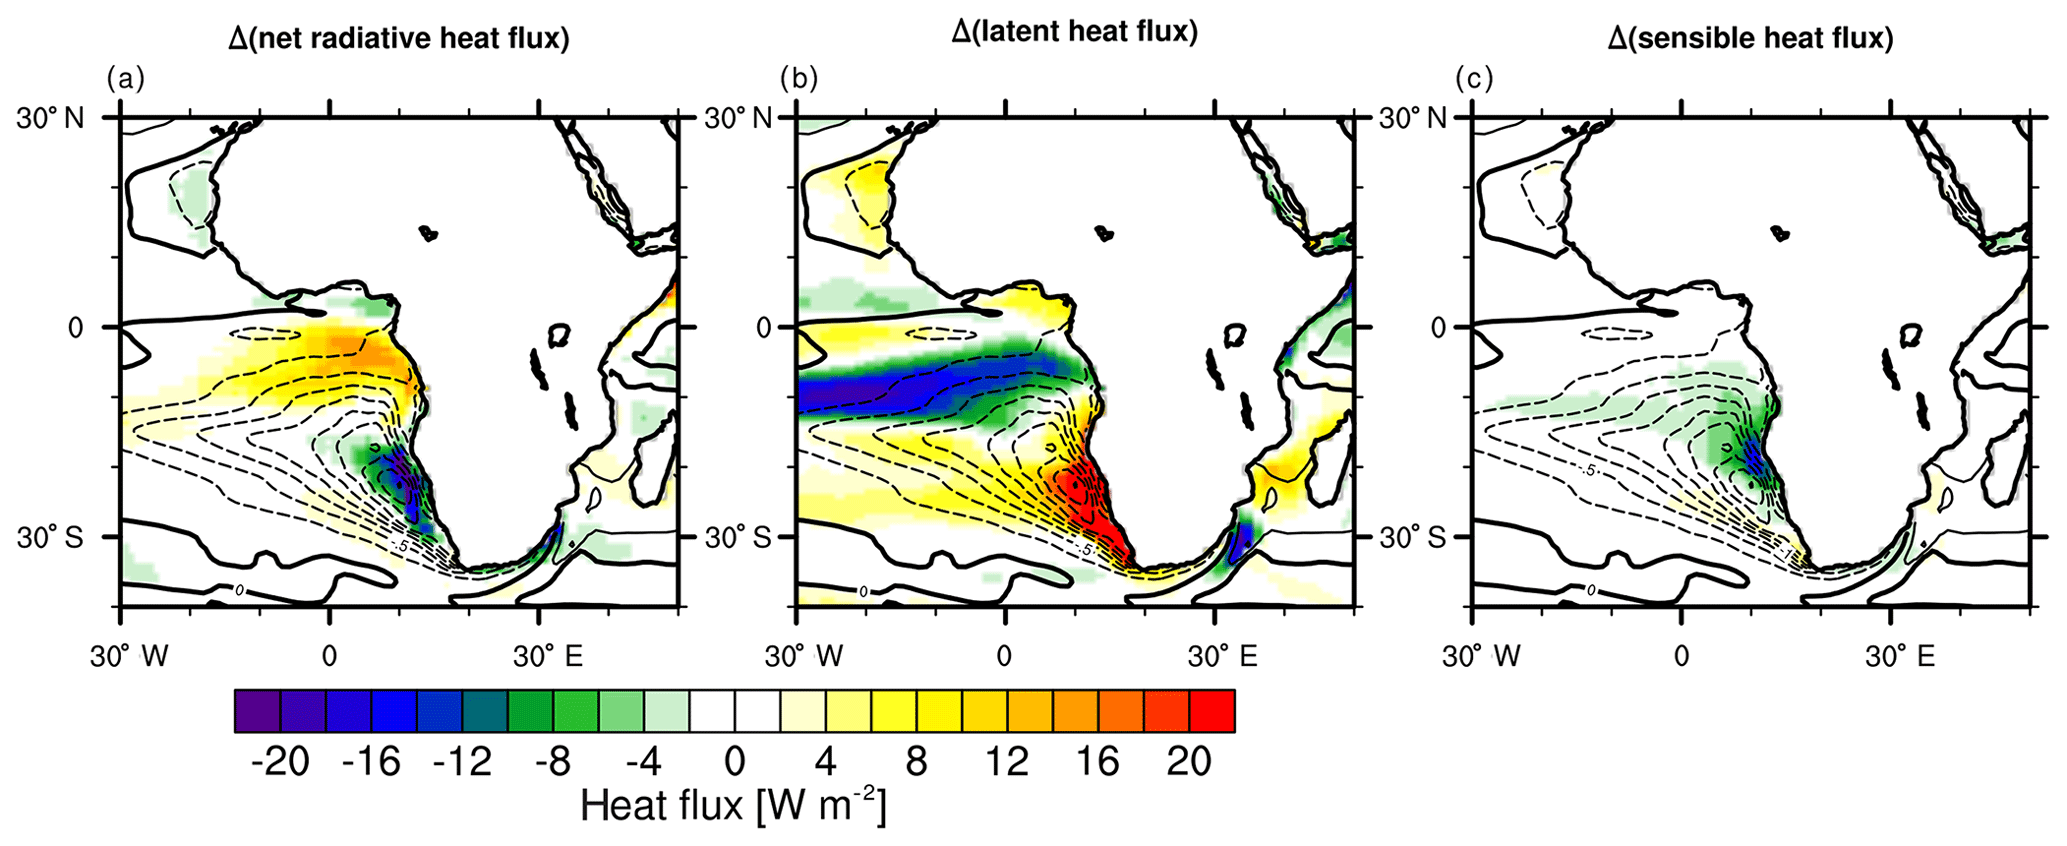
Figure 15Seasonal mean (JJA) responses of surface heat fluxes to North American uplift (W m−2) in boreal summer: net radiative heat flux (a), latent heat flux (b), sensible heat flux (c); note: what is illustrated is the effect of the surface heat fluxes on the ocean heat content; contours: SST response (intervals: 0.5 ∘C).
For the California upwelling region (Fig. 15), sensible heat flux changes are also relatively weak. Despite the strengthened surface wind, latent heat flux is slightly weakened due to the surface cooling. Net radiative heat influx is strongly decreased due to increased low-cloud coverage, as is illustrated below. The net radiative heat flux change is by far the most important contribution of the surface fluxes and hence acts in concert with the rather weak upwelling intensification.
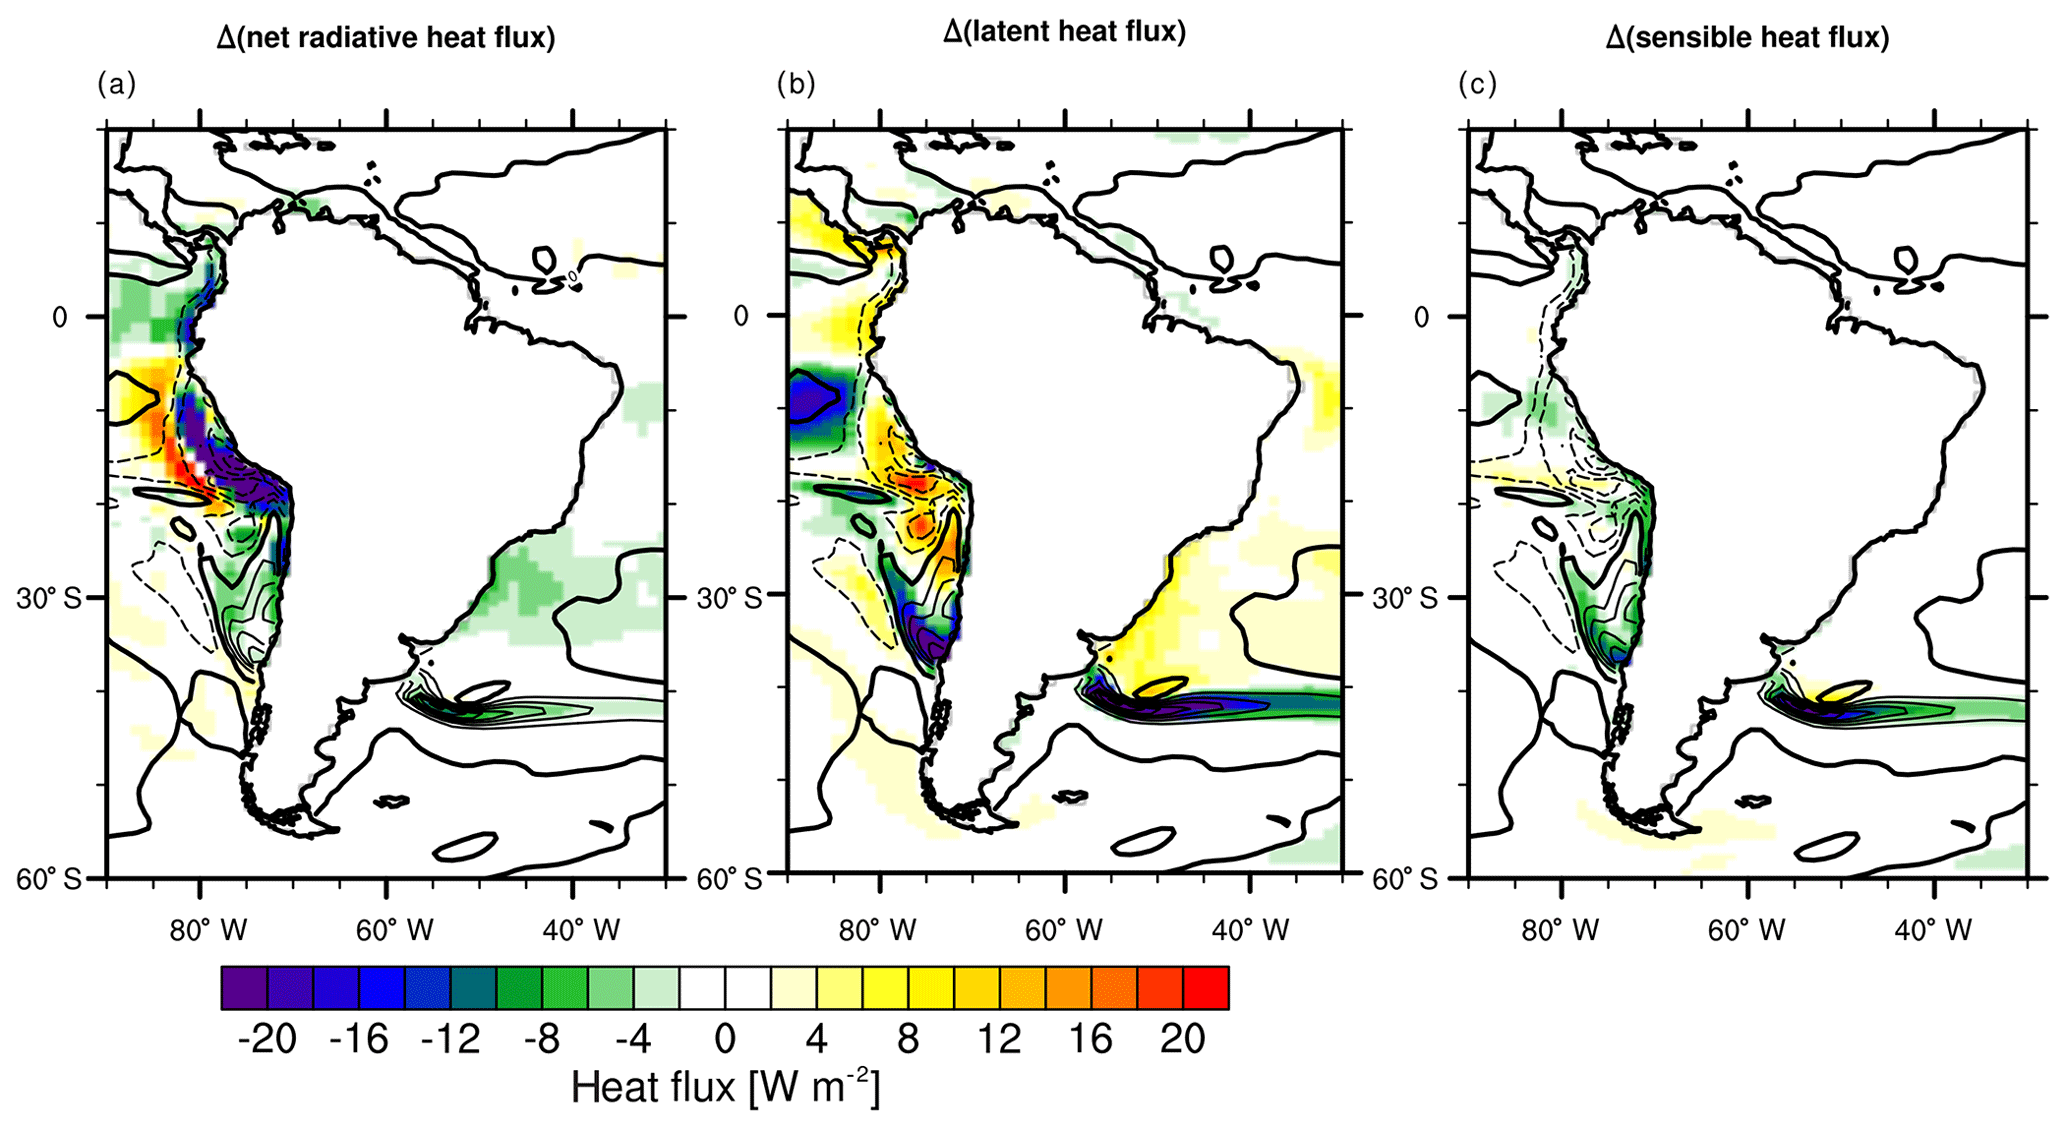
Figure 16Annual mean responses of surface heat fluxes to Andean uplift (W m−2): net radiative heat flux (a), latent heat flux (b), sensible heat flux (c); note: what is illustrated is the effect of the surface heat fluxes on the ocean heat content; contours: SST response (intervals: 0.5 ∘C).
In the northern Humboldt region the cloud radiative feedback acts to reduce surface energy balance by altering the net radiative heat flux (Fig. 16) and hence opposes the reduction of upwelling which would otherwise lead to a warming of the sea surface. The latent heat flux is reduced, most likely as a consequence of the decrease in surface winds and of surface cooling, and hence counteracts the overall cooling. Sensible heat flux changes are small for the northern Humboldt region (and of different sign) and therefore have a negligible effect on SSTs. From this analysis it appears that the strongest effect of mountain uplift works via the net radiative heat flux, leading to a cooling, despite a reduction in upwelling and the contrary effect of latent heat flux. This reduction of the net radiative heat flux is mainly caused by an increase in cloud coverage, which will be discussed in the following.
In the southern Humboldt region both net radiative and sensible heat flux are not of major importance for SST change, whereas the latent heat flux is strongly increased (indicated by a negative contribution to the surface heat balance of the ocean). Most likely this effect is caused by the increase in SST and the intensification of the wind strength. All components of the surface heat balance indicate a cooling in the southern Humboldt region and are hence acting in concert with upwelling intensification. Therefore other explanations are needed for the strong warming of the surface ocean that can be observed in the southern Humboldt upwelling area.
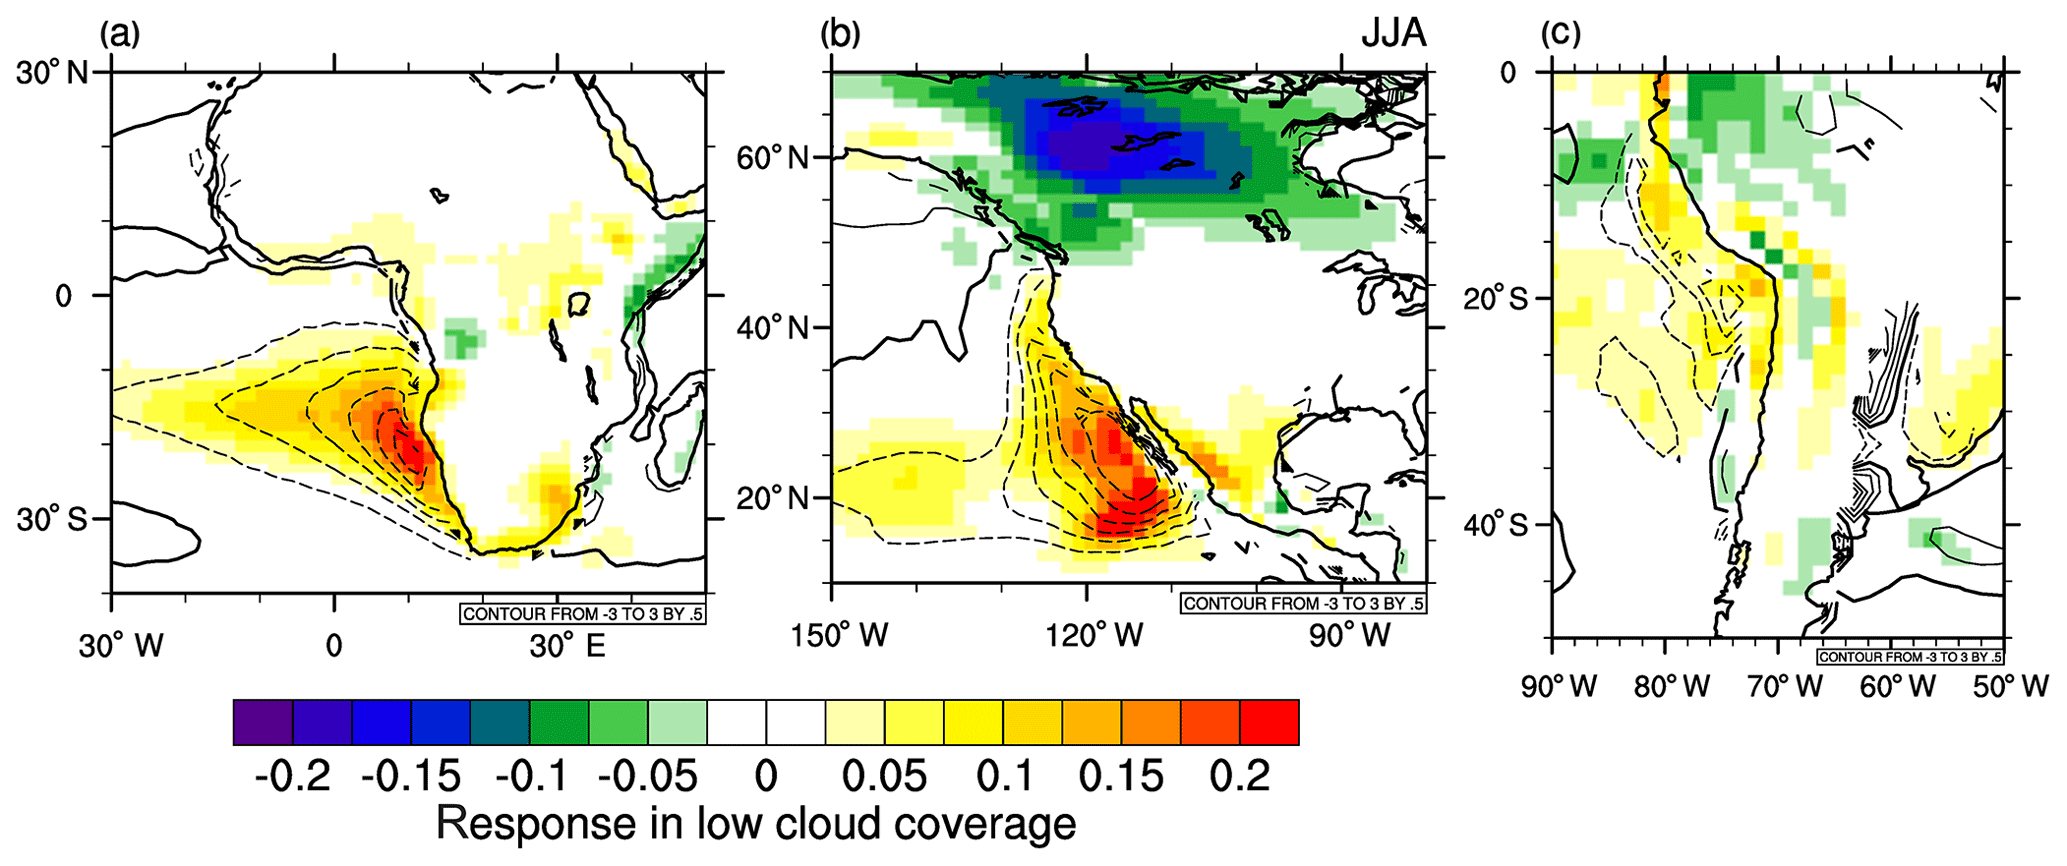
Figure 17Responses in low-cloud coverage (shading) and temperature (contours, intervals: 0.5 ∘C) to African (CTRL – AF) (a), North American (CTRL – NA) (b), and South American (CTRL – AND) (c) mountain uplift. For African (a) and South American uplift (c) the annual mean responses are illustrated, whereas for North American uplift (b) the response is illustrated for the upwelling season in boreal summer (JJA).
In three of the upwelling areas, namely the Peru, Benguela and California upwelling zones, we could identify a strong decrease in net radiative heat flux. This net radiative heat flux response is to a major part caused by an increase in low-cloud coverage that is illustrated in Fig. 17a–c for the different experiments, impacting shortwave incoming radiation. But there is also some contribution from a decrease in higher-level cloud cover. This is also shown by an analysis of the shortwave and longwave contributions to the radiative feedback (compare Figs. S7–S9 in the Supplement). In the Benguela upwelling region the reduction in shortwave insolation is caused mainly by an increase in low-cloud coverage. Additionally, in the northern part of the Benguela region, the net radiative cooling is enhanced by a decrease in mid-level and high clouds, which leads to a reduced longwave cloud forcing. In the North American area, the largest part of the cooling signal can be traced back to an increase in low clouds and an additional cooling in the southernmost area, reaching far out in the ocean can also be attributed to a decrease in mid-level and high clouds. In the southern Humboldt region, there is no effect of cloud radiative forcing but in the northern Humboldt region shortwave cloud radiative forcing due to increased low-cloud cover leads to surface ocean cooling. Longwave cloud forcing is, in the Andean uplift experiment, only relevant over the continent.
5.2.5 Horizontal heat advection in the surface ocean
Another important factor related to oceanic temperature evolution is the influence of horizontal heat transports. In the Benguela region (Fig. 18a and d), there is mainly a strengthening of northwestward current velocities and hence advection of colder waters from the southeast occurs. The flow pattern also indicates that the cooling signal is mainly connected to the region of maximum upwelling intensification and is eventually transported with the prevailing flow pattern. The cooling is additionally intensified by the increase in the transport of cooler waters from the south.
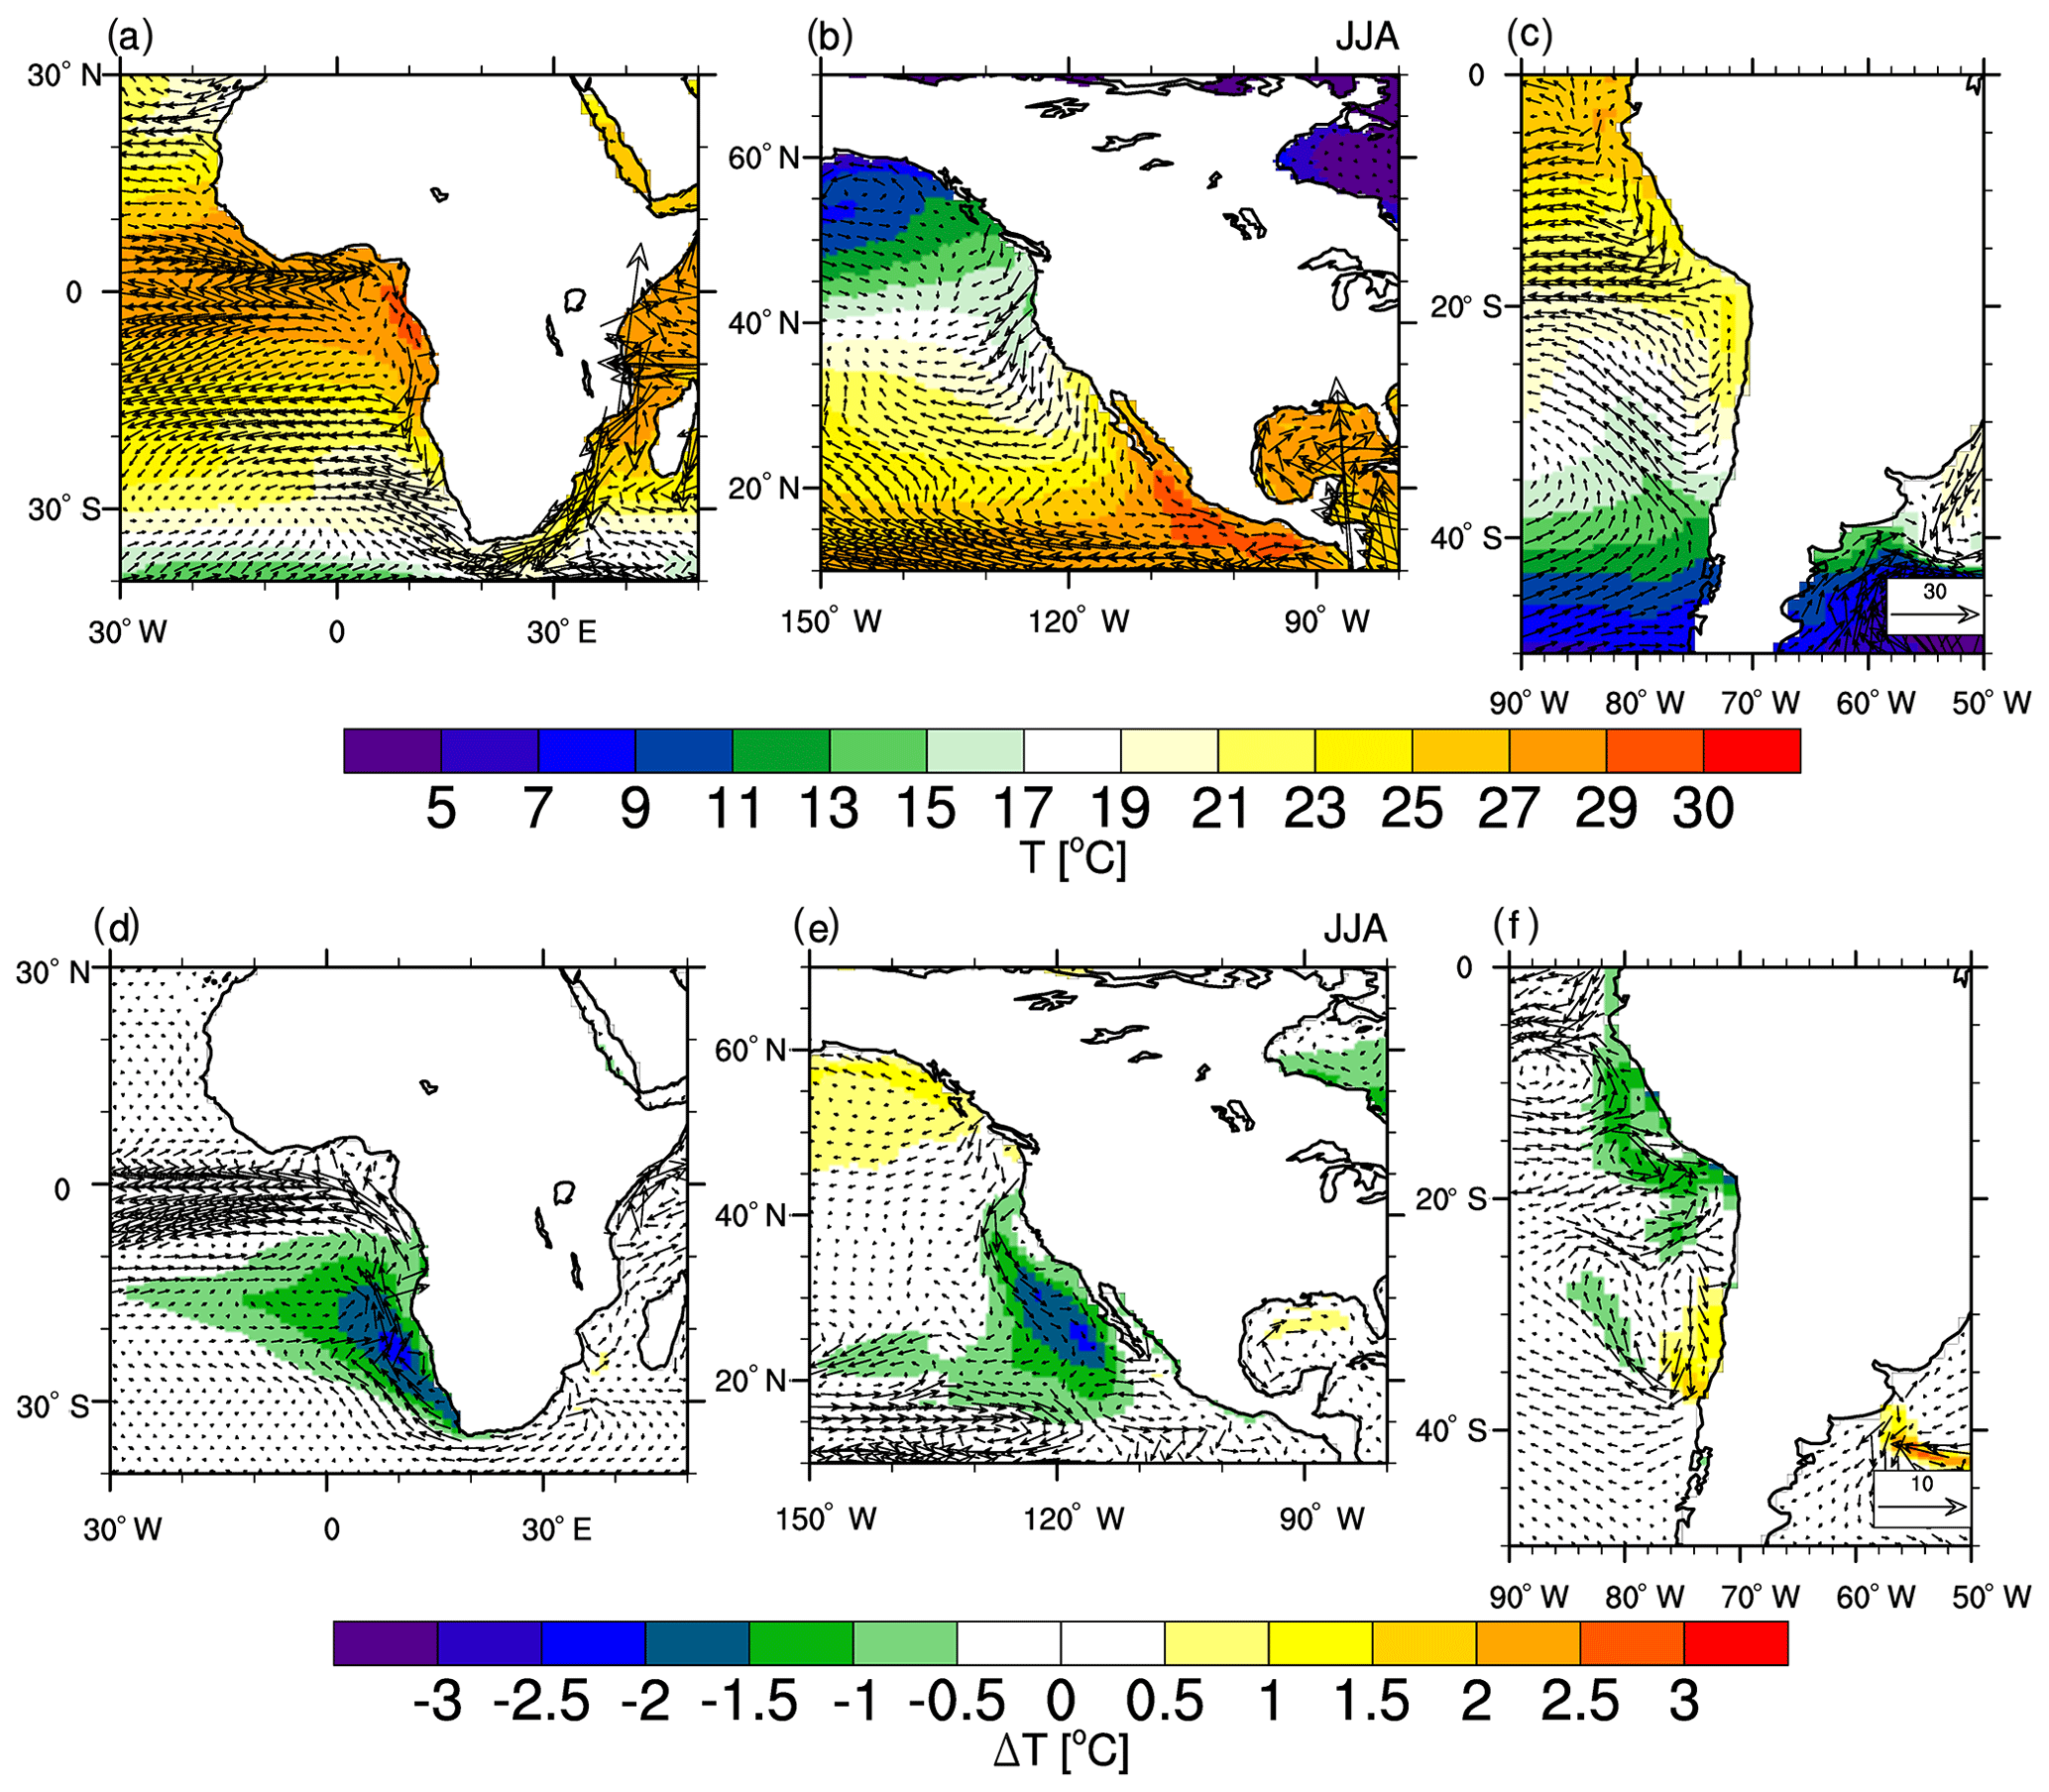
Figure 18Surface (first model layer) horizontal velocity (m s−1) (vectors) and SST (∘C) (shading) for CTRL (a, b, c); horizontal velocity responses (m s−1) (vectors) and temperature responses (∘C) (shading) to African (CTRL – AF) (d), North American (CTRL – NA) (e) and South American (CTRL – AND) (f) mountain uplift. For Africa (a, d) and South America (c, f), the annual means are illustrated, whereas for North America (b, d) the seasonal mean in the upwelling season in boreal summer (JJA) is shown.
In the California region (Fig. 18b and e), the strong cooling signal seems to be most likely related to the strengthening of the southward transport of cool water masses. Here, the strongest cooling signal is not found in the area, where we see the strongest upwelling intensification (Fig. 9), but further to the south, where the southward flow intensification ceases and turns into a slight southward flow decrease. This indicates that, in contrast to the Benguela upwelling region, upwelling does not play an as important role for upper-ocean cooling, whereas horizontal heat transport is more important.
For the Peru upwelling zone (Fig. 18c and f) there seems to be no direct connection between the transport of water masses and SST, since the horizontal temperature gradient in that area is very small.
In the Chile upwelling zone (Fig. 18c and f), where surface energy fluxes as well as upwelling intensities did not show any relation to the strong upper-ocean warming, we can clearly relate the temperature changes to an intensification of the Peru–Chile undercurrent and of the Peru–Chile countercurrent. This southward flow anomaly is most likely related to changes in wind stress curl and associated Sverdrup dynamics (Karstensen and Ulloa, 2009). As illustrated in the cross section in Fig. 13, also an upwelling-induced small cooling signal is found in the subsurface, but this is overlain by a very strong transport of warm water masses from the north to the south.
Dekens et al. (2007) suggested that the long-term cooling trends, which are obvious in all major EBUSs since at least the Pliocene, are attributable to factors like changes in depth and/or temperature of the thermocline. Even though these factors might have played a role (Steph et al., 2010), our study suggests that mountain uplift processes also need to be considered as a cause contributing to the cooling in some of the EBUSs.
Not many studies analyzing the effect of mountain uplift on atmospheric and oceanic dynamics with a coupled global general circulation model were performed so far. Jung et al. (2014, 2016) illustrated how African topography shaped atmospheric circulation patterns that have a strong influence on the strength of the Benguela upwelling system but also on precipitation and vegetation cover. Sepulchre et al. (2009) investigated the influence of Andean uplift on the Humboldt Current. They found rather similar results regarding the atmospheric response with their uncoupled atmosphere general circulation model (AGCM). The oceanic response comparing our coupled model to their offline regional ocean circulation model, ROMS, shows large differences, most likely caused by missing feedback mechanisms and the higher resolution of the regional ocean model. A model study, applying the relatively highly resolved atmosphere-only GCM CAM5 for present-day and Pliocene topography (globally) to investigate the effects of uplift on the worlds' major upwelling regimes showed similar results in terms of the cloud radiative response to mountain uplift (Arnold and Tziperman, 2016). Potter et al. (2017) compared a low-resolution atmosphere-only model and a coupled model for the response to Andean uplift. Their simulation also showed an increased low-cloud formation with high mountains and a much reduced cloud coverage in the low-mountains scenario. The low-cloud reduction is stronger in the noncoupled simulation, but extends further west over the ocean in the coupled simulation, due to atmosphere–ocean feedbacks and dynamic ocean processes, as well as model deficiencies.
Model experiments for South America and Africa (Richter and Mechoso, 2006, 2004; Feng and Poulsen, 2014) showed that elevated terrain acts on lower tropospheric stability, resulting in an increase in low-cloud coverage off the coast. This is caused by the blocking and deflection of the westerlies (for South America additionally a blocking of the northeasterly flow), which leads to subsidence warming above the planetary boundary layer and cold-air advection within the planetary boundary layer. This increase in cloud coverage already occurs in the studies without coupled ocean (Richter and Mechoso, 2006, 2004), but the effect is most likely strengthened by atmosphere–ocean feedback mechanisms, since the increased cloud coverage leads to a sea surface cooling due to reduction of incoming solar radiation, which then leads to an enhanced cooling in the lower layers of the atmosphere, which further enhances the effect on tropospheric stability and low-level cloud coverage, forming a positive feedback loop. In the study of Feng and Poulsen (2014), using the coupled global circulation model CCSM4, the radiative cooling caused by low clouds even leads to a remarkable reduction of the Walker circulation and a reduced ENSO strength and frequency due to the cooling of the eastern equatorial Pacific. In terms of clouds, surface wind, SST and also horizontal heat advection in a simulation with flat Andes compared to present-day orography showed results similar to our simulation. Another experiment with moderate half-Andean elevation resulted in only minor responses. The main difference between their study and the present investigation is that they did not show an opposite effect for the Peru and the Chile upwelling areas, which might be related to a lower model resolution. The similarity of the different studies underlines the robustness of our findings.
Figure 19 illustrates the most important processes that were analyzed in this study and that play a role in the responses of EBUSs to continental-scale mountain uplift. Mountain uplift, on the one hand, leads to elevated heating which then results in a strengthened land–ocean temperature gradient in the lower atmosphere, which through thermal wind relation leads to intensified low-level jets that are the main drivers of upwelling in EBUSs. Additionally, higher mountains directly affect the low-level winds near the coast by a channeling of the flow. However, the low-level winds do not only affect upwelling activity but also act on horizontal heat transport which might lead to either a warming or a cooling of upper-ocean temperatures. Low-level winds, as well as ocean temperatures, act on the latent heat flux which is an ingredient for the formation of low clouds. More importantly, low-cloud coverage is influenced by mountains due to blocking of westerly flow and an increase in lower tropospheric stability, as described in detail by Richter and Mechoso (2006, 2004). The increase in low-cloud coverage reduces downward, shortwave radiation and hence the net radiative heat flux, leading to an additional cooling of the sea surface. The resulting SSTs then also form part of the atmosphere–ocean feedback in EBUSs, as described in Nicholson (2010) for the Benguela upwelling region.
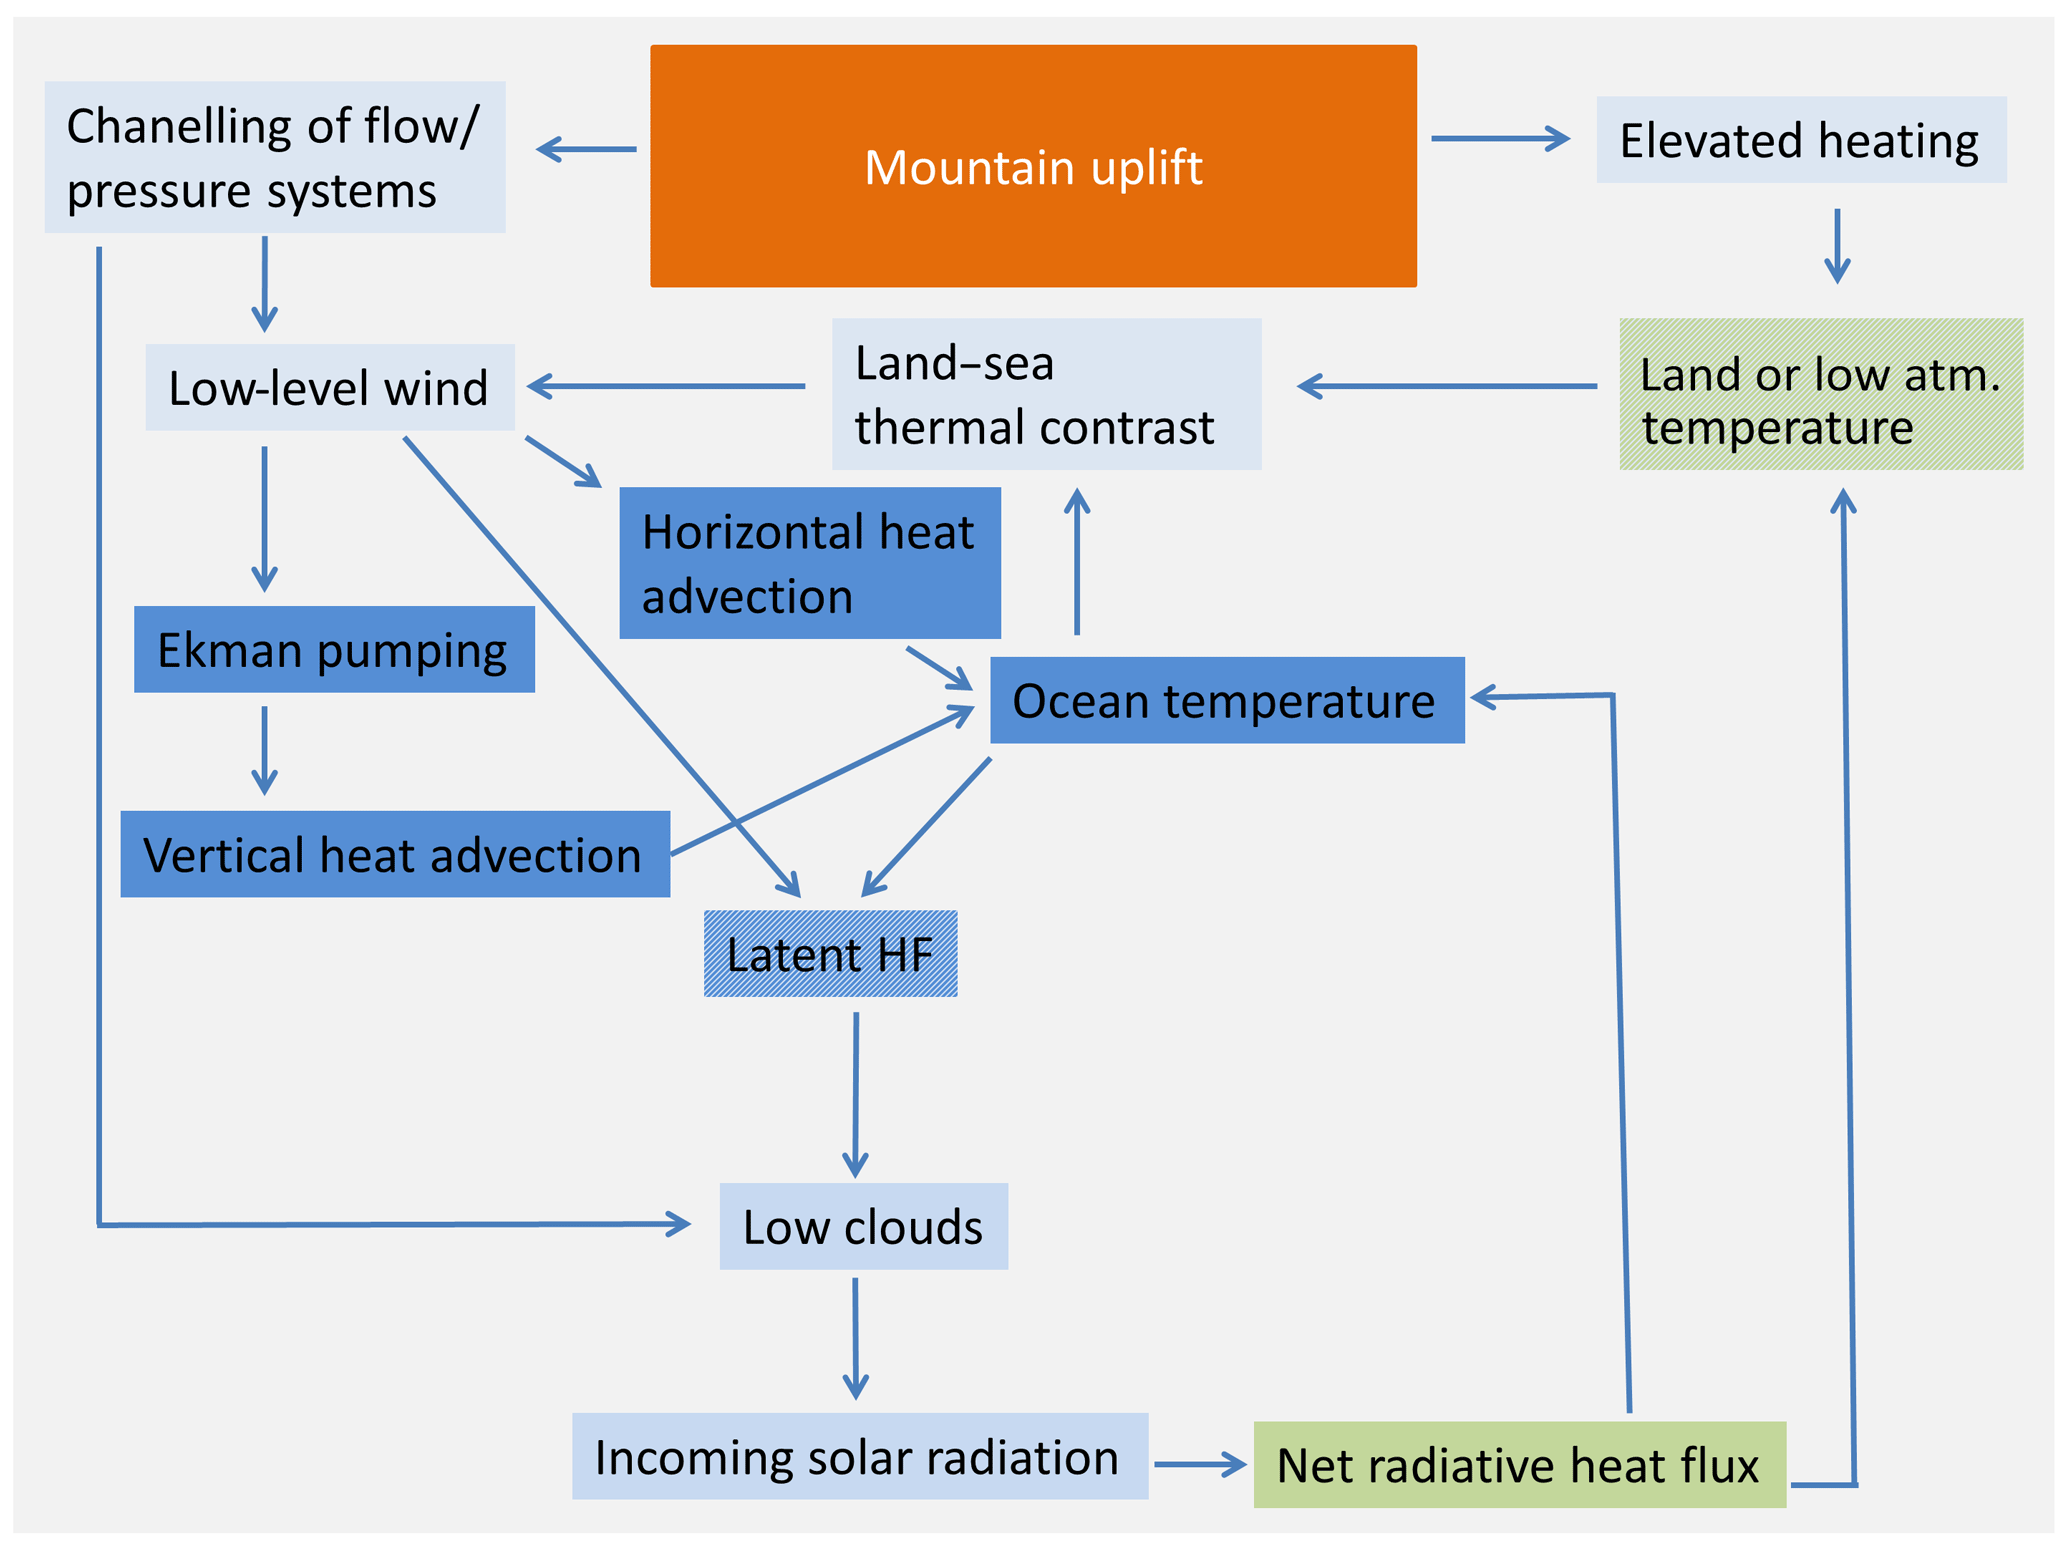
Figure 19Summary of relevant processes interacting in the case of continental-scale mountain uplift considered in this study. The complexity of the processes lead to negative, as well as positive, feedback mechanisms that also depend on the region characteristics. Colors: light blue – atmospheric processes, blue – oceanic processes, green – land-surface-related processes, orange – forcing (i.e., mountain uplift).
Nevertheless, one has to be aware of model deficiencies that might have a strong impact on the effect of boundary condition changes on climate dynamics, as well as on the magnitude of different effects and feedbacks.
According to Kiehl et al. (2006), CCSM3 shows an enhanced low-cloud feedback due to deficiencies in the simulation of boundary layer mixing processes with enhanced low-cloud cover in their control simulation. Hence the ocean-atmosphere feedback might be overestimated. On the other hand, the intensity of coastal jet, upwelling intensity and hence also the changes in those variables might be underestimated due to a model that is too coarse grid (see Sect. 5.1). Proxy records of the major EBUSs indicate a SST cooling of around 3–10 ∘C (Marlow et al., 2000; Dekens et al., 2007; Rommerskirchen et al., 2011; Miller and Tziperman, 2017), which is larger than the cooling simulated in our model experiments (1–3 ∘C). Hence mountain uplift is most likely only one piece of the puzzle to Miocene–Pliocene cooling of eastern boundary upwelling systems, but its contribution might be larger in reality due to the aforementioned model deficiencies.
In almost all studied regions with coastal mountains and prevailing coastal parallel winds (Benguela, California and southern Humboldt), we find intensified low-level winds and an intensification of Ekman pumping velocities with mountain uplift, most likely related to the thermal wind relationship, following elevated heating, as explained in Jung et al. (2014).
To which extent this leads to SST cooling depends on a variety of influencing factors and feedback mechanisms that differ for the different upwelling regions.
-
Benguela region: the coastal low-level jet and Ekman pumping intensification are the dominant factors in controlling the SST response, but horizontal heat advection also contributes to upper-ocean cooling.
-
California region: the coastal low-level jet and Ekman pumping intensify during the summer season, but horizontal heat advection, as well as the net radiative effect due to an increased low-cloud coverage, is likely more important for SST cooling.
-
Humboldt region: the weak ocean stratification hinders SST response to changing upwelling velocities. In the Chile upwelling area, horizontal heat advection is dominant. Upper-ocean warming is observed, despite an intensified coastal low-level jet and strengthened upwelling activity. In the Peru upwelling zone the net radiative cooling effect is dominant, which is also caused by a low-level cloud coverage increase.
It could be demonstrated that mountain uplift is important for upper-ocean temperature evolution in the area of eastern boundary currents. The relative importance of the different feedbacks and processes depends on the upwelling region (e.g., mountain elevation, ocean stratification) but might also be influenced by model resolution, since the response of upwelling to low-level wind intensification in a global GCM is limited and most likely underestimated.
Post-processed model data that is relevant for this publication will be made publicly available in the Pangaea database (http://www.pangaea.de, last access: 20 January 2020).
The supplement related to this article is available online at: https://doi.org/10.5194/cp-16-161-2020-supplement.
GJ and MP designed the experiments. GJ set up the model, performed the simulations and the output analysis, and prepared the article with contributions from MP.
The authors declare that they have no conflict of interest.
The authors would like to thank Gary Strand of NCAR for making available the spun-up preindustrial control run restart files and Matthew Hecht from the Los Alamos National Lab for his assistance with the production of mapping files for this model version. Thanks to Bruce Briegleb (NCAR) for making preindustrial aerosol data available.
The CCSM3 experiments were run on the SGI Altix Supercomputer of the “Norddeutscher Verbund für Hoch- und Höchstleistungsrechnen” (HLRN). Model setup and output analysis and plotting were performed using cran R (R Core Team, 2016) and NCL software.
This research has been supported by the Deutsche
Forschungsgemeinschaft (DFG) Research Center/Excellence Cluster
“The Ocean in the Earth System”.
The article processing charges for this open-access publication were covered by the University of Bremen.
This paper was edited by Yannick Donnadieu and reviewed by two anonymous referees.
Andrade, C. A. and Barton, E. D.: The guajira upwelling system, Cont. Shelf Res., 25, 1003–1022, https://doi.org/10.1016/j.csr.2004.12.012, 2005.
Arnold, N. P. and Tziperman, E.: Reductions in midlatitude upwelling-favorable winds implied by weaker large-scale pliocene sst gradients, Paleoceanography, 31, 27–39, https://doi.org/10.1002/2015PA002806, 2016.
Barnes, J. B., Ehlers, T. A., Insel, N., McQuarrie, N., and Poulsen, C. J.: Linking orography, climate, and exhumation across the central andes, Geology, 40, 1135–1138, https://doi.org/10.1130/G33229.1, 2012.
Belmadani, A., Echevin, V., Codron, F., Takahashi, K., and Junquas, C.: What dynamics drive future wind scenarios for coastal upwelling off peru and chile?, Clim. Dynam., 43, 1893–1914, https://doi.org/10.1007/s00382-013-2015-2, 2014.
Bergh, E. W., Compton, J. S., and Frenzel, P.: Late neogene foraminifera from the northern namibian continental shelf and the transition to the benguela upwelling system, J. Afr. Earth Sci., 141, 33–48, https://doi.org/10.1016/j.jafrearsci.2018.01.018, 2018.
Bissig, T. and Riquelme, R.: Andean uplift and climate evolution in the southern atacama desert deduced from geomorphology and supergene alunite-group minerals, Earth Planet. Sc. Lett., 299, 447–457, https://doi.org/10.1016/j.epsl.2010.09.028, 2010.
Blisniuk, P. M., Stern, L. A., Chamberlain, C. P., Idleman, B., and Zeitler, P. K.: Climatic and ecologic changes during miocene surface uplift in the southern patagonian andes, Earth Planet. Sc. Lett., 230, 125–142, https://doi.org/10.1016/j.epsl.2004.11.015, 2005.
Bonan, G. B., Levis, S., Sitch, S., Vertenstein, M., and Oleson, K. W.: A dynamic global vegetation model for use with climate models: Concepts and description of simulated vegetation dynamics, Glob. Change Biol., 9, 1543–1566, https://doi.org/10.1046/j.1365-2486.2003.00681.x, 2003.
Braconnot, P., Otto-Bliesner, B., Harrison, S., Joussaume, S., Peterchmitt, J.-Y., Abe-Ouchi, A., Crucifix, M., Driesschaert, E., Fichefet, Th., Hewitt, C. D., Kageyama, M., Kitoh, A., Laîné, A., Loutre, M.-F., Marti, O., Merkel, U., Ramstein, G., Valdes, P., Weber, S. L., Yu, Y., and Zhao, Y.: Results of PMIP2 coupled simulations of the Mid-Holocene and Last Glacial Maximum – Part 1: experiments and large-scale features, Clim. Past, 3, 261–277, https://doi.org/10.5194/cp-3-261-2007, 2007.
Burk, S. D. and Thompson, W. T.: The summertime low-level jet and marine boundary layer structure along the california coast, Mon. Weather Rev., 124, 668–686, https://doi.org/10.1175/1520-0493(1996)124<0668:TSLLJA>2.0.CO;2, 1996.
Carton, J. A., Chepurin, G. A., and Chen, L. G.: Soda3: A new ocean climate reanalysis, J. Climate, 31, 6967–6983, https://doi.org/10.1175/Jcli-D-18-0149.1, 2018.
Chavez, F. P. and Messie, M.: A comparison of eastern boundary upwelling ecosystems, Prog. Oceanogr., 83, 80–96, https://doi.org/10.1016/j.pocean.2009.07.032, 2009.
Checkley, D. M. and Barth, J. A.: Patterns and processes in the california current system, Prog. Oceanogr., 83, 49–64, https://doi.org/10.1016/j.pocean.2009.07.028, 2009.
Clarke, J. D. A.: Antiquity of aridity in the chilean atacama desert, Geomorphology, 73, 101–114, https://doi.org/10.1016/j.geomorph.2005.06.008, 2006.
Collins, W. D., Bitz, C. M., Blackmon, M. L., Bonan, G. B., Bretherton, C. S., Carton, J. A., Chang, P., Doney, S. C., Hack, J. J., Henderson, T. B., Kiehl, J. T., Large, W. G., McKenna, D. S., Santer, B. D., and Smith, R. D.: The community climate system model version 3 (ccsm3), J. Climate, 19, 2122–2143, https://doi.org/10.1175/Jcli3761.1, 2006.
Danabasoglu, G., Large, W. G., Tribbia, J. J., Gent, P. R., Briegleb, B. P., and McWilliams, J. C.: Diurnal coupling in the tropical oceans of ccsm3, J. Climate, 19, 2347–2365, https://doi.org/10.1175/Jcli3739.1, 2006.
Dekens, P. S., Ravelo, A. C., and McCarthy, M. D.: Warm upwelling regions in the pliocene warm period, Paleoceanography, 22, PA3211, https://doi.org/10.1029/2006PA001394, 2007.
Doyle, J. D.: The influence of mesoscale orography on a coastal jet and rainband, Mon. Weather Rev., 125, 1465–1488, https://doi.org/10.1175/1520-0493(1997)125<1465:Tiomoo>2.0.Co;2, 1997.
Dupont, L. M., Rommerskirchen, F., Mollenhauer, G., and Schefuß, E.: Miocene to pliocene changes in south african hydrology and vegetation in relation to the expansion of c-4 plants, Earth Planet. Sc. Lett., 375, 408–417, https://doi.org/10.1016/j.epsl.2013.06.005, 2013.
Ehlers, T. A. and Poulsen, C. J.: Influence of andean uplift on climate and paleoaltimetry estimates, Earth Planet. Sc. Lett., 281, 238–248, https://doi.org/10.1016/j.epsl.2009.02.026, 2009.
Feng, R. and Poulsen, C. J.: Andean elevation control on tropical pacific climate and enso, Paleoceanography, 29, 795–809, https://doi.org/10.1002/2014pa002640, 2014.
Foster, G. L., Lunt, D. J., and Parrish, R. R.: Mountain uplift and the glaciation of North America – a sensitivity study, Clim. Past, 6, 707–717, https://doi.org/10.5194/cp-6-707-2010, 2010.
Garcia-Reyes, M. and Largier, J. L.: Seasonality of coastal upwelling off central and northern california: New insights, including temporal and spatial variability, J. Geophys. Res.-Oceans, 117, C03028, https://doi.org/10.1029/2011jc007629, 2012.
Garreaud, R. D. and Munoz, R. C.: The low-level jet off the west coast of subtropical south america: Structure and variability, Mon. Weather Rev., 133, 2246–2261, https://doi.org/10.1175/Mwr2972.1, 2005.
Garzione, C. N.: Rise of the andes, Science, 321, 1295–1295, https://doi.org/10.1126/science.1148615, 2008.
Garzione, C. N., Molnar, P., Libarkin, J. C., and MacFadden, B. J.: Rapid late miocene rise of the bolivian altiplano: Evidence for removal of mantle lithosphere, Earth Planet. Sc. Lett., 241, 543–556, https://doi.org/10.1016/j.epsl.2005.11.026, 2006.
Garzione, C. N., Auerbach, D. J., Smith, J. J. S., Rosario, J. J., Passey, B. H., Jordan, T. E., and Eiler, J. M.: Clumped isotope evidence for diachronous surface cooling of the altiplano and pulsed surface uplift of the central andes, Earth Planet. Sc. Lett., 393, 173–181, https://doi.org/10.1016/j.epsl.2014.02.029, 2014.
Gent, P. R. and Mcwilliams, J. C.: Isopycnal mixing in ocean circulation models, J. Phys. Oceanogr., 20, 150–155, https://doi.org/10.1175/1520-0485(1990)020<0150:Imiocm>2.0.Co;2, 1990.
Ghosh, P., Garzione, C. N., and Eiler, J. M.: Rapid uplift of the altiplano revealed through c-13-o-18 bonds in paleosol carbonates, Science, 311, 511–515, https://doi.org/10.1126/science.1119365, 2006.
Gregory-Wodzicki, K. M.: Uplift history of the central and northern andes: A review, Geol. Soc. Am. Bull., 112, 1091–1105, https://doi.org/10.1130/0016-7606(2000)112<1091:Uhotca>2.3.Co;2, 2000.
Griffies, S. M.: The gent-mcwilliams skew flux, J. Phys. Oceanogr., 28, 831–841, https://doi.org/10.1175/1520-0485(1998)028<0831:Tgmsf>2.0.Co;2, 1998.
Grimmer, F., Dupont, L., Lamy, F., Jung, G., González, C., and Wefer, G.: Early Pliocene vegetation and hydrology changes in western equatorial South America, Clim. Past, 14, 1739–1754, https://doi.org/10.5194/cp-14-1739-2018, 2018.
Handiani, D., Paul, A., Prange, M., Merkel, U., Dupont, L., and Zhang, X.: Tropical vegetation response to Heinrich Event 1 as simulated with the UVic ESCM and CCSM3, Clim. Past, 9, 1683–1696, https://doi.org/10.5194/cp-9-1683-2013, 2013.
Haskell, W. Z., Hammond, D. E., and Prokopenko, M. G.: A dual-tracer approach to estimate upwelling velocity in coastal southern california, Earth Planet. Sc. Lett., 422, 138–149, https://doi.org/10.1016/j.epsl.2015.04.015, 2015a.
Haskell, W. Z., Kadko, D., Hammond, D. E., Knapp, A. N., Prokopenko, M. G., Berelson, W. M., and Capone, D. G.: Upwelling velocity and eddy diffusivity from be-7 measurements used to compare vertical nutrient flux to export poc flux in the eastern tropical south pacific, Mar. Chem., 168, 140–150, https://doi.org/10.1016/j.marchem.2014.10.004, 2015b.
Hoetzel, S., Dupont, L. M., and Wefer, G.: Miocene-pliocene vegetation change in south-western africa (odp site 1081, offshore namibia), Palaeogeogr. Palaeocl., 423, 102–108, https://doi.org/10.1016/j.palaeo.2015.02.002, 2015.
Holt, T. R.: Mesoscale forcing of a boundary layer jet along the california coast, J. Geophys. Res.-Atmos., 101, 4235–4254, https://doi.org/10.1029/95JD03231, 1996.
Hutchings, L., van der Lingen, C. D., Shannon, L. J., Crawford, R. J. M., Verheye, H. M. S., Bartholomae, C. H., van der Plas, A. K., Louw, D., Kreiner, A., Ostrowski, M., Fidel, Q., Barlow, R. G., Lamont, T., Coetzee, J., Shillington, F., Veitch, J., Currie, J. C., and Monteiro, P. M. S.: The benguela current: An ecosystem of four components, Prog. Oceanogr., 83, 15–32, https://doi.org/10.1016/j.pocean.2009.07.046, 2009.
Jung, G., Prange, M., and Schulz, M.: Uplift of africa as a potential cause for neogene intensification of the benguela upwelling system, Nat. Geosci., 7, 741–747, https://doi.org/10.1038/ngeo2249, 2014.
Jung, G., Prange, M., and Schulz, M.: Influence of topography on tropical african vegetation coverage, Clim. Dynam., 46, 2535–2549, https://doi.org/10.1007/s00382-015-2716-9, 2016.
Karstensen, J. and Ulloa, O.: Peru-chile current system, in: Ocean currents, edited by: Steele, J., Thorpe, S., and Turekian, K., Academic Press, London, Burlington, San Diego, 385–392, 2009.
Keller, G., Adatte, T., Hollis, C., Ordonez, M., Zambrano, I., Jimenez, N., Stinnesbeck, W., Aleman, A., and HaleErlich, W.: The cretaceous/tertiary boundary event in ecuador: Reduced biotic effects due to eastern boundary current setting, Mar. Micropaleontol., 31, 97–133, https://doi.org/10.1016/S0377-8398(96)00061-8, 1997.
Kiehl, J. T., Shields, C. A., Hack, J. J., and Collins, W. D.: The climate sensitivity of the community climate system model version 3 (ccsm3), J. Climate, 19, 2584–2596, https://doi.org/10.1175/jcli3747.1, 2006.
Large, W. G., Mcwilliams, J. C., and Doney, S. C.: Oceanic vertical mixing – a review and a model with a nonlocal boundary-layer parameterization, Rev. Geophys., 32, 363–403, https://doi.org/10.1029/94rg01872, 1994.
Leier, A., McQuarrie, N., Garzione, C., and Eiler, J.: Stable isotope evidence for multiple pulses of rapid surface uplift in the central andes, bolivia, Earth Planet. Sc. Lett., 371, 49–58, https://doi.org/10.1016/j.epsl.2013.04.025, 2013.
Levis, S., Bonan, G., Vertenstein, M., and Oleson, K.: The community land model's dynamic global vegetation model (clm-dgvm): Technical description and user's guide, NCAR Tech. Note TN-459+ IA, 50, National Center for Atmospheric Research, Boulder, Colorado, USA, 2004.
Ma, J., Xu, S., and Wang, B.: Warm bias of sea surface temperature in eastern boundary current regions – a study of effects of horizontal resolution in cesm, Ocean Dynam., 69, 939–954, https://doi.org/10.1007/s10236-019-01280-4, 2019.
Marlow, J. R., Lange, C. B., Wefer, G., and Rosell-Mele, A.: Upwelling intensification as part of the pliocene-pleistocene climate transition, Science, 290, 2288–2291, https://doi.org/10.1126/science.290.5500.2288, 2000.
Miller, M. D. and Tziperman, E.: The effect of changes in surface winds and ocean stratification on coastal upwelling and sea surface temperatures in the pliocene, Paleoceanography, 32, 371–383, https://doi.org/10.1002/2016pa002996, 2017.
Montecino, V. and Lange, C. B.: The humboldt current system: Ecosystem components and processes, fisheries, and sediment studies, Prog. Oceanogr., 83, 65–79, https://doi.org/10.1016/j.pocean.2009.07.041, 2009.
Montgomery, D. R.: Compressional uplift in the central california coast ranges, Geology, 21, 543–546, https://doi.org/10.1130/0091-7613(1993)021<0543:Cuitcc>2.3.Co;2, 1993.
Montoya-Sanchez, R. A., Devis-Morales, A., Bernal, G., and Poveda, G.: Seasonal and intraseasonal variability of active and quiescent upwelling events in the guajira system, southern caribbean sea, Cont. Shelf Res., 171, 97–112, https://doi.org/10.1016/j.csr.2018.10.006, 2018.
Moucha, R. and Forte, A. M.: Changes in african topography driven by mantle convection, Nat. Geosci., 4, 707–712, https://doi.org/10.1038/ngeo1235, 2011.
Mulch, A., Uba, C. E., Strecker, M. R., Schoenberg, R., and Chamberlain, C. P.: Late miocene climate variability and surface elevation in the central andes, Earth Planet. Sc. Lett., 290, 173–182, https://doi.org/10.1016/j.epsl.2009.12.019, 2010.
Munoz, R. C. and Garreaud, R. D.: Dynamics of the low-level jet off the west coast of subtropical south america, Mon. Weather Rev., 133, 3661–3677, https://doi.org/10.1175/Mwr3074.1, 2005.
Nicholson, S. E.: A low-level jet along the benguela coast, an integral part of the benguela current ecosystem, Climatic Change, 99, 613–624, https://doi.org/10.1007/s10584-009-9678-z, 2010.
Nyblade, A. A. and Robinson, S. W.: The african superswell, Geophys. Res. Lett., 21, 765–768, https://doi.org/10.1038/26212, 1994.
Oleson, K. W., Niu, G. Y., Yang, Z. L., Lawrence, D. M., Thornton, P. E., Lawrence, P. J., Stockli, R., Dickinson, R. E., Bonan, G. B., Levis, S., Dai, A., and Qian, T.: Improvements to the community land model and their impact on the hydrological cycle, J. Geophys. Res.-Biogeo., 113, G01021, https://doi.org/10.1029/2007JG000563, 2008.
Page, B. M., Thompson, G. A., and Coleman, R. G.: Overview: Late cenozoic tectonics of the central and southern coast ranges of california, Geol. Soc. Am. Bull., 111, 790–790, 1999.
Palma, E. D. and Matano, R. P.: Disentangling the upwelling mechanisms of the south brazil bight, Cont. Shelf Res., 29, 1525–1534, https://doi.org/10.1016/j.csr.2009.04.002, 2009.
Parish, T. R.: Forcing of the summertime low-level jet along the california coast, J. Appl. Meteorol., 39, 2421–2433, https://doi.org/10.1175/1520-0450(2000)039<2421:Fotsll>2.0.Co;2, 2000.
Pickett, M. H. and Paduan, J. D.: Ekman transport and pumping in the california current based on the u.S. Navy's high-resolution atmospheric model (coamps), J. Geophys. Res.-Oceans, 108, 3327, https://doi.org/10.1029/2003jc001902, 2003.
Pik, R.: East africa on the rise, Nat. Geosci., 4, 660–661, https://doi.org/10.1080/00220388.2018.1430774, 2011.
Potter, P. E. and Szatmari, P.: Global miocene tectonics and the modern world, Earth-Sci. Rev., 96, 279–295, https://doi.org/10.1016/j.earscirev.2009.07.003, 2009.
Potter, S. F., Dawson, E. J., and Frierson, D. M. W.: Southern african orography impacts on low clouds and the atlantic itcz in a coupled model, Geophys. Res. Lett., 44, 3283–3289, https://doi.org/10.1002/2017GL073098, 2017.
Rachmayani, R., Prange, M., and Schulz, M.: North African vegetation–precipitation feedback in early and mid-Holocene climate simulations with CCSM3-DGVM, Clim. Past, 11, 175–185, https://doi.org/10.5194/cp-11-175-2015, 2015.
R Core Team: R: A language and environment for statistical computing. R Foundation for Statistical Computing, Vienna, Austria, available at: http://www.R-project.org/ (last access: 20 January 2020), 2016.
Renault, L., Dewitte, B., Falvey, M., Garreaud, R., Echevin, V., and Bonjean, F.: Impact of atmospheric coastal jet off central chile on sea surface temperature from satellite observations (2000–2007), J. Geophys. Res.-Oceans, 114, C08006, https://doi.org/10.1029/2008jc005083, 2009.
Richter, I. and Mechoso, C. R.: Orographic influences on the annual cycle of namibian stratocumulus clouds, Geophys. Res. Lett., 31, L24108, https://doi.org/10.1029/2004gl020814, 2004.
Richter, I. and Mechoso, C. R.: Orographic influences on subtropical stratocumulus, J. Atmos. Sci., 63, 2585–2601, https://doi.org/10.1175/Jas3756.1, 2006.
Roberts, E. M., Stevens, N. J., O'Connor, P. M., Dirks, P. H. G. M., Gottfried, M. D., Clyde, W. C., Armstrong, R. A., Kemp, A. I. S., and Hemming, S.: Initiation of the western branch of the east african rift coeval with the eastern branch, Nat. Geosci., 5, 289–294, https://doi.org/10.1038/ngeo1432, 2012.
Roberts, G. G. and White, N.: Estimating uplift rate histories from river profiles using african examples, J. Geophys. Res.-Sol. Ea., 115, B02406, https://doi.org/10.1029/2009JB006692, 2010.
Rommerskirchen, F., Condon, T., Mollenhauer, G., Dupont, L., and Schefuß, E.: Miocene to pliocene development of surface and subsurface temperatures in the benguela current system, Paleoceanography, 26, Pa3216, https://doi.org/10.1029/2010pa002074, 2011.
Rouault, M., Florenchie, P., Fauchereau, N., and Reason, C. J. C.: South east tropical atlantic warm events and southern african rainfall, Geophys. Res. Lett., 30, 8009, https://doi.org/10.1029/2002gl014840, 2003.
Rueda-Roa, D. T. and Muller-Karger, F. E.: The southern caribbean upwelling system: Sea surface temperature, wind forcing and chlorophyll concentration patterns, Deep-Sea Res. Pt. I, 78, 102–114, https://doi.org/10.1016/j.dsr.2013.04.008, 2013.
Scotese, C. R.: Continental drift: (0–750 million years), PALEOMAP Project, University of Texas at Arlington, Arlington, Texas, USA, 1998.
Sepulchre, P., Ramstein, G., Fluteau, F., Schuster, M., Tiercelin, J. J., and Brunet, M.: Tectonic uplift and eastern africa aridification, Science, 313, 1419–1423, https://doi.org/10.1126/science.1129158, 2006.
Sepulchre, P., Sloan, L. C., Snyder, M., and Fiechter, J.: Impacts of andean uplift on the humboldt current system: A climate model sensitivity study, Paleoceanography, 24, PA4215, https://doi.org/10.1029/2008PA001668, 2009.
Seranne, M. and Anka, Z.: South atlantic continental margins of africa: A comparison of the tectonic vs climate interplay on the evolution of equatorial west africa and sw africa margins, J. Afr. Earth Sci., 43, 283–300, https://doi.org/10.1016/j.jafrearsci.2005.07.010, 2005.
Small, R. J., Curchitser, E., Hedstrom, K., Kauffman, B., and Large, W. G.: The benguela upwelling system: Quantifying the sensitivity to resolution and coastal wind representation in a global climate model, J. Climate, 28, 9409–9432, https://doi.org/10.1175/Jcli-D-15-0192.1, 2015.
Steph, S., Tiedemann, R., Prange, M., Groeneveld, J., Schulz, M., Timmermann, A., Nurnberg, D., Ruhlemann, C., Saukel, C., and Haug, G. H.: Early pliocene increase in thermohaline overturning: A precondition for the development of the modern equatorial pacific cold tongue, Paleoceanography, 25, PA2202, https://doi.org/10.1029/2008pa001645, 2010.
Strecker, M. R., Alonso, R. N., Bookhagen, B., Carrapa, B., Hilley, G. E., Sobel, E. R., and Trauth, M. H.: Tectonics and climate of the southern central andes, Annu. Rev. Earth Pl. Sc., 35, 747–787, https://doi.org/10.1146/annurev.earth.35.031306.140158, 2007.
Tim, N., Zorita, E., and Hünicke, B.: Decadal variability and trends of the Benguela upwelling system as simulated in a high-resolution ocean simulation, Ocean Sci., 11, 483–502, https://doi.org/10.5194/os-11-483-2015, 2015.
Vavrus, S. and Waliser, D.: An improved parametrization for simulating arctic cloud amount in the ccsm3 climate model, J. Climate, 21, 5673–5687, https://doi.org/10.1175/2008JCLI2299.1, 2008.
Veitch, J., Penven, P., and Shillington, F.: Modeling equilibrium dynamics of the benguela current system, J. Phys. Oceanogr., 40, 1942–1964, https://doi.org/10.1175/2010jpo4382.1, 2010.
White, L. D., Garrison, R. E., and Barron, J. A.: Miocene intensification of upwelling along the california margin as recorded in siliceous facies of the monterey formation and offshore dsdp sites, in: Upwelling systems: Evolution since the early miocene, edited by: Summerhayes, C. P., Prell, W. L., and Emeis, K. C., Geological Society, London, Special Publications, 429–442, 1992.
Wichura, H., Bousquet, R., Oberhansli, R., Strecker, M. R., and Trauth, M. H.: Evidence for middle miocene uplift of the east african plateau, Geology, 38, 543–546, https://doi.org/10.1130/G31022.1, 2010.
Wichura, H., Jacobs, L. L., Lin, A., Polcyn, M. J., Manthi, F. K., Winkler, D. A., Strecker, M. R., and Clemens, M.: A 17-my-old whale constrains onset of uplift and climate change in east africa, P. Natl. Acad. Sci. USA, 112, 3910–3915, https://doi.org/10.1073/pnas.1421502112, 2015.