the Creative Commons Attribution 4.0 License.
the Creative Commons Attribution 4.0 License.
 | 14 Feb 2020
Late Pliocene Cordilleran Ice Sheet development with warm northeast Pacific sea surface temperatures
Maria Luisa Sánchez-Montes
Erin L. McClymont
Jeremy M. Lloyd
Juliane Müller
Ellen A. Cowan
Coralie Zorzi
The initiation and evolution of the Cordilleran Ice Sheet are relatively poorly constrained. International Ocean Discovery Program (IODP) Expedition 341 recovered marine sediments at Site U1417 in the Gulf of Alaska (GOA). Here we present alkenone-derived sea surface temperature (SST) analyses alongside ice-rafted debris (IRD), terrigenous, and marine organic matter inputs to the GOA through the late Pliocene and early Pleistocene. The first IRD contribution from tidewater glaciers in southwest Alaska is recorded at 2.9 Ma, indicating that the Cordilleran Ice Sheet extent increased in the late Pliocene. A higher occurrence of IRD and higher sedimentation rates in the GOA during the early Pleistocene, at 2.5 Ma, occur in synchrony with SSTs warming on the order of 1 ∘C relative to the Pliocene. All records show a high degree of variability in the early Pleistocene, indicating highly efficient ocean–climate–ice interactions through warm SST–ocean evaporation–orographic precipitation–ice growth mechanisms. A climatic shift towards ocean circulation in the subarctic Pacific similar to the pattern observed during negative Pacific Decadal Oscillation (PDO) conditions today occurs with the development of more extensive Cordilleran glaciation and may have played a role through increased moisture supply to the subarctic Pacific. The drop in atmospheric CO2 concentrations since 2.8 Ma is suggested as one of the main forcing mechanisms driving the Cordilleran glaciation.
- Article
(3089 KB) -
Supplement
(677 KB) - BibTeX
- EndNote


During the Neogene, the global climate transitioned from relatively warm to cooler conditions that enabled the development of ice masses in both hemispheres (Zachos et al., 2001). The Mid-Piacenzian Warm Period (MPWPl; 3.3–3.0 Ma) interrupts this cooling trend, with global temperatures around 2–3 ∘C above pre-industrial levels (Jansen et al., 2007; Haywood and Valdes, 2004) and more intense warming at higher latitudes (Haywood et al., 2013; Dolan et al., 2015). The MPWP has been suggested as a potential analogue for the 21st century climate due to the atmospheric CO2 concentrations (400 ppmv) and largely equivalent continental configurations relative to the present (Salzmann et al., 2011; Raymo et al., 1996: Jansen et al., 2007).
Overall, the mid-Pliocene ice masses were smaller than today (Dolan et al., 2011). However, the marine isotope stage (MIS) M2 (∼3.3–3.26 Ma) event is characterized by a dramatic cooling in the Atlantic Ocean and is considered to be an unsuccessful attempt at a Pleistocene-style glaciation (De Schepper et al., 2013). The later onset (oNHG) or intensification (iNHG) of the Northern Hemisphere glaciation is marked by the expansion of the Laurentide, Greenland, and Scandinavian ice sheets around 2.5 Ma, as indicated by ice-rafted debris (IRD) records from the North Atlantic Ocean (i.e. Shackleton et al., 1984) and the advance of the Cordilleran Ice Sheet at 2.7 Ma inferred from a terrestrial record (Hidy et al., 2013). It is still debated whether climatic or tectonic forcing was the main driver of the NHG (Haug et al., 2005), as it cannot be explained solely by changes in insolation (Brigham-Grette et al., 2013). The decrease in atmospheric CO2 concentrations and radiative forcing at 2.8 Ma has been identified as a potential mechanism for climate cooling at the oNHG (Seki et al., 2010a; Martínez-Botí et al., 2015). However, the timing of the oNHG varies between locations based on IRD delivery, and at some locations the oNHG has been set as far back as 3.5 Ma (Nordic Seas; Mudelsee and Raymo, 2005). A number of studies consider orogenic (Nie et al., 2008) and continental (Haug et al., 2005; Fedorov et al., 2013) changes as well as changes in heat transport to high northern latitudes during the Pliocene (Haug et al., 2005; Nie et al., 2008; Lawrence et al., 2010; Bringham-Grette et al., 2013, Fedorov et al., 2013), which could help explain the development of the oNHG during the Pliocene–Pleistocene transition.
There is evidence that the Cordilleran Ice Sheet of North America expanded across the period of the oNHG. This is indicated by glacial deposits in terrestrial records, which date the Cordilleran expansion between 2.9 and 2.6 Ma (i.e. Hidy et al., 2013; Duk-Rodkin et al., 2004), and the enhanced delivery of terrigenous sediments (IRD) to the Gulf of Alaska (GOA; northeast Pacific Ocean) (Site 887) since 2.6 Ma, interpreted as evidence for ice sheet growth (Gulick et al., 2015). The sediments of the GOA record Cordilleran glaciation in the St. Elias Mountains, at present the highest coastal mountain range in the world (Enkelmann et al., 2015). It has been proposed that the uplift of the St. Elias Mountains from the early Pliocene to early Pleistocene led to an increase in orographic precipitation and a subsequent increase in sedimentation rates in the GOA (Enkelmann et al., 2015). Mountain glaciation may have developed in the St. Elias Mountains as early as 5.5 Ma (Reece et al., 2011), ultimately developing tidewater glaciers, with the high erosion pathway shifting to the southern St. Elias Mountains at 2.6 Ma (Enkelmann et al., 2015). Rather than a tectonic control on Cordilleran glaciation, an alternative explanation could be the reduced radiative forcing and climate cooling associated with the decline in atmospheric CO2 at 2.8 Ma. However, it is difficult to resolve these hypotheses in the absence of high-resolution data for both ice sheet extent and climate from the GOA.
Here, we present a new multiproxy data set obtained from IODP core Site U1417 (56∘57.58′ N, 147∘6.58′ W; water depth 4218 m; Fig. 1) in the GOA. The core site allows for the examination of the land–ocean interactions associated with advance and retreat phases of the Cordilleran Ice Sheet across the Pliocene–Pleistocene transition in the context of mountain uplift. The sediments were collected during IODP Expedition 341 (Expedition 341 Scientists, 2014) and were analysed for the time interval from 4 to 1.7 Myr ago to reconstruct sea surface conditions using alkenone proxies, inputs and properties of IRD, and terrestrial organic matter input using the abundance of long-chain n-alkanes and palynological analysis.
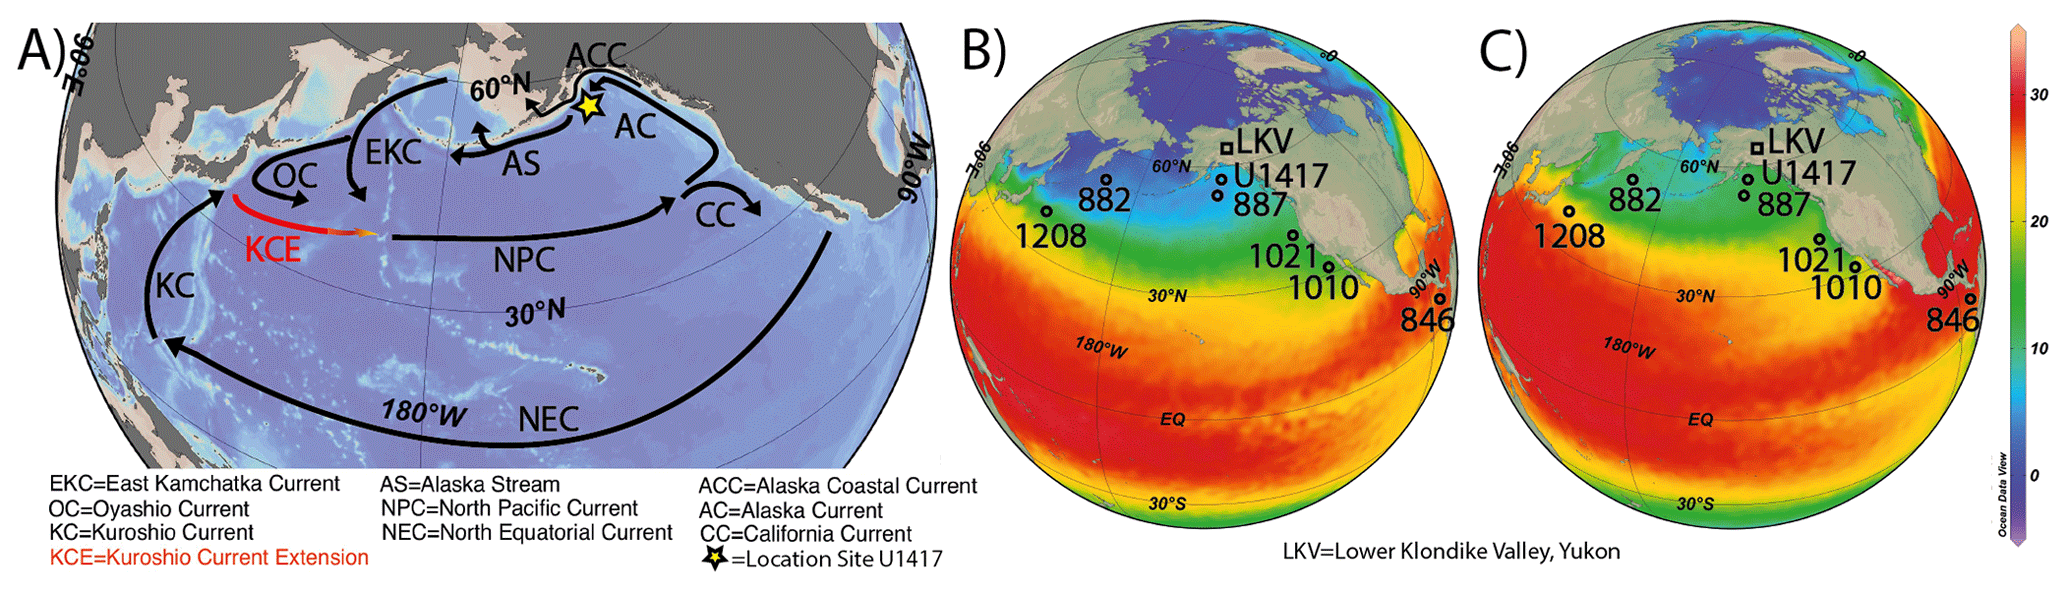
Figure 1Map of modern ocean circulation and SSTs. (a) Modern North Pacific Ocean circulation, (b) December and (c) September 1955–2013 SST average centred in the North Pacific Ocean (NOAA WOA13; Locarnini et al., 2013), and core and sample sites discussed in this study. Map made using Ocean Data View (Schlitzer, 2018).
The Gulf of Alaska (GOA)
The GOA extends from the Alaska Peninsula in the west to the Alexander Archipelago in the east (Hogan, 2013), delimited by the Bering Sea on the west and the Alaskan coast in the north and east, which is, in turn, bounded to the north by the Pacific Mountain System (Molnia, 2008). The south of the GOA connects with the North Pacific Ocean (Fig. 1). Glaciers cover 20 % of the Gulf of Alaska watershed (Spies, 2007), and the major rivers draining the St. Elias and Chugach mountains towards the GOA (the Alsek River and the Copper River) are fed by meltwater discharge which peaks in August (Weingartner, 2007). The GOA mean annual freshwater discharge derives from high precipitation, runoff, and snowmelt from watersheds along the SE Alaskan coast (Spies, 2007). High precipitation is due in part to the proximity of the North Pacific Ocean as a source of moisture and the high topography of the Pacific Mountain System driving orographic precipitation.
The Alaskan Coastal Current (ACC) flows anticlockwise along the GOA coastline and westward to the Bering Sea (Fig. 1a), and its properties are dominated by nutrient and meltwater supply from the coastal Alaskan glaciers (Spies, 2007). Further offshore, the Alaska Current (AC) also flows anticlockwise, controlled in strength by the Alaska Gyre (Kato et al., 2016) (Fig. 1a). The location of Site U1417 rests under the modern influence of the AC (Fig. 1). The Alaskan Gyre is, in turn, influenced by atmospheric circulation via the Aleutian Low (AL) and the Pacific high-pressure systems, which are coupled in an annual cycle. High pressures dominate during the summer season and low pressures dominate during autumn to spring (Hogan, 2013), when the AL also migrates eastward across the North Pacific Ocean, becoming most intense when located in the GOA during winter (Pickart et al., 2009). The coast of Alaska receives high winter precipitation because of the AL winter position and strength (Rodionov et al., 2007) as well as Alaska's high topography, which drives orographic precipitation. The GOA locally receives annual precipitation of ∼800 cm (Powell and Molnia, 1989). During summer, the AL is less intense and almost disappears when it is located in the Bering Sea. A weaker AL is translated into reduced precipitation over the GOA.
A strong winter AL also creates a strong zonal SST gradient in the North Pacific Ocean (Fig. 1b). During winter, the ocean responds to a more intense AL through southward movement of the cold Arctic waters and northward flow of mid-latitude warm waters into the Gulf of Alaska through the AC. During the summer migration of the AL northwards, the GOA registers higher SSTs due to higher insolation on the North Pacific Ocean, and as the zonal SST gradient is reduced, the storms diminish (Pickart et al., 2009) (Fig. 1c).
3.1 Age model and sedimentation rates
The shipboard age model was calculated using magnetostratigraphy (Jaeger et al., 2014; Figs. S1–S3 in the Supplement). The recovery of the Pliocene–early Pleistocene sediments averaged 70 % (Expedition 341 Scientists, 2014), with a number of core breaks in the record. Poor carbonate preservation across the Pliocene and early Pleistocene prevents the production of a higher-resolution stable isotope stratigraphy. The shipboard depth models place all discrete core biscuits to the upper depth range of each core and a continuous core break below; it is possible that the biscuits were originally distributed through the core barrel before recovery on the ship. We have converted the depth scale of our data sets to assume an even distribution of core biscuits and core breaks (Fig. S1), converted these depths to age, and interpolated the ages of the samples between core top and bottom (Figs. 2, S1–S3). The magnetostratigraphy ages were similar between the shipboard and new age model. The Gauss–Matuyama magnetic reversal (2.581±0.02 Ma and 330.76±1 m CCSF-A) was well constrained in multiple holes to provide an important age control point for this study (Fig. S1). The shipboard age model sedimentation rates show a marked but temporary increase between 2.5 and 2.0 Ma, which has been attributed to the first major erosion of the landscape by expansion of the Cordilleran Ice Sheet (Expedition 341 Scientists, 2014). Our new sedimentation rates detail a two-step increase from 2.5 to 2.4 Ma and from 2.4 to 2.0 Ma (Fig. S3).
3.2 Biomarkers
A total of 119 samples between 4 and 1.7 Ma were analysed for biomarkers, which corresponds to an average sampling resolution of 19 kyr. Microwave lipid biomarker extraction of freeze-dried and homogenized sediment was carried out following the method of Kornilova and Rosell-Melé (2003). The total lipid extract was separated into four fractions by silica column chromatography through sequential elution with hexane (3 mL), hexane: dichloromethane (9:1; 1.5 mL), dichloromethane (5.5 mL), and ethylacetate : hexane (20:80; four columns) to obtain n-alkanes, aromatics, ketone, and polar fractions.
The n-alkane fraction was analysed by different sets of gas chromatography (GC) configurations for compound quantification and identification. A Thermo Scientific Trace 1310 gas chromatograph was fitted with a flame ionization detector (GC-FID) and a split–splitless injector. Compressed air is set as the airflow, helium (He) is set as the carrier flow, nitrogen (N) is set as a make-up flow, and hydrogen (H) helps with ignition. The oven temperature was set at 70 ∘C for 2 min, then increased to 170 ∘C at 12 ∘C min−1, then increased to 310 ∘C at 6.0 ∘ C min−1, then held at 310 ∘C for 35 min. N-alkanes were separated using a 60 m×0.25 mm i.d. Restek RXi-5ms column (0.25 µm 5 % diphenyl–95 % dimethyl polysiloxane coating). Compound identification was confirmed using a Thermo Scientific Trace 1310 gas chromatography mass spectrometer (GC-MS) equipped with a programmable temperature vaporizer (PTV) injector. He was used as a carrier flow. The oven temperature programme was set at 60 ∘C for 2 min and then raised at 12 ∘C min−1 until reaching 150 ∘C; it was then raised again to 310 ∘C at 6 ∘C min−1 and held for 25 min. Compounds were quantified with reference to internal standards (5α-cholestane) and normalized to the original extracted dry weight of sediment, as well as to sedimentation rate changes by calculating the mass accumulation rates (MARs). The ratio of higher land-plant-derived long-chain n-alkanes against aquatic-sourced short-chain n-alkanes (TAR) (Eq. 1; Cranwell, 1973) and the carbon preference index (CPI) (Eq. 2; Bray and Evans, 1961) was calculated using GC-FID peak areas of the respective compounds.
High TAR values can be indicative of relative increases in terrigenous organic matter transported to the ocean and/or relative decreases in aquatic microorganism production. The opposite could explain low TAR values. To disentangle the presence of petrogenic organic matter from the fresh n-alkane signal, we include the CPI (Bray and Evans, 1961). A CPI close to 1 indicates mature–petrogenic organic matter sources, such as coal or oil deposits, eroded to the ocean. Higher CPI values indicate a fresher or relatively newly produced organic matter transported to the ocean. This distinction may be important in the GOA, where the onshore bedrock includes units with high contents of terrigenous organic matter (e.g. the Yakutat Terrane; Childress, 2016; Walinsky et al., 2009).
Alkenones (ketone fractions) were quantified by a GC coupled with chemical ionization mass spectrometry (GC-CIMS), adapted from the method of Rosell-Melé et al. (1995). Analyses were performed using a Trace Ultra gas chromatograph directly coupled to a Thermo DSQ single quadrupole mass spectrometer, fitted with a programmed temperature vaporizing (PTV) injector; 1.2 mL of sample is injected. Alkenones were separated using a 30 m×0.25 mm i.d. Restek RXi-5ms column (0.25 µm 5 % diphenyl–95 % dimethyl polysiloxane coating). He was employed as the carrier gas (2 mL min−1). The injector was held at 120 ∘C and splitless mode (1.2 min) during injection, then immediately temperature-programmed from 120 to 310 ∘C at 10 ∘C s−1, and then held for 0.6 min. The oven was programmed to hold at 175 ∘C for 1.7 min, then increased to 310 ∘C at 11 ∘C min−1, and held at 310 ∘C for 12 min. The mass spectrometer was operated in positive chemical ionization mode (PICI) using high-purity anhydrous ammonia (N6.0, BOC) introduced to the ion source through the CI gas inlet. Selected ion monitoring was performed, targeting the eight ions corresponding to the adducts of the target C37 and C38 alkenones and the internal standard (2-nonadecanone), each with a selected ion monitoring (SIM) width of 1 m z−1 and a dwell time of 30 min. The targets (m z−1) were 300 (2-nonadecanone), 544 (C37:4), 546 (C37:3), and 548 (C37:2), as detailed by Rosell-Melé et al. (1995).
The alkenone U′ index has been converted into SST according to the core-top to annual mean SST correlation constructed with samples spanning 60∘ S to 60∘ N (including the Pacific Ocean), the accuracy of which is constrained by an standard error of ±1.5 ∘C (Eq. 3; Müller et al., 1998). The more recently developed BAYSPLINE SST calibration (Tierney and Tingley, 2018) provides similar SST estimates in the northern latitudes as previous calibrations. Seasonality in the alkenone production has been evidenced in the North Pacific (Tierney and Tingley, 2018). The SST calibration of Prahl et al. (1988) (Eq. 4), which includes the C37:4 alkenone, is also displayed here for comparison, as some concerns have arisen with the use of the U′ index in samples with high C37:4 in the Nordic Seas (Bendle et al., 2005). The standard error of Prahl et al. (1988) (Eq. 4) is ±1.0 ∘C. We identify samples with high C37:4 by presenting the percentage of C37:4 relative to the other C37 alkenones as %C37:4 (Bendle and Rosell-Melé, 2004) (Eq. 5). The %C37:4 represents fresher and cooler surface water characteristics (Bendle et al., 2005). In the Nordic Seas this has been linked to subpolar and polar water masses (Bendle et al., 2005), whereas elsewhere in the North Atlantic it has been linked to freshwater inputs (e.g. during Heinrich events; Martrat et al., 2007). In the subarctic Pacific, the %C37:4 proxy has been less well studied (McClymont et al., 2008), but high %C37:4 is also proposed to reflect cooler and fresher water masses (Harada et al., 2008).
3.3 IRD
IRD was quantified by weighing the coarse sand fraction (2 mm–250 µm) following the method of Krissek (1995). Coarse sand was separated from 10 cm3 samples by wet-sieving after air-drying and rinsing with distilled water to remove salts. Each sand sample was examined with a binocular microscope in order to exclude biogenic components and burrow fills of manganese and pyrite, which do not have an ice-rafted origin. The volume of terrigenous ice-rafted sediment was estimated in volume percent. The mass accumulation rate of IRD (g cm−2 kyr−1) was calculated as in Eq. (6):
where CS% is the coarse sand abundance (multiplied as a decimal), IRD% is the IRD abundance in the coarse sand fraction (as a volume ratio), DBD is the dry bulk density of the whole sediment sample (g cm−3) determined from discrete shipboard measurements, and LSR is the interval average linear sedimentation rates (cm kyr−1).
Closed-form Fourier analysis was used to describe the shape of quartz grains in the IRD fraction imaged on a Quanta FEI 200 scanning electron microscope (SEM; in the high-vacuum mode at 20 kV) following methods that have been used to describe sedimentary particles for more than 40 years (Ehrlich and Weinberg, 1970; Ehrlich et al., 1980; Dowdeswell, 1982; Livsey et al., 2013). Two-dimensional SEM images (from 200 to 500 X magnification) were input into ImageJ to produce a line trace of the boundary for each grain. The output was inspected to verify that the trace was representative of the grain. A total of 120 x–y coordinate points were output from the boundary to represent the grain, and these were input into the software programme PAST (Hammer et al., 2001). Harmonic amplitudes 1–20 were calculated; lower orders (1–10) represent grain shape (a function of provenance), and higher-order harmonics (11–20) represent grain roundness (Dowdeswell, 1986; Haines and Mazzullo, 1988; Livsey et al., 2013). An average dimensionless roughness coefficient (Rca−b) was calculated for each sample using the harmonics 16–20 for each grain in the population. Higher Rc16−20 values indicate increasing roughness, and lower coefficients indicate smoother grains (Dowdeswell, 1982; Livsey et al., 2013). The roughness coefficient is calculated as in Eq. (7):
where Rn is the nth harmonic coefficient and a–b is the harmonic range used, in our case 16–20 (Ehrlich and Weinberg, 1970). This value represents the average roundness for the grains in each sample, numbering at least 25.
3.4 Pollen analysis
Palynological treatments were performed on 13 samples according to the procedure routinely used at GEOTOP (de Vernal et al., 1996). Before sieving and chemical treatments, one Lycopodium clavatum spore tablet was added in each sample to estimate palynomorph concentrations (Matthews, 1969; Mertens et al., 2009). Wet sample volumes were measured by water displacement and weighed after being dried. The fraction between 10 and 120 µm was treated chemically to dissolve carbonate and silicate particles with repeated cold HCl (10 %) and HF (48 %). A small drop of the final residue was mounted on a microscope slide with glycerine jelly. Counting and identification of pollen grains and spores were carried out with a Leica DM 5000B microscope.
4.1 Early and mid-Pliocene (4 to 3 Ma): early Cordilleran Ice Sheet and first glaciation attempts
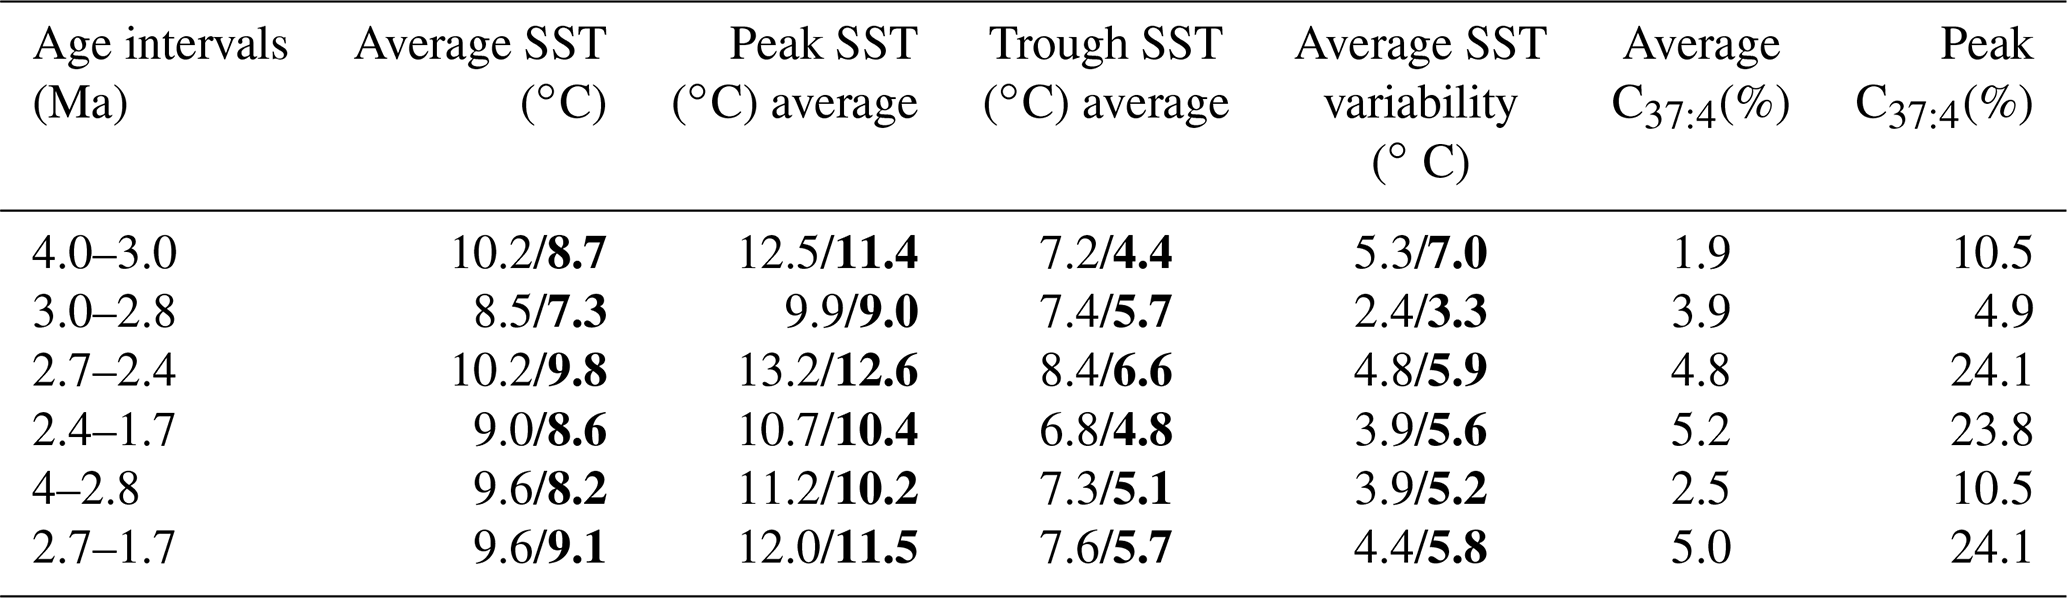
Early to late Pliocene (4.0 to 2.76 Ma) SSTs at Site U1417 are highly variable (max and min SST difference of 10 ∘C), with an average value of 8.2 ∘C (Fig. 2a; Table 1). We compare our palaeo-SST with the modern SST (here “modern” refers to the averaged decadal statistical mean SST of 6.5 ∘C, with a standard deviation of 3.4 ∘C, during the 1955 to 2012 time period; NOAA WOA13; Boyer et al., 2013) at the location of Site U1417 to identify changes in the behaviour of the Alaskan Current. Early to late Pliocene average SSTs at Site U1417 were approximately 1.7 ∘C warmer than modern, while Pliocene and Pleistocene SSTs at Site U1417 are similar to the modern range observations (e.g. NOAA WOA13; Boyer et al., 2013; Fig. 2a). Within that context, the MPWP (3.2 to 3.0 Ma) contains the highest SST peak of the Pliocene, with an SST of 12.4 ∘C, 5.9 ∘C warmer than modern SST in the GOA (Fig. 2a). The average MPWP SST of 8.9 ∘C is around 2.4 ∘C warmer than modern. Similar to the MPWP, the MG1–Gi1 warm period (3.6 to 3.4 Ma) contains the second highest peak in SST during the Pliocene, with an SST reaching 11.7 ∘C, 5.2 ∘C warmer than modern conditions (Fig. 2a). Also, other SST peaks during the MG1–Gi1 are up to 2–3 ∘C warmer than modern (Fig. 2a). The average SST during the MG1–Gi1 period is 9.5 ∘C, around 3 ∘C warmer than modern. C37:4 concentrations during the Pliocene remain below the threshold of subpolar–subarctic water masses identified in the Nordic Seas (Bendle and Rosell-Melé, 2004; Fig. 2b) and are consistent with a warm surface ocean and/or minimal meltwater inputs to the GOA. The wide range of “warmer than modern” SSTs occurring during the MPWP, together with higher than modern atmospheric CO2 levels (Fig. 3a) and similar continental configuration, further supports the proposal to use this time period as an analogue for future climate predictions (Hansen et al., 2006). The MG1–Gi1 period represents the opportunity for studies to focus on a prolonged period of sustained warm SST but with similar SST peaks as the MPWP.
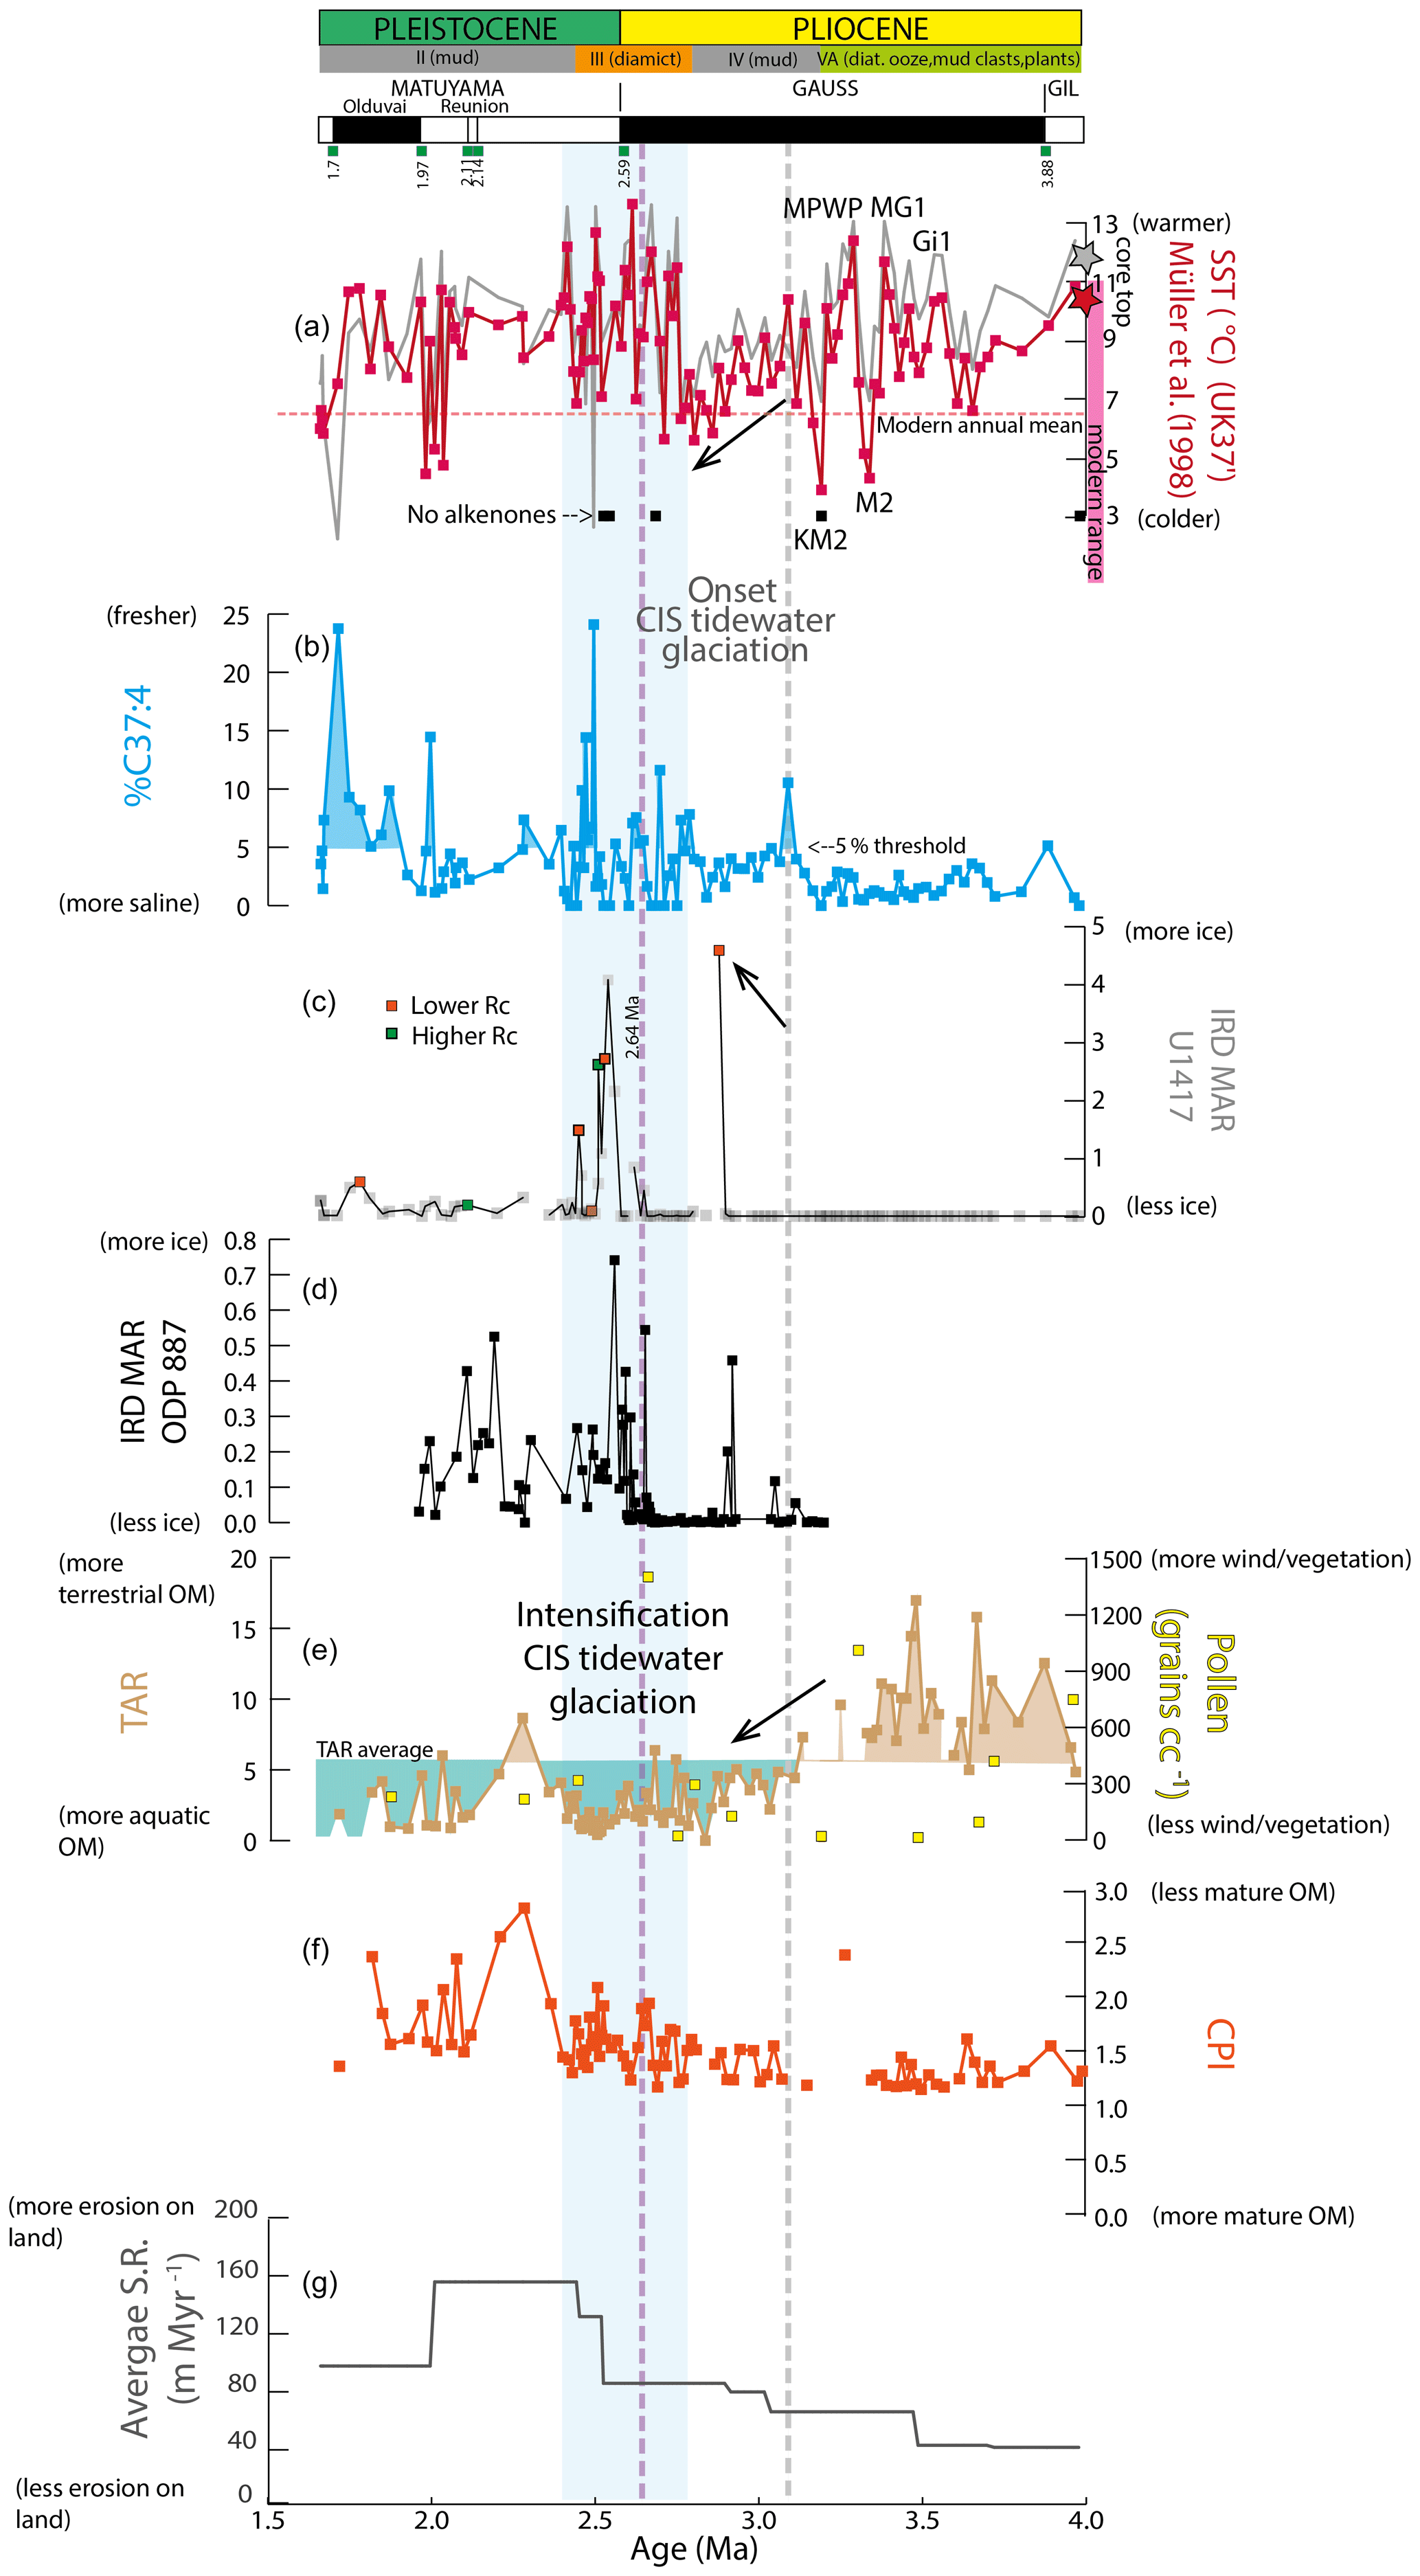
Figure 2Site U1417 across the Pliocene–Pleistocene transition. (a) Red line: SST from U′ index according to Müller et al. (1998) calibration; grey line: SST from U index according to Prahl et al. (1988) calibration. Black squares are samples in which alkenones were not detected. Dashed red line: modern averaged decadal (1955–2012) annual statistical mean SST of 6.4 ∘C at 0 m of water depth (NOAA WOA13; Boyer et al., 2013) at Site U1417, similar to the modern annual average SST of 7 ∘C at GAK1 station during the 1970–2018 time intervals for the 0–100 m water column depth (Weingartner et al., 2016) in the Gulf of Alaska; red star on the y axis: value of our youngest sample analysed at Site U1417 (U1417D 1H-1W 44-48; 0.016 Ma; SST=10.6 ∘C with Müller et al., 1998, calibration; SST=11.8 ∘C with Prahl et al., 1988, calibration); pink rectangle on the y axis: modern averaged decadal (1955–2012) statistical mean SST during winter and summer at Site U1417 and 0 m of water depth: 0–11.3 ∘C (NOAA WOA13; Boyer et al., 2013). (b) Abundance of the cold and/or freshwater alkenone C37:4 (%). The horizontal line shows the threshold of Bendle et al. (2005), above which subarctic–subpolar water masses were determined for the Nordic Seas. (c) IRD MAR (g cm−2 kyr−1). Orange and green squares reflect the lower and higher average roughness coefficient (Rc) of the IRD quartz grains, respectively. (d) IRD MAR (g cm−2 kyr−1) at ODP 887 (Prueher and Rea, 2001). (e) Terrestrial–aquatic n-alkane index (TAR, defined in the main text); the horizontal line shows the average TAR value for the study interval, and yellow squares represent pollen grain concentrations in grains per cubic centimetre. (f) CPI (defined in the main text). (g) Average sedimentation rates (see Fig. S3b; m Myr−1). Upper panel: Pliocene–Pleistocene boundary, magnetostratigraphy events and interpretations (see Figs. S2 and S3), and lithostratigraphic units of Site U1417 with simplified lithology (orange: ice-rafted diamict interbedded with mud; brown: marine mud; green: diatom ooze interbedded with debris flow deposits containing mud clasts and plant fragments) (Jaeger et al., 2014). The grey vertical line represents the onset of the Cordilleran Ice Sheet (CIS) glaciation (or oNHG) climate transition at 3 Ma; blue shading represents the 2.7–2.4 Ma climate transition with the intensification of the CIS tidewater glaciation (or iNHG) as in Table 1. The purple vertical line represents the onset of the Cordilleran Ice Sheet at the lower Klondike Valley, Yukon interior (Hidy et al., 2013; Fig. 1). Missing TAR or CPI data points are either a result of samples analysed for SSTs at the early stages of the project, which were not subsequently analysed for n-alkane distributions, or the result of samples in which chromatograms reflected poorly resolved n-alkane peaks.
Table 1Average SST (∘C) and %C37:4 during key climatic intervals at 4.0–3.0, 3.0–2.8, 2.7–2.4, and 2.4–1.7 Ma. Average SST (∘C) is the average of all the data points of the time interval. The peak SST (∘C) average is the average of the highest data points of each interval selected (Fig. 2). The trough SST (∘C) average is the average of the lowest data points of each interval (Fig. 5.2), and the average SST (∘C) variability is the difference between the average SST peak and the average SST trough. In black: data calculated from U (Prahl et al., 1988); in black bold: data from U′ (Müller et al., 1998).
During the early to mid-Pliocene, IRD is absent (Fig. 2c) and sedimentation rates are the lowest of the 4–1.7 Ma record (Fig. 2g). Small glaciers in Alaska since or before 4 Ma have been indicated from neodymium and lead isotope records from the Bering Sea (Horikawa et al., 2015). However, our data show that during the early and mid-Pliocene, the Cordilleran Ice Sheet was not yet extensive enough to erode or transport large volumes of sediment and runoff to the GOA. In contrast, IRD at ODP Site 887 (located 200 km southwest of U1417) suggests a glacial influence in the GOA since 5.5 Ma (Reece et al., 2011). Early Pliocene and even Miocene evidence of tidewater glaciation (δ18O, IRD) has been found at other locations in the North Atlantic (Mudelsee and Raymo, 2005; Bachem et al., 2016). Reece et al. (2011) attributed the initiation of glaciation in the GOA to the uplift of the Yakutat formation. However, IRD mass accumulation rates at ODP 887 prior to 2.6 Ma are very small, being close to 0 and <0.2 g cm−2 kyr−1 (Krissek, 1995). The low sedimentation rate, high TAR, low %C37:4, and an absence of IRD during this period at Site U1417 suggest that although the GOA experienced intervals of relatively cool SSTs, any glaciation was not sufficiently extensive to generate icebergs capable of reaching Site U1417 (Fig. 2).
There are two intervals of significant cooling recorded during the Pliocene at Site U1417: the MIS M2 (3.3 Ma) and KM2 (3.2 Ma) (Fig. 2a). Neither of these cold intervals record IRD delivery to Site U1417. Both intervals are punctuated by core breaks, suggesting a change in the sediment lithology, which made core recovery difficult (Fig. S1). The M2 has been proposed as a significant Pliocene glaciation but smaller than early Pleistocene glaciations, possibly due to the prevalent high atmospheric CO2 levels (De Schepper et al., 2013) (Fig. 3a). However, if this event, and the climatic conditions we record in the GOA, triggered the appearance of glaciation in Alaska at all (De Schepper et al., 2013), our data suggest that the glaciation was not intense enough to support an ice sheet with a tidewater margin that delivered icebergs to Site U1417. Our record provides evidence for relatively cold SST conditions during M2, as cold as conditions during major glacial cycles of the Pleistocene, but with no evidence for the development of a major Cordilleran Ice Sheet.

Figure 3Pliocene–Pleistocene SST across the North Pacific. (a) Alkenone δ13C atmospheric CO2 upper- and lower-end (ppm) estimates at Site ODP 999A (Seki et al., 2010b, revised in Foster et al., 2017) (4.0–1.5 Ma) and marine δ11B atmospheric CO2 upper- and lower-end (ppm) estimates at Site ODP 999 (2.3–3.2 Ma) (Martínez-Botí et al., 2015, revised in Foster et al., 2017). (b) δ18O (‰) LR04 benthic stack (Lisiecki and Raymo, 2005). Alkenone SST (∘C) from (c) ODP Site 846 (Herbert et al., 2017), (d) Site 1010 (Herbert et al., 2018a), (e) Site 1021 (Herbert et al., 2018b), (f) IODP Expedition 341 Site U1417 (Sánchez-Montes et al., 2019), (g) ODP Site 882 (Martínez-García et al., 2010b), and (h) ODP Site 1208 (Herbert et al., 2018c). The SST records are arranged from top to bottom following an anticlockwise direction from tropical east to subpolar east, subpolar west, and tropical west locations. Orange horizontal lines indicate reference levels of pre-industrial times and/or modern values for each of the records or sites (SSTs from NOAA WOA13, Boyer et al., 2013). Arrows indicate cooling or warming trends across the oNHG in the Pacific Ocean. All records are 1 kyr linearly interpolated and 100 kyr smoothed. Ages (Ma) have been determined through the calculation of the mean for each interval.
Between 4 and 3 Myr ago, we observe maximum TAR values (up to 16; Fig. 2e), pointing to a higher export of terrigenous (i.e. land-plant leaf waxes) relative to aquatic organic matter to the GOA. We assume that the warm and wet climate of the early Pliocene during high atmospheric CO2 levels potentially sustained a highly vegetated landscape in Alaska and western Canada which delivered high amounts of plant wax lipids and pollen grains into the GOA. The absence of IRD and higher pollen counts may infer an airborne transport of the leaf wax lipids rather than an export via icebergs (Fig. 2). The colder SST during the Pliocene (relative to the early Pleistocene) could have promoted a deeper AL, and dust-driven transport of terrigenous organic matter may have developed. Strong winds could have transported plant waxes to Site U1417 during the Pliocene, as is also observed in the North Atlantic during the NHG (Naafs et al., 2012). Müller et al. (2018) also proposed an export of long-chain n-alkanes to the GOA via dust storms. We suggest that, in addition to wind transport, coastal river discharge of terrigenous organic matter may also have contributed to higher TAR values recorded at Site U1417.
We further note that rivers and ocean currents could have transported bedrock material from the Yakutat Terrane (Childress, 2016) to Site U1417, 700 km offshore from the Alaskan coast. This would imprint the sediments delivered to the ocean with a petrogenic signal of terrigenous organic matter rather than reflecting the erosion of contemporary “fresh” organic matter from vegetation and soils. The CPI is often used to estimate the maturity of the organic matter and determine its source (Fig. 2f). Previous studies suggest that elevated TAR values and CPI values close to 1 reflect coal particles found in sediments in the GOA (Rea et al., 1995; Gulick et al., 2015). However, the coal-bearing Kultheith rocks (McCalpin et al., 2011) have a TAR signature of a maximum value of 2 and CPI values of less than 1 (Childress, 2016). Since Site U1417 TAR (up to 16) and CPI values (>1) do not overlap these onshore values, we suggest a mix of sources of organic matter during this time dominated by contemporaneous vegetation, although we cannot exclude the possibility of some coal erosion. The mix of terrigenous sources delivered to the GOA agrees well with previous studies that suggest the meeting of ice bodies during the westward expansion of the east–central Alaska Cordilleran Ice Sheet during the Pliocene (Duk-Rodkin et al., 2004).
4.2 The late Pliocene onset of the Cordilleran Ice Sheet glaciation (3.0 to 2.8 Ma)
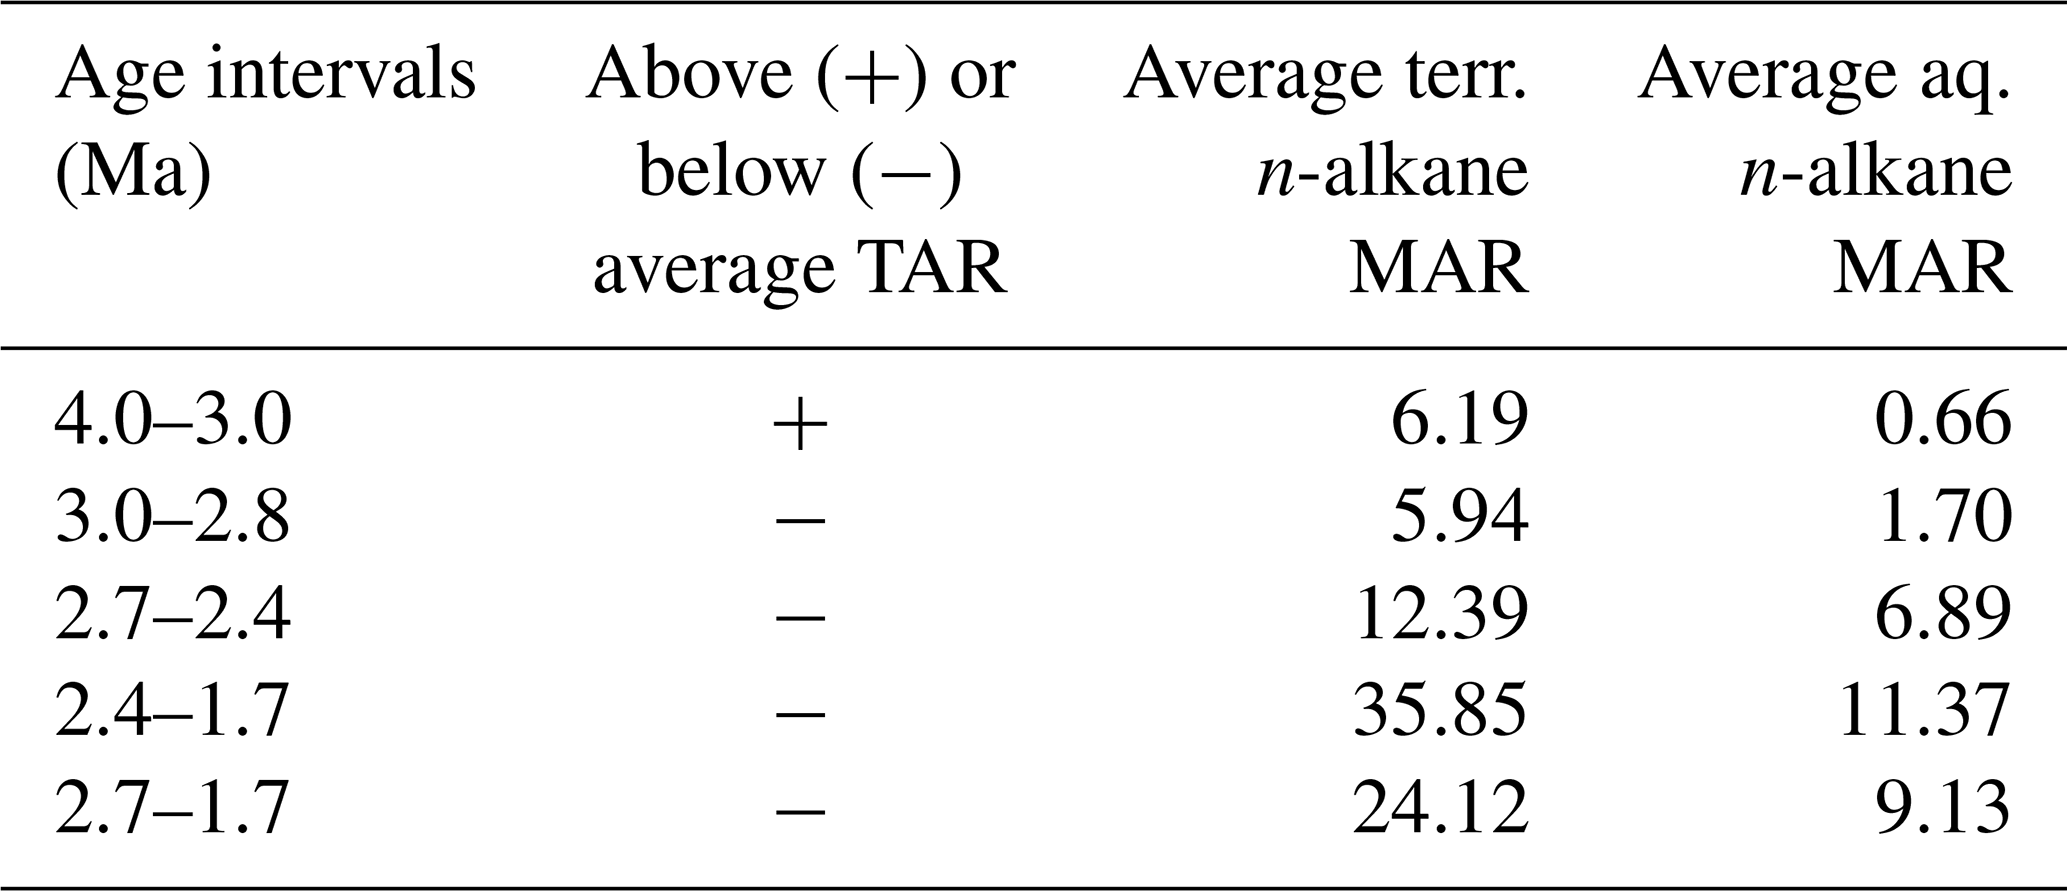
The interval from 3.0 to 2.8 Ma is characterized by a shift in climate conditions from those observed during the early and mid-Pliocene (Fig. 2) to more glacial conditions. At 3.0 Ma, average SSTs at Site U1417 remain relatively warm (around 8 ∘C), yet there is the first evidence of cooling at Site U1417 deduced from C37:4 crossing the threshold of 5 % (Bendle et al., 2005). %C37:4 increases can be related to colder sea surface conditions, but due to Site U1417's location and climatic context, it may also be possible that increases in %C37:4 relate to meltwater discharge from the expanding ice sheet. From 3.0 to 2.8 Ma, SST decreases gradually from 8 to 5.5 ∘C (Fig. 2a), recording colder SSTs than the modern GOA. We attribute this ∼200 kyr progressive cooling to the oNHG as a response to the overall decrease in atmospheric CO2 (Seki et al., 2010a; Martínez-Botí et al., 2015). From 3.0 to 2.8 Ma, TAR values decrease to below the average of the entire TAR record, suggesting a decrease in leaf wax lipid transport to Site U1471 and/or higher input of aquatic-derived organic matter. Compared to the 4.0–3.0 Ma time interval, accumulation rates of long-chain n-alkanes, reflecting terrigenous organic matter input, slightly decreased from average values of 6.19 to 5.94 , while accumulation rates of short-chain n-alkanes, reflecting aquatic organic matter export, increased from 0.66 to 1.7 (Table 2). This increase in the abundance of short-chain n-alkanes during a period of SST cooling may point to higher algal productivity stimulated by a successive supply of nutrients through the erosion of bedrock. In fact, the coincident increase in average sedimentation rates (from 65 to 79 m Myr−1) indicates a more efficient erosive agent onshore than before 3 Ma. As CPI values at Site U1417 (Fig. 2f) remain similar to early and mid-Pliocene values, a similar (immature) source of the terrigenous organic matter is suggested. We propose that, instead, as the land was becoming increasingly ice covered during the expansion of the Cordilleran Ice Sheet, vegetation growth and erosion of higher plant materials during the oNHG became limited. The timing of the oNHG fits well with the oldest Cordilleran glaciation recorded in the Yukon between 2.9 and 2.6 Ma (Duk-Rodkin and Barendregt, 1997; Duk-Rodkin et al., 2001; Froese et al., 2000). Our interpretation of the TAR data is also consistent with the deposition of terrigenous fan deltas due to coastal uplift (Duk-Rodkin et al., 2004), whereby the higher topography during a colder climate would translate into lower vegetation growth and higher sedimentation rates.
Table 2Comparisons between average TAR and terrigenous and aquatic n-alkane mass accumulation rates across key climatic intervals at 4.0–3.0, 3.0–2.8, 2.7–2.4, and 2.4–1.7 Ma. Overall above (+) and below (−) 4–1.7 Ma TAR average values and terrigenous and aquatic n-alkane mass accumulation rates () at Site U1417 during the time intervals described in the text.
The peak in %C37:4 at 3 Ma is followed by lower %C37:4 values (close to 5 %) and the first significant pulse of IRD as identified by a single sample with the highest IRD MAR. This IRD MAR peak (4.5 g cm−2 kyr−1) and an increase in sedimentation rates (from 79 to 85 m Myr−1) at 2.9 Ma constitute the first evidence that tidewater glaciers were present in southwest Alaska delivering icebergs to Site U1417. IRD quartz does not appear crushed or abraded by glacial activity, indicating small tidewater valley glaciers producing icebergs, which could contain grains that were introduced by rockfall or fluvial sediment. The abrupt peak in IRD delivery to U1417 at 2.9 Ma could be due to ice growth on land and cold enough SSTs to permit distal iceberg drift and the release of debris to Site U1417. A smaller number of icebergs also drifted to ODP 887 (St. John and Krissek, 1999) during this time (Fig. 2d). The increase in sedimentation rates has been suggested to mark the maximum Cordilleran Ice Sheet extension during the Pliocene (Gulick et al., 2015). Following this first peak, IRD MAR decreases to values between 0 and 1 g cm−2 kyr−1 until 2.6 Ma. This abrupt decrease in IRD indicates lower iceberg delivery to Site U1417. A synchronous increase in C37:4 above 5 % suggests that the melting of tidewater glaciers was responsible for the decrease in iceberg delivery despite the cold climate. A colder and drier climate associated with lower SSTs and atmospheric CO2 concentrations (Fig. 3a) during the last stages of the oNHG could have limited moisture transport to land and iceberg delivery to the GOA (Fig. 2c and d).
4.3 The intensification of the Cordilleran Ice Sheet glaciation (2.7 to 2.4 Ma) and its evolution during the early Pleistocene (2.4 to 1.7 Ma)
At Site U1417, the iNHG during the Plio–Pleistocene transition (PPT) is characterized by a rise in SST, followed by highly variable values (between 5.6 and 13.6 ∘C) with an average of 9.1 ∘C, which are 2.6 ∘C warmer than modern. The iNHG is defined here as the period containing sustained signs of glaciation (i.e. Maslin et al., 1996; Bartoli et al., 2005), which at Site U1417 are confirmed by glacial meltwater and IRD delivery. The relatively high %C37:4 (up to 24 %) in the early Pleistocene correlates well with the period of high IRD delivery (up to 4 g cm−2 kyr−1) between 2.7 and 2.4 Ma (Fig. 2b and c). This suggests an expansion–intensification of the Cordilleran glaciation following a gradual SST cooling during the oNHG. The increase in IRD at Site U1417 coincides with the increase in IRD at Site 887 (St. John and Krissek, 1999), the maximum extent of the Cordilleran Ice Sheet as recorded onshore in the eastern Cordillera by the extensive Klondike gravels at 2.64 Ma ( Ma) (Hidy et al., 2013), and the oldest glacial records in stratigraphical sections in southwestern Yukon and southeastern Alaska at 2.9 to 2.6 Ma (Barendregt et al., 1996, Duk-Rodkin et al., 1996, 2001, 2004; Duk-Rodkin and Barendregt, 1997; Froese et al., 2000). The lithology at Site U1417 includes diamict layers that alternate with bioturbated mud from 2.7 Ma, indicating that the Cordilleran Ice Sheet remained very variable after the oNHG and maintained glacial tidewater margins discharging icebergs into the sea. Yet the intensification of the Alaskan tidewater glaciation occurred with a GOA that was overall either warmer than, or at least as warm as, the middle to late Pliocene (considering Müller et al., 1998 SST calibration error).
The overall increase in %C37:4 in the GOA during the early Pleistocene coincides with an SST warming (ca. 1 ∘C relative to the Pliocene; Fig. 2a and b), suggesting a stronger link between C37:4 and meltwater fluxes rather than an expansion of subarctic water masses. Additionally, maxima and minima in %C37:4 during the iNHG are unrelated to elevated or lowered SSTs, respectively. There is little information available about the origin of C37:4 in the North Pacific to explain the high %C37:4 values recorded at Site U1417 (i.e. Harada et al., 2008; McClymont et al., 2008) and their association with intermediate SSTs rather than minima–maxima. It has been suggested that stratification of the water column due to atmospheric CO2 changes in the North Pacific could result in a warmer sea surface in comparison to deeper water masses and the surrounding land due to an increase in surface absorption of solar radiation and seawater heat capacity (Haug et al., 2005). Haug et al. (2005) proposed that this could lead to an increase in ocean evaporation and orogenic precipitation, ultimately encouraging North American ice sheet growth.
Terrigenous and aquatic organic matter accumulation rates both increase during the 2.4 to 1.7 Ma interval in comparison with the 4–2.8 Ma time period, resulting in variable but overall lower than average TAR values (Table 2), despite enhanced terrigenous inputs to Site U1417 (Fig. 2g). Over the iNHG, low TAR values (<1) and small variations in IRD MAR (of the order of 0.1 to 2.8 g cm−2 kyr−1) coincide with intermediate SSTs (7 to 11 ∘C) and %C37:4 (2 %–24 %). This could point to an increase in marine productivity export related to an enhanced nutrient delivery to Site U1417 via glacial runoff. The increase in CPI values discards mature sources of organic matter at this time interval, suggesting an enhanced contemporary leaf wax contribution. IRD peaks are observed during SST minima, suggesting the importance of SSTs for the delivery of icebergs to distal sites such as Site U1417. The average Rc of IRD is low (Fig. 2c) even during IRD MAR peaks, indicating minimal glacial crushing during the iNHG. In comparison, samples from 1.6 to 1.5 Ma show a higher Rc and appear to have greater evidence of glacial crushing, suggesting the development of a larger ice sheet or scouring and evacuation of sediment from the non-glacial weathered landscape. This could indicate that the first IRD in icebergs delivered to the GOA during the late Pliocene and early Pleistocene originated from smaller marine-terminating valley glaciers, which removed sediment and weathered rock from the landscape rather than eroding bedrock and allowed IRD generation.
The comprehensive data set obtained from Site U1417 sediments (Fig. 2) supports a climate role in the ice sheet expansion during the early Pleistocene and the iNHG, with an increase in precipitation from a warmer and/or stratified ocean and cooler periods associated with IRD delivery. An additional explanation for the changing TAR during the early Pleistocene is that tectonic uplift of the Chugach–St. Elias area from 2.7 Ma (Enkelmann et al., 2015) led to enhanced orogenic precipitation and a change in erosional pathways (Enkelmann et al., 2015). The glaciation could have altered the main source of terrestrial input to the Surveyor Channel to higher metamorphic and plutonic sources with lower or null TAR values (Childress, 2016). An increase in CPI variability to values up to 2 and 3 during the early Pleistocene (starting from 2.7 Ma) supports the change in the source of organic matter away from the more mature coal bedrock to more immature terrestrial organic matter (plant waxes). However, this comes at a time of increasing IRD, which adds a new source of terrigenous sediment to Site U1417. The shift in CPI values from 2.7 Ma in comparison with the period before 2.7 Ma is synchronous with the shift towards the erosion of sediments sourced from metamorphic and plutonic sources, as described in Enkelmann et al. (2015), delivered to Site U1417 during the early Pleistocene in comparison with the Pliocene.
4.4 The Pliocene and Pleistocene climate across the North Pacific Ocean
The overall cooling trend during the Neogene, briefly interrupted by the MPWP and intense cooling events such as the M2, is a dominant pattern in records of the global climate. This largely reflects the global increase in ice volume (as reflected in the LR04 benthic δ18O stack; Lisiecki and Raymo, 2005; Fig. 3b) as well as cooling trends reconstructed in North Atlantic SSTs (e.g. ODP Site 982; Lawrence et al., 2009). In contrast, our understanding of the contribution of the North Pacific to the global climate evolution from the Pliocene to the Pleistocene is limited. Our study at Site U1417 adds valuable regional climate information during the evolution of the Cordilleran Ice Sheet. Unlike the LR04 stack, average Pliocene SST values (4.0 to 2.8 Ma) at Site U1417 are 1 ∘C ±0.5 (SD) colder than the average early Pleistocene values (2.7 to 1.7 Ma). A warming trend from the late Pliocene to early Pleistocene has also been observed at ODP Site 882 in the subarctic Pacific (Martínez-García et al., 2010b) and at Site 1010 (mid-latitude eastern Pacific) (Fig. 3). Beyond the North Pacific, warmer SSTs during the early Pleistocene compared to the Pliocene have also been recorded, i.e. DSDP Site 593 in the Tasman Sea (McClymont et al., 2016) and potentially Site 1090 (Martínez-García et al., 2010a) in the South Atlantic. In contrast, long-term cooling trends mark the early Pleistocene for the mid-latitude eastern and western Pacific (Sites 1021 and 1208) and tropical eastern Pacific (Site 846), more consistent with the development of a cooler and/or more glaciated climate (Fig. 3).
The North Pacific warming occurs despite an atmospheric CO2 drop from an average of 347 ppm (Pagani et al., 2010; Seki et al., 2010a) and 357 ppm (Martínez-Botí et al., 2015) to similar to pre-industrial levels (268 and 315 ppm) from 3.0 to 2.6 Ma and an associated reduction in global radiative forcing (Foster et al., 2017). The early Pleistocene warming signal in the GOA (and the North Pacific more generally) thus implies an important role for local or regional processes. We have discussed above the potential role played by ocean stratification in the North Pacific and a possible link to the evolving Cordilleran Ice Sheet in the GOA through evaporation–precipitation feedbacks. The synchrony of these changes with observed tectonic uplift (e.g. Enkelmann et al., 2015) makes it difficult to disentangle the potential climatic and tectonic mechanisms behind ice sheet expansion.
To understand the evolution of the ocean currents governing the North Pacific at the present core sites (Fig. 1) and to find possible explanations for the observed SST distributions during the Pliocene and Pleistocene climate evolution, the modern climate system is used here as an analogue. Modern monthly mean SSTs at ODP 882 are colder than Sites U1417 and 1021 all year around. During the late Pliocene and early Pleistocene, ODP 882 SSTs are 3–4 ∘C warmer than in the east (Fig. 3f and g). Modern seasonal climate analogues cannot be used to explain the Pliocene and Pleistocene subarctic SST distribution. However, on longer timescales, the strength of the AL is currently linked to the wider Pacific Ocean circulation by the Pacific Decadal Oscillation (PDO) over periods of 20–30 years (Furtado et al., 2011). The Pliocene–Pleistocene North Pacific SST gradients show similarities with the negative phase of the PDO, which is characterized by positive SST anomalies in the central North Pacific surrounded by negative SST anomalies along the North American coast and in the eastern equatorial Pacific. If the PDO can be used as an analogue for the late Pliocene, the associated route of wind systems might have increased the precipitation in the Gulf of Alaska and could therefore represent a key factor for the growth of glaciers and/or the CIS in the Alaskan mountains.
The SST evolution from the Pliocene to the early Pleistocene in the subarctic northeast and eastern to mid-latitude North Pacific is very different from the North Atlantic, with a colder Pliocene than early Pleistocene. The early Pliocene appears to be characterized by a heavily vegetated landscape for which there is no obvious glaciation in the St. Elias Mountains. A series of cooling events during the Pliocene (including the M2 event) could have initiated glaciation in Alaska, but if so, the glaciation was limited to mountain glaciers, probably due to relatively high atmospheric CO2 concentrations and the lower topography in coastal Alaska. The first evidence of glaciation starts at 3 Ma with an increase in glacial meltwater, followed by a progressive 2.5 ∘C SST cooling from 3.0 to 2.8 Ma and the first IRD peak at 2.9 Ma since the late Pliocene. The glacial meltwater, IRD, and sedimentation rate increase is indicative of the intensification of the Cordilleran glaciation (2.7–2.4 Ma). This occurs with warm SSTs, suggesting efficient warm ocean–land precipitation–Cordilleran Ice Sheet growth interactions.
A warm surface ocean in the western mid-latitude Pacific during the late Pliocene and early Pleistocene compared to modern was potentially a key mechanism for increasing moisture supply to the GOA, triggering the growth of the Cordilleran Ice Sheet. A similar to modern negative PDO-like climate could have set a more efficient route for moisture transport from the western subarctic Pacific to the GOA and could have been a key mechanism for glacial growth. The tectonic uplift of the St. Elias Mountains could also have been a contributing factor for the Cordilleran Ice Sheet expansion by increasing the potential for precipitation to fall as snow over the ice sheet source regions despite warm SST in the GOA during the Pliocene. In contrast to the Pliocene, the early Pleistocene drop in atmospheric CO2 concentrations could have been decisive in an expansion of the Cordilleran Ice Sheet.
The data presented in this paper have been submitted to Pangaea.de and are accessible through this link: https://doi.org/10.1594/PANGAEA.899064. The data sets should be cited as Sánchez-Montes et al. (2019). The SST data in this publication will also be published in the PlioVAR database.
The supplement related to this article is available online at: https://doi.org/10.5194/cp-16-299-2020-supplement.
New data sets presented in this paper derive from the PhD project of MLSM supervised by ELM and JML. JM was closely engaged from early stages of this project, including aspects of method development. EAC generated the IRD data, and CZ generated pollen data. All authors have contributed to data interpretations. MLSM prepared the paper with contributions from all co-authors.
The authors declare that they have no conflict of interest.
We would like to acknowledge the International Ocean Discovery Program U.S. Implementing Organization (IODP-USIO) and the captain and crew of the D/V Joides Resolution. This work was supported by funding from Van Mildert College and the Durham Doctorate Scholarship (MLSM), the Philip Leverhulme Prize (ELM), and a NERC-IODP grant (NE/L002426/1) to ELM. JM received funding through the German Research Foundation (MU3670/1-2), an ECORD grant, and the Helmholtz Association (VH-NG-1101). EAC received funding from the U.S. National Science Foundation award OCE-1434945 and a post-expedition award from the U.S. Science Support Program of the IODP. We are grateful for valuable comments from Professor Joseph S. Stoner on our new age model proposed here. We are also grateful for the comments provided by George Swann and Antoni Rosell-Mele on this piece of work during MLSM's VIVA process. We thank Martin West, Amanda Hayton, and Kathryn Melvin for assistance with the GCMS analyses, as well as Mathew Sandefur and Hugh Harper for assistance with the IRD analyses. This work is a contribution to the PlioVAR working group synthesis of Pliocene marine data (http://pastglobalchanges.org/, last access: 9 January 2020). We thank Alberto Reyes (CP editor), CP reviewer Anders Carlson, and a second anonymous reviewer for valuable discussions and comments that helped in shaping this paper.
This research has been supported by Van Mildert College and the Durham Doctorate Scholarship, the Philip Leverhulme Prize, NERC-IODP (grant no. NE/L002426/1), the German Research Foundation (grant no. MU3670/1-2), the Helmholtz Association (grant no. VH-NG-1101), the U.S. National Science Foundation (award no. OCE-1434945), the European Consortium for Ocean Research Drilling (ECORD), and the U.S. Science Support Program of the IODP.
This paper was edited by Alberto Reyes and reviewed by Anders Carlson and one anonymous referee.
Bachem, P. E., Risebrobakken, B., and McClymont, E. L.: Sea surface temperature variability in the Norwegian Sea during the late Pliocene linked to subpolar gyre strength and radiative forcing, Earth Planet. Sc. Lett., 446, 113–122, 2016.
Barendregt, R. W., Enkin, R. J., Duk-Rodkin, A., and Baker, J.: Paleomagnetic evidence for late Cenozoic glaciations in the Mackenzie Mountains, Northwest Territories, Canada, Can. J. Earth Sci., 33, 896–903, 1996.
Bartoli, G., Sarnthein, M., Weinelt, M., Erlenkeuser, H., Garbe-Schönberg, C.-D., and Lea, D. W.: Final closure of Panama and the onset of northern hemisphere glaciation, Earth Planet. Sc. Lett., 237, 33–44, https://doi.org/10.1016/j.epsl.2005.06.020, 2005.
Bendle, J. A. and Rosell-Melé, A.: Distributions of and in the surface waters and sediments of the Nordic Seas: implications for paleoceanography, Geochem. Geophy. Geosy., 5, Q11013, https://doi.org/10.1029/2004GC000741, 2004.
Bendle, J. A., Rosell-Melé, A., and Ziveri, P.: Variability of unusual distributions of alkenones in the surface waters of the Nordic seas, Paleoceanography, 20, PA2001, https://doi.org/10.1029/2004PA001025, 2005.
Boyer, T. P., Antonov, J. I., Baranova, O. K., Coleman, C., García, H. E., Grodsky, A., Johnson, D. R., Locarnini, R. A., Mishonov, A. V., O'Brien, T. D., Paver, C. R., Reagan, J. R., Seidov, D., Smolyar, I. V., and Zweng, M. M.: World Ocean Database, edited by: Levitus, S. and Mishonov, A., NOAA Atlas NESDIS 72, 209 pp., 2013.
Bray, R. R. and Evans, E. D.: Distribution of n-paraffins as a clue to recognition of source beds, Geochim. Cosmochim. Ac., 22, 2–15, 1961.
Bringham-Grette, J., Melles, M., Minyuk, P., Andreev, A., Tarasov, P., Deconto, R., Koenig, S., Nowaczyk, N., Wennrich, V, Rosén, P., Haltia, E., Cook, T., Gebhardt, C., Meyer-Jacob, C., Snyder, J., and Herzschuh, U.: Pliocene warmth, polar amplification, and stepped pleistocene cooling recorded in NE Arctic Russia, Science, 340, 1421–1427, https://doi.org/10.1126/science.1233137, 2013.
Childress, L. B.: The Active Margin Carbon Cycle: Influences of Climate and Tectonics in Variable Spatial and Temporal Records, PhD thesis, Northwestern University, Evanson, Illinois, 2016.
Cranwell, P. A.: Chain-length distribution of n-alkanes from lake sediments in relation to post-glacial environmental change, Freshwater Biol., 3, 259–265, 1973.
De Shepper, S., Groeneveld, J., Naafs, B. D., Van Renterghem, C., Hennissen, J., Head, M. J., Louwye, S., and Fabian, K.: Northern Hemisphere Glaciation during the Globally Warm Ealy Late Pliocene, PLOS ONE, 8, e81508, https://doi.org/10.1371/journal.pone.0081508, 2013.
de Vernal, A., Henry, M., and Bilodeau, G.: Micropaleontological preparation techniques and analyses, Les Cahiers du Geotop, 3, 16–27, 1996.
Dolan, A. M., Haywood, A. M., Hill, D. J., Dowsett, H. J., Hunter, S. J., Lunt, D. J., and Pickering, S. J.: Sensitivity of Pliocene ice sheets to orbital forcing, Palaeogeogr. Palaeocl., 309, 98–110, 2011.
Dolan, A. M., Haywood, A. M., Hunter, S. J., Tindall, J. C., Dowsett, H. J., Hill, D. J., and Pickering, S. J.: Modelling the enigmatic Late Pliocene Glacial Event – Marine Isotope Stage M2, Global Planet. Change, 128, 47–60, 2015.
Dowdeswell, J. A.: Scanning electron micrographs of quartz sand grains from cold environments examined using fourier shape analysis, J. Sediment. Petrol., 52, 1315–1323, 1982.
Dowdeswell, J. A.: The distribution and character of sediments in a tidewater glacier, southern Baffin Island, N.W.T., Canada, Arctic Alpine Res., 18, 45–56, 1986.
Duk-Rodkin, A. and Barendregt, R. W.: Gauss and Matuyama glaciations in the Tintina Trench, Dawson area, Yukon Territory, Canadian Quaternary Association, Abstracts, Montreal, p. 22, 1997.
Duk-Rodkin, A., Barendregt, R. W., Tornacai, C., and Philips, F. M.: Late Tertiary to late Quaternary record in the Mackenzie Mountains, Northwest Territories, Canada: stratigraphy, paleosols, paleomagnetism, and chlorine-36, Can. J. Earth Sci., 33, 875–895, 1996.
Duk-Rodkin, A., Barendregt, R. W., White, J., and Singhroy, V. H.: Geologic evolution of the Yukon River: implications for gold placer, Quatern. Int., 80, 5–31, 2001.
Duk-Rodkin, A., Barendregt, R. W., Froese, D. G., Weber, F., Enkin, R., Smith, I. R., Zazula, G. D., Waters, P., and Klassen, R.: Timing and extent of the Plio-Pleistocene glaciations in north-western Canada and east-central Alaska, Developments in Quaternary Sciences, 2, 313–345, 2004.
Ehrlich, R. and Weinberg, B.: An exact method for characterization of grain shape, J. Sediment. Petrol., 40, 205–212, 1970.
Ehrlich, R., Brown, P. J., Yarus, J. M., and Przygocki, R. S.: The origin of shape frequency distributions and the relationship between size and shape, J. Sediment. Petrol., 50, 475–483, 1980.
Enkelmann, E., Koons, P. O., Pavlis, T. L., Hallet, B., Barker, A., Elliott, J., Garver, J. I., Gulick, S. P. S., Headley, R. M., Pavlis, G. L., Ridgway, K. D., Ruppert, N., and Van Avendonk, H. J. A.: Cooperation among tectonic and surface processes in the St. Elias Range, Earth's highest coastal mountains, Geophys. Res. Lett., 42, 5838–5846, https://doi.org/10.1002/2015GL064727, 2015.
Expedition 341 Scientists, Southern Alaska Margin: interactions of tectonics, climate, and sedimentation, IODP Prel. Rept. 341, https://doi.org/10.2204/iodp.pr.341.2014, 2014.
Fedorov, A. V., Lawrence, K. T., Liu, Z., Dekens, P. S., Ravelo, A. C., and Brierley, C. M.: Patterns and mechanisms of early Pliocene warmth, Nature, 496, 43–49, https://doi.org/10.1038/nature12003, 2013.
Foster, G. L., Royer, D. L., and Lunt, D.: Future climate forcing potentially without precedent in the last 420 million years, Nat. Commun., 8, 14845, https://doi.org/10.1038/ncomms14845, 2017.
Froese, D. G., Barendregt, R. W., Enkin, R. J., and Baker, J.: Paleomagnetic evidence for multiple late Pliocene-Early Pleistocene glaciations in the Klondike area, Yukon Territory, Can. J. Earth Sci., 37, 863–877, 2000.
Furtado, J. C., Di Lorenzo, E., Schneider, N., and Bond, N. A.: North Pacific Decadal Variability and Climate Change in the IPCC AR4 Models, J. Climate, 24, 3049–3067, 2011.
Gulick, S. P. S., Jaeger, J. M., Mix, A. C., Asahi, H., Bahlburg, H., Belanger, C. L., Berbel., G. B. B., Childress, L., Cowan, E., Drab, L., Forwick, M., Fukumura, A, Ge, S., Gupta, S., Kiola, A., Konno, S., LeVay, L. J., Marz, C., Matsuzaki, K. M., McClymont, E. L., Moy, C., Müller, J., Nakamura, A., Ojima, T., Ribeiro, F. R., Ridgway, K. D., Romero, O. E., Slagle, A. L., Stoner, J. S., St-Onge, G., Suto, I., Walczak, M. D., Worthington, L. L., Bailey, I., Enkelmann, E., Reece, R., and Swartz, J. M.: Mid-Pleistocene climate transition drives net mass loss from rapidly uplifting St. Elias Mountains, Alaska, P. Natl. Acad. Sci. USA, 112, 15042–15047, https://doi.org/10.1073/pnas.1512549112, 2015.
Haines, J. and Mazzullo, J.: The original shape of quartz silt grains: a test of the validity of the use of quartz grain shape analysis to determine the source of terrigneous silt in marine sedimentary deposits, Mar. Geol., 78, 227–240, 1988.
Hammer, Ø., Harper, D. A. T., and Ryan, P.D.: PAST: Paleontological Statistics Software Package for Education and Data Analysis, Palaeontol. Electron., 4, 9 pp., 2001.
Hansen, J., Sato, M., Ruedy, R., Lo, K., Lea, D., and Medina-Elizalde, M.: Global temperature change, P. Natl. Acad. Sci. USA, 103, 14288–14293, https://doi.org/10.1073/pnas.0606291103, 2006.
Harada, N., Sato, M., and Sakamoto, T.: Freshwater impacts recorded in tetraunsaturated alkenones and alkenone sea surface temperatures from the Okhotsk Sea across millennial-scale cycles, Paleoeanography, 23, PA3201, https://doi.org/10.1029/2006PA001410, 2008.
Haug, G. H., Ganopolski, A., Sigman, D. M., Rosell-Mele, A., Swann, G. E. A., Tiedemann, R., Jaccard, S. L., Bollmann, J., Maslin, M. A., and Leng, M. J., and Eglinton, G.: North Pacific seasonality and the glaciation of North America 2.7 million years ago, Nature, 433, 821–825, 2005.
Haywood, A. M. and Valdes, P. J.: Modelling Pliocene warmth: contribution of atmosphere, oceans and cryosphere, Earth Planet. Sc. Lett., 218, 363–377, https://doi.org/10.1016/S0012-821X(03)00685-X, 2004.
Haywood, A. M., Dolan, A. M., Pickering, S. J., Dowsett, H. J., McClymont, E. L., Prescott, C. L., Salzmann, U., Hill, D. J., Hunter, S. J., Lunt, D. J., Pope, J. O., and Valdes, P. J.: On the identification of a Pliocene time slice for data–model comparison, Philos. T. Roy. Soc. A, 371, 20120515, https://doi.org/10.1098/rsta.2012.0515, 2013.
Herbert, T. D., Peterson, L. C., Lawrence, K. T., and Liu, Z.: Plio-Pleistocene tropical alkenone SST reconstructions for ODP Site 138-846, PANGAEA, https://doi.org/10.1594/PANGAEA.874750, 2017.
Herbert, T. D., Lawrence, K. T., Tzanova, A., Peterson, L. C., Caballero-Gill, R. P., and Kelly, C. S.: (Table S2) SST estimates as a function of age, ODP Site 167-1010, PANGAEA, https://doi.org/10.1594/PANGAEA.885599, 2018a.
Herbert, T. D., Lawrence, K. T., Tzanova, A., Peterson, L. C., Caballero-Gill, R. P., and Kelly, C. S.: (Table S2) SST estimates as a function of age, ODP Site 167-1021, PANGAEA, https://doi.org/10.1594/PANGAEA.885579, 2018b.
Herbert, T. D., Lawrence, K. T., Tzanova, A., Peterson, L. C., Caballero-Gill, R. P., and Kelly, C. S.: (Table S2) SST estimates as a function of age, ODP Hole 198-1208A, PANGAEA, https://doi.org/10.1594/PANGAEA.885584, 2018c.
Hidy, A. J., Gosse, J. C., Froese, D. G., Bond, J. D., and Rood, D. H.: A latest Pliocene age for the earliest and most extensive Cordilleran Ice Sheet in northwestern Canada, Quaternary Res., 61, 77–84, https://doi.org/10.1016/j.quascirev.2012.11.009, 2013.
Hogan, C.: Oceans and Seas Gulf of Alaska, The Encyclopedia of Earth, available at: http://www.eoearth.org/view/article/153188 (last access: 13 November 2015), 2013.
Horikawa, K., Martin, E. E., Basak, C., Onodera, J., Seki, O., Sakamoto, T., Ikehara, M., Sakai, S., and Kwamura, K.: Pliocene cooling enhanced by flow of low-salinity Bering Sea water to the Arctic Ocean, Nat. Commun., 6, 7587, https://doi.org/10.1038/ncomms8587, 2015.
Jaeger, J. M., Gulick, S. P. S., LeVay, L. J., Asahi, H., Bahlburg, H., Belanger, C. L., Berbel, G. B. B., Childress, L. B., Cowan, E. A., Drab, L., Forwick, M., Fukumura, A., Ge, S., Gupta, S. M., Kioka, A., Konno, S., Marz, C. E., Matsuzaki, K. M., McClymont, E. L., Mix, A. C., Moy, C. M., Müller, J., Nakamura, A., Ojima, T., Ridgway, K. D., Rodrigues Ribeiro, F., Romero, O. E., Slagle, A. L., Stoner, J. S., St-Onge, G., Suto, I., Walczak, M. H., and Worthington, L. L.: Site U1417, in: Proc. IODP, Expedition 341 of the riserless drilling platform, Victoria, British Columbia, Canada, to Valdez, Alaska, USA, Sites U1417–U1421, 29 May–29 July 2013, edited by: Jaeger, J. M., Gulick, S. P. S., LeVay, L. J., and the Expedition 341 Scientists, Integrated Ocean Drilling Program, 341, https://doi.org/10.2204/iodp.proc.341.103.2014, 2014.
Jansen, E., Overpeck, J., Briffa, K. R., Duplessy, J.-C., Joos, F., Masson-Delmotte, V., Olago, D., Otto-Bliesner, B., Peltier, W. R., Rahmstorf, S., Ramesh, R., Raynaud, D., Rind D., Solomina, O., Villalba, R., and Zhang, D.: Palaeoclimate, in: Climate Change 2007: The Physical Science Basis. Contribution of Working Group I to the Fourth Assessment Report of the Intergovernmental Panel on Climate Change, edited by: Solomon, S., Qin, D., Manning, M., Chen, Z., Marquis, M., Averyt, K. B., Tignor, M., and Miller, H. L., Cambridge University Press, Cambridge, United Kingdom and New York, NY, USA, 433–497, 2007.
Kato, Y., Onodera, J., Suto, I., Teraishi, A., and Takahashi, K.: Pliocene and Pleistocene paleoceanography in the western subarctic Pacific based on diatom analyses of ODP Leg 145 Hole 884B and IODP Expedition 323 Holes U1341B and U1343E, Deep-Sea Res. Pt. II, 125–126, 29–37, 2016.
Kornilova, O. and Rosell-Melé, A.: Application of microwave-assisted extraction to the analysis of biomarker climate proxies in marine sediments, Org. Geochem., 34, 1517–1523, 2003.
Krissek, L. A.: Late Cenozoic Ice-Rafting Records From Leg 145 Sites In The North Pacific: Late Miocene Onset, Late Pliocene Intensification and Pliocene-Pleistocene Events, in: Proceedings of the Ocean Drilling Scientific Results, edited by: Rea, D. K., Basov, L. A., Scholl, D. W., and Allan, J. F., Ocean Drilling Program, College Station, TX, Sci. Results, 145, 179–194, https://doi.org/10.2973/odp.proc.sr.145.118.1995, 1995.
Lawrence, K. T., Herbert, T. D., Brown, C. M., Raymo, M. E., and Haywood, A. M.: High-amplitude variations in North Atlantic sea surface temperature during the early Pliocene warm period, Paleoceanography, 24, PA2218, https://doi.org/10.1029/2008PA001669, 2009.
Lawrence, K. T., Sosdian, S., Wite, H. E., and Rosenthal, Y.: North Atlantic climate evolution trough the Plio-Pleistocene climate transitions, Earth Planet. Sc. Lett., 300, 329–342, 2010.
Lisiecki, L. E. and Raymo, M. E.: Pliocene-Pleistocene stack of globally distributed benthic stable oxygen isotope records, PANGAEA, https://doi.org/10.1594/PANGAEA.704257, 2005.
Livsey, D. N., Simms, A. R., Clary, W. G., Wellner, J. S., Anderson, J. B., and Chandler, J. P.: Fourier grain-shape analysis of Antarctic marine core: the relative influence of provenance and glacial activity on grain shape, J. Sediment. Res., 83, 80–90, 2013.
Locarnini, R. A., Mishonov, A. V., Antonov, J. I., Boyer, T. P., Garcia, H. E., Baranova, O. K., Zweng, M. M., Paver, C. R., Reagan, J. R., Johnson, D. R., Hamilton, M., and Seidov, D.: World Ocean Atlas 2013, Volume 1: Temperature, edited by: Levitus, S. and Mishonov, A., NOAA Atlas NESDIS 73, 40 pp., 2013.
Martínez-Botí, M. A., Foster, G. L. Chalk, T. B., Rohling, E. J., Sexton, P. F., Lunt, D. J., Pancost, R. D., Badger, M. P. S., and Schmidt, D. N.: Plio-Pleistocene climate sensitivity evaluated using high-resolution CO2 records, Nature, 518, 49–54, https://doi.org/10.1038/nature14145, 2015.
Martínez-García, A., Rosell-Mele, A., McClymont, E. L., Gersonde, R., and Haug, G.: Subpolar Link to the Emergence of the Modern Equatorial Pacific Cold Tongue, Science, 328, 1550–1553, 2010a.
Martínez-García, A., Rosell-Melé, A., McClymont, E. L., Gersonde, R., Haug, G. H.: (Table S3) Sea surface temperature and relative abundance of C37:4 alkenone in ODP Site 145-882, PANGAEA, https://doi.org/10.1594/PANGAEA.771707, 2010b.
Martrat, B., Grimalt, J. O., Shackleton, N. J., de Abreu, L., Hutterli, M. A., and Stocker, T. F.: Four Climate Cycles of Recurring Deep and Surface Water Destabilizations on the Iberian Margin, Science, 317, 502–507, 2007.
Maslin, M. A., Haug, G. H., Sarnthein, M., and Tiedemann, R.: The progressive intensification of Northern Hemisphere glaciation as seen from the North Pacific, Geol. Rundsch., 85, 452–465, 1996.
Matthews, J.: The Assessment of a Method for the Determination of Absolute Pollen Frequencies, New Phytol., 68, 161–166, https://doi.org/10.1111/j.1469-8137.1969.tb06429.x, 1969.
McCalpin, J. P., Bruhn, R. L., Pvlis, T. L., Gutierres, F., Guerrero, J., and Lucha, P.: Antislope scarps, gravitational spreading, and tectonic faulting in the western Yakutat microplate, south coastal Alaska, Geosphere, 7, 1143–1158, 2011.
McClymont, E. L., Rosell-Melé, A., Haug, G., and Lloyd, J. M.: Expansion of subarctic water masses in the North Atlantic and Pacific oceans and implications for mid-Pleistocene ice sheet growth, Paleoceanography, 23, PA4214, https://doi.org/10.1029/2008PA001622, 2008.
McClymont, E. L., Elmore, A. C., Kender, S., Leng, M. J., Greaves, M., and Elderfield, H.: Pliocene-Pleistocene evolution of sea surface and intermediate water temperatures from the southwest Pacific, Paleoceanography, 31, 895–913, 2016.
Mertens, K. N., Verhoeven, K., Verleye, T., Louwye, S., Amorim, A., Ribeiro, S., Deaf, A. S., Harding, I. C., De Schepper, S., González, C., Kodrans-Nsiah, M., De Vernal, A., Henry, M., Radi, T., Dybkjaer, K., Poulsen, N. E., Feist-Burkhardt, S., Chitolie, J., Heilmann-Clausen, C., Londeix, L., Turon, J. L., Marret, F., Matthiessen, J., McCarthy, F. M. G., Prasad, V., Pospelova, V., Kyffin Hughes, J. E., Riding, J. B., Rochon, A., Sangiorgi, F., Welters, N., Sinclair, N., Thun, C., Soliman, A., Van Nieuwenhove, N., Vink, A., and Young, M.: Determining the absolute abundance of dinoflagellate cysts in recent marine sediments: The Lycopodium marker-grain method put to the test, Rev. Palaeobot. Palyno., 157, 238–252, https://doi.org/10.1016/j.revpalbo.2009.05.004, 2009.
Molnia, B. F.: Glaciers of North America – Glaciers of Alaska, in: Satellite image atlas of glaciers of the world, edited by: Williams Jr., R. S. and Ferrigno, J. G., U.S. Geological Survey Professional Paper 1386-K, 525 pp., 2008.
Mudelsee, M. and Raymo, M. E.: Slow dynamics of the Northern Hemisphere glaciation, Paleoceanography, 20, PA4022, https://doi.org/10.1029/2005PA001153, 2005.
Müller, J., Romero, O. Cowan, E. A., McClymont, E. L., Forwick, M., Asahi, H., Marz, C., Moy, C. M., Suto, I., Mix, A., and Stoner, J.: Cordilleran ice-sheet growth fueled primary productivity in the Gulf of Alaska, northeast Pacific Ocean, Geology, 46, 307–310, 2018.
Müller, P. J., Kirst, G., Ruhland, G., von Storch I., and Rosell-Melé, A.: Calibration of the alkenone paleotemperature index UK37' based on core-tops from the eastern South Atlantic and the global ocean (60∘ N–60∘ S), Geochim. Cosmochim. Ac., 62, 1757–1772, https://doi.org/10.1016/S0016-7037(98)00097-0, 1998.
Naafs, B. D. A., Hefter, J., Acton, G., Haug, G. H., Martínez-García, A., Pancost, R., and Stein, R.: Strengthening of the North American dust sourcesduring the late Pliocene (2.7 Ma), Earth Planet. Sc. Lett., 317–318, 8–19, https://doi.org/10.1016/j.epsl.2011.11.026, 2012.
Nie, J., King, J., Liu, Z., Clemens, S., Prell, W., and Fang, X., Surface-water freshening: A cause for the onset of North Pacific stratification from 2.75 Ma onward?, Global Planet. Change 64, 49–52, https://doi.org/10.1016/j.gloplacha.2008.08.003, 2008.
Pagani, M., Liu, Z., La Riviere, J., and Ravelo, A. C.: High Earth-system climate sensitivity determined from Pliocene carbon dioxide concentrations, Nat. Geosci., 3, 27–30, 2010.
Pickart, R. S., Macdonald, A. M., Moore, G. W. K., Renfrew, I. A., Walsh, J. E., and Kessler, W. S.: Seasonal evolution of Aleutian low pressure systems: implications for the North Pacific subpolar circulation, J. Phys. Oceanogr., 39, 1317–1339, 2009.
Powell, R. D. and Molnia, B. F., Glacimarine sedimentary processes, facies and morphology of the south-southeast Alaska shelf and fjords, Mar. Geol., 85, 359–390, https://doi.org/10.1016/0025-3227(89)90160-6, 1989.
Prahl, F. G., Muehlhausen, L. A., and Zahnle, D. L.: Further evaluation of long-chain alkenones as indicators of paleoceanographic conditions, Geochim. Cosmochim. Ac., 52, 2303–2310, 1988.
Prueher, L. M. and Rea, D. K.: (Table 1) Age, magnetic susceptibility, and mass accumulation rate of volcanic glass and IRD from ODP Site 145-887, PANGAEA, https://doi.org/10.1594/PANGAEA.706309, 2001.
Raymo, M. E., Grant, B., Horowitz, M., and Rau, G. H.: Mid-Pliocene warmth: stronger greenhouse and stronger conveyor, Mar. Micropalaeontol., 27, 313–326, 1996.
Rea, D. K., Basov, I. A., Krissek, L. A., and the Leg 145 Scientific Party: Scientific Results of drilling the North Pacific Transect, in: Proceedings of the Ocean Drilling Program, edited by: Rea, D. K., Basov, I. A., Scholl, D. W., and Allan, J. F., Scientific Results, 145, 577–596, 1995.
Reece, R. S., Gulick, S. P. S., Horton, B. K., Christeson, G. L., and Worthington, L. L.: Tectonic and climatic influence of the evolution of the Surveyor Fan and Channel system, Gulf of Alaska, Geosphere, 7, 830–844, 2011.
Rosell-Melé, A., Carter, J. F., Parry, A. T., and Eglinton, G.: Determination of the UK37 Index in Geological Samples, Analytical Chemistry, 67, 1283–1289, 1995.
Rodionov, S. N., Bond, N. A., and Overland, J. E.: The Aleutian Low, storm tracks, and winter climate variability in the Bering Sea, Deep-Sea Res. Pt. II, 54, 2560–2577, https://doi.org/10.1016/j.dsr2.2007.08.002, 2007.
Salzmann, U., Williams, M., Haywood, A. M., Johnson, A. I. A., Kender, S., and Zalasiewicz, J.: Climate and environment of a Pliocene warm world, Palaeogeogr. Palaeocl., 309, 1–8, 2011.
Sánchez-Montes, M. L., McClymont, E. L., Lloyd, J. M., Müller, J., Cowan, E. A., and Zorzi, C.: Alkenone sea surface temperatures, ice rafted debris, terrestrial/aquatic n-alkane ratio, pollen counts and a new age and depth models from IODP Expedition 341 Site U1417, Gulf of Alaska, PANGAEA, https://doi.org/10.1594/PANGAEA.899064, 2019.
Schlitzer, R.: Ocean Data View, available at: https://odv.awi.de/, last access: 9 December 2018.
Seki, O., Foster, G. J., Schmidt, D. N., Mackensen, A., Kawamura, K., and Pancost, R. D.: Alkenone and boron-based Pliocene pCO2 records, Earth Planet. Sc. Lett., 292, 201–211, https://doi.org/10.1016/j.epsl.2010.01.037, 2010a.
Seki, O., Foster, G. L., Schmidt, D. N., Mackensen, A., Kawamura, K., and Pancost, R. D.: Alkenone and boron based Oligocene pCO2 records, PANGAEA, https://doi.org/10.1594/PANGAEA.732923, 2010b.
Spies, R. B., Long-term Ecological Change in the Northern Gulf of Alaska, Elsevier, ISBN 978-0-444-52960-2, 2007.
St. John, K. E. K. and Krissek, L. A.: Regional patterns of Pleistocene ice-rafted debris flux in the North Pacific, Paleoceanography, 14, 653–662, 1999.
Tierney, J. E. and Tingley, M. P., BAYSPLINE: A new calibration for the alkenone paleothermometer, Paleoceanography and Paleoclimatology, 33, 281–301, 2018.
Walinsky, S. E., Prahl, F. G., Mix, A. C., Finney, B. P., Jaeger, J. M., and Rosen, G. P.: Distribution and composition of organic matter in surface sediments of coastal southeast Alaska, Cont. Shelf Res., 29, 1565–1579, https://doi.org/10.1016/j.csr.2009.04.006, 2009.
Weingartner, T.: The physical environment of the Gulf of Alaska, in: Long-term Ecological Change in the Northern Gulf of Alaska, edited by: Spies, R. B., Elsevier, Oxford, chap. 2.2, 608 pp., 2007.
Weingartner, T., Danienlson, S., Shipton, P., and Leech, D.: GAK 1 Time Series, available at: http://www.ims.uaf.edu/gak1/, last access: 23 December 2016.
Zachos, J., Pagani, M., Sloan, L., Thomas, E., and Billups, K.: Trends, rhythms, and aberrations in global climate 65 Ma to present, Science, 292, 686–693, 2001.